

Differential expression of gene co-expression networks related to the mTOR signaling pathway in bipolar disorder
- PMID: 35508467
- PMCID: PMC9067344
- DOI: 10.1038/s41398-022-01944-8
Differential expression of gene co-expression networks related to the mTOR signaling pathway in bipolar disorder
Erratum in
-
Correction: Differential expression of gene co-expression networks related to the mTOR signaling pathway in bipolar disorder.Transl Psychiatry. 2022 May 31;12(1):218. doi: 10.1038/s41398-022-01979-x. Transl Psychiatry. 2022. PMID: 35641496 Free PMC article. No abstract available.
Abstract
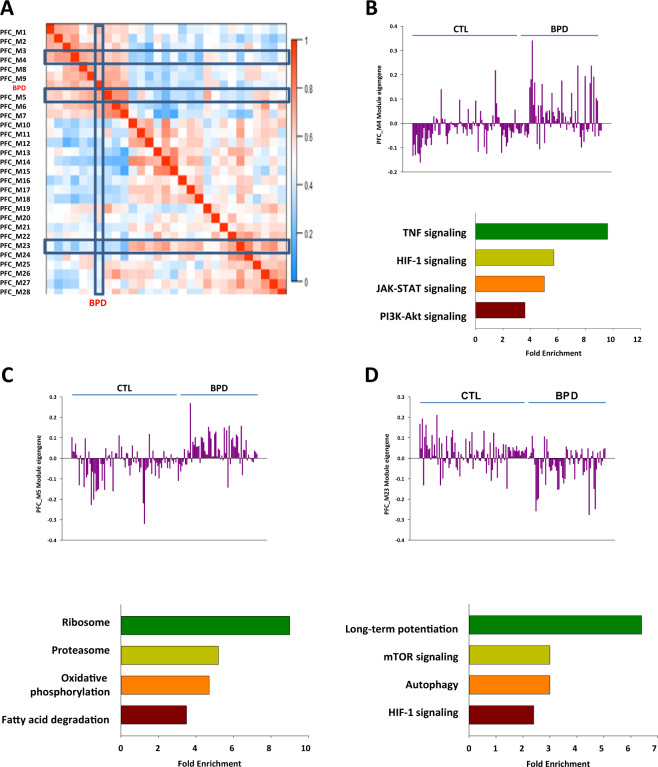
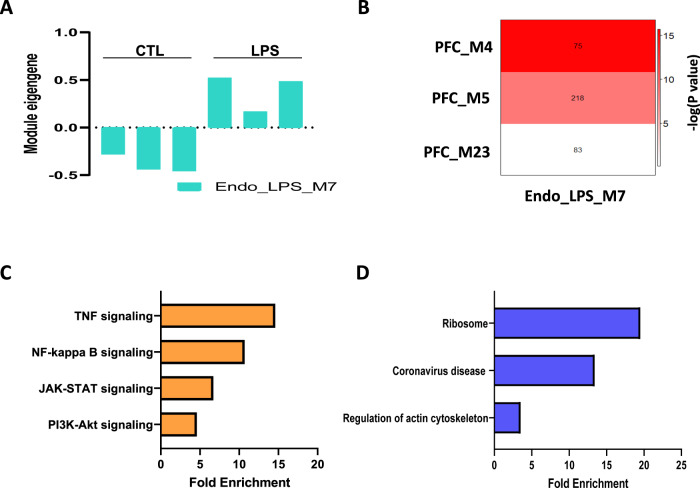
Bipolar disorder (BPD) is a severe mental illness characterized by episodes of depression and mania. To investigate the molecular mechanisms underlying the pathophysiology of bipolar disorder, we performed transcriptome studies using RNA-seq data from the prefrontal cortex (PFC) of individuals with BPD and matched controls, as well as data from cell culture and animal model studies. We found 879 differentially expressed genes that were also replicated in an independent cohort of post-mortem samples. Genes involving the mechanistic target of rapamycine (mTOR) pathway were down-regulated, while genes interrelated with the mTOR pathway such as Janus kinase (JAK)-signal transducer and activator of transcription (STAT) pathway were up-regulated. Gene co-expression network analyses identified a module related to the mTOR pathway that was up-regulated in BPD and also enriched for markers of endothelial cells. We also found a down-regulated co-expression module enriched for genes involved in mTOR signalling and in mTOR related pathways and enriched with neuronal markers. The mTOR related modules were also replicated in the independent cohort of samples. To investigate whether the expression of the modules related to mTOR signalling pathway could be differentially regulated in different cell types we performed comparative network analyses in experimental models. We found both up-regulated modules in the PFC significantly overlapped with an up-regulated module in the brain endothelial cells from mice treated with lipopolysaccharides (LPS) and mTOR related pathways such as JAK-STAT, PI3K-Akt and ribosome were enriched in the common genes. In addition, the down-regulated module in the PFC significantly overlapped with a down-regulated module from neurons treated with the mTOR inhibitor, Torin1 and mTOR signalling, autophagy, and synaptic vesicle cycles were significantly enriched in the common genes. These results suggest that co-expression networks related to mTOR signalling pathways may be up- or down-regulated in different cell types in the PFC of BPD. These results provide novel insights into the molecular mechanisms underlying the pathophysiology of BPD.
© 2022. The Author(s).
Conflict of interest statement
The authors declare no competing interests.
Figures


References
-
- Vieta E, Berk M, Schulze TG, Carvalho AF, Suppes T, Calabrese JR, et al. Bipolar disorders. Nat Rev Dis Prim. 2018;4:18008. - PubMed
-
- Grande I, Berk M, Birmaher B, Vieta E. Bipolar disorder. Lancet. 2016;387:1561–72. - PubMed
-
- Ryan MM, Lockstone HE, Huffaker SJ, Wayland MT, Webster MJ, Bahn S. Gene expression analysis of bipolar disorder reveals downregulation of the ubiquitin cycle and alterations in synaptic genes. Mol Psychiatry. 2006;11:965–78. - PubMed
Publication types
MeSH terms
Substances
LinkOut - more resources
Full Text Sources
Medical
Miscellaneous
