. 2022 May 4;13(1):2447.
doi: 10.1038/s41467-022-30119-8.

Dual functions of microRNA-17 in maintaining cartilage homeostasis and protection against osteoarthritis

Affiliations

Dual functions of microRNA-17 in maintaining cartilage homeostasis and protection against osteoarthritis

Yun Zhang et al. Nat Commun. .

Abstract

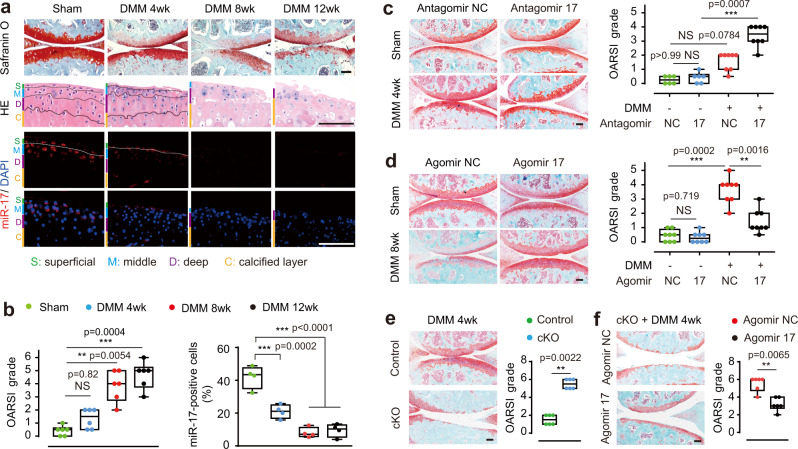
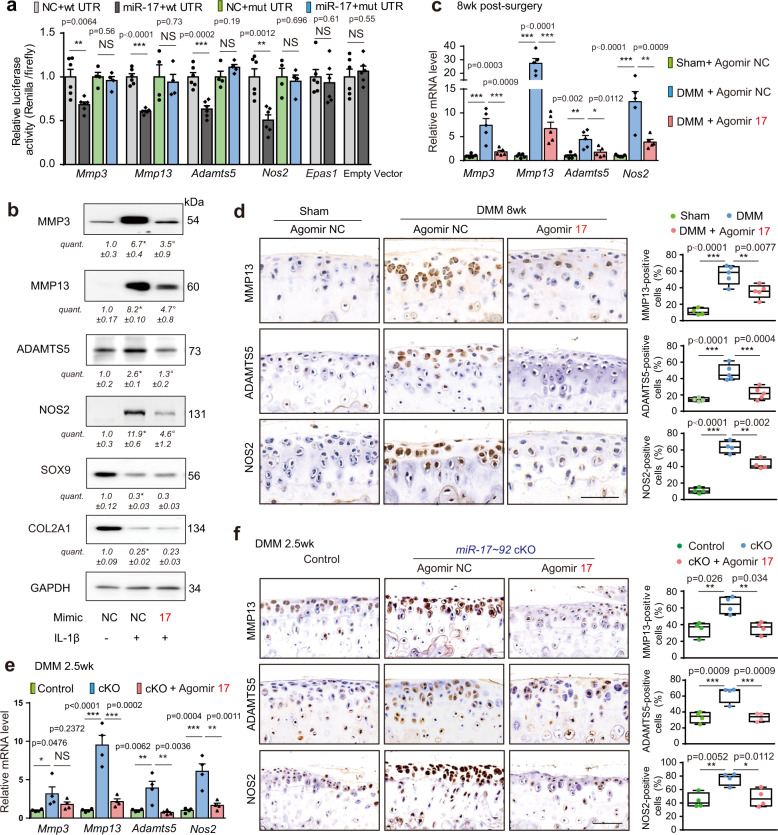
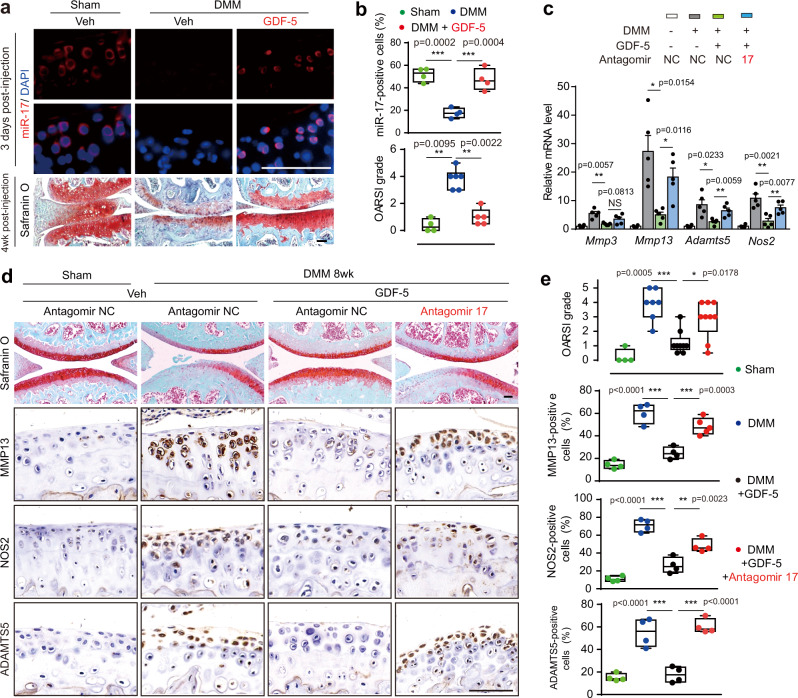
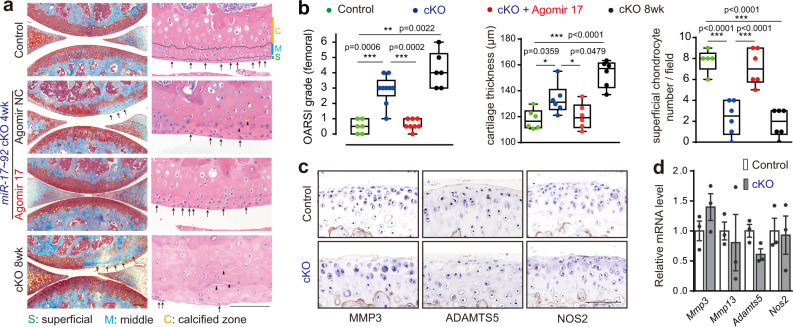
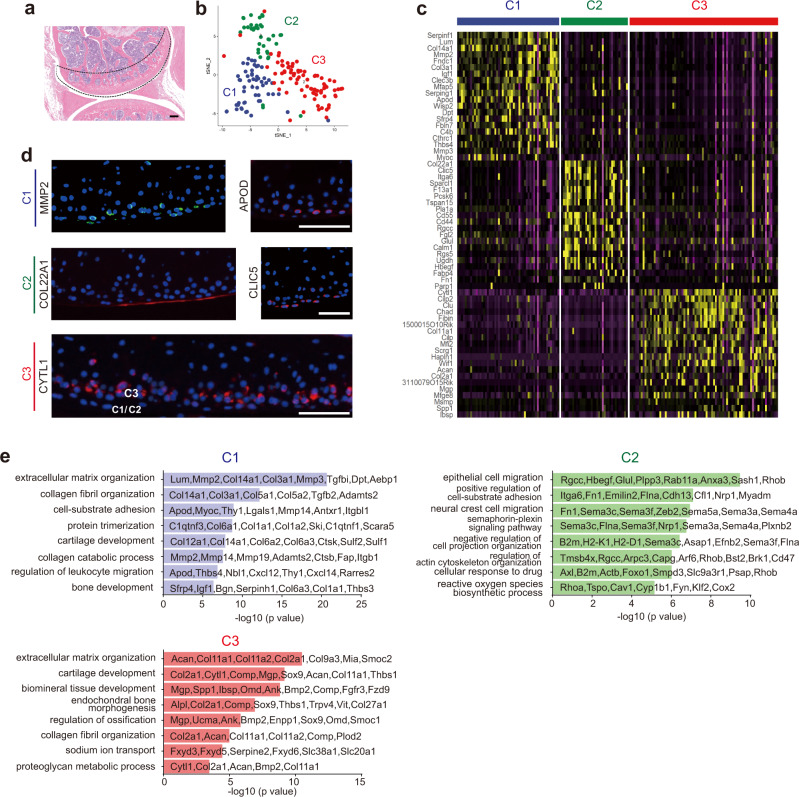
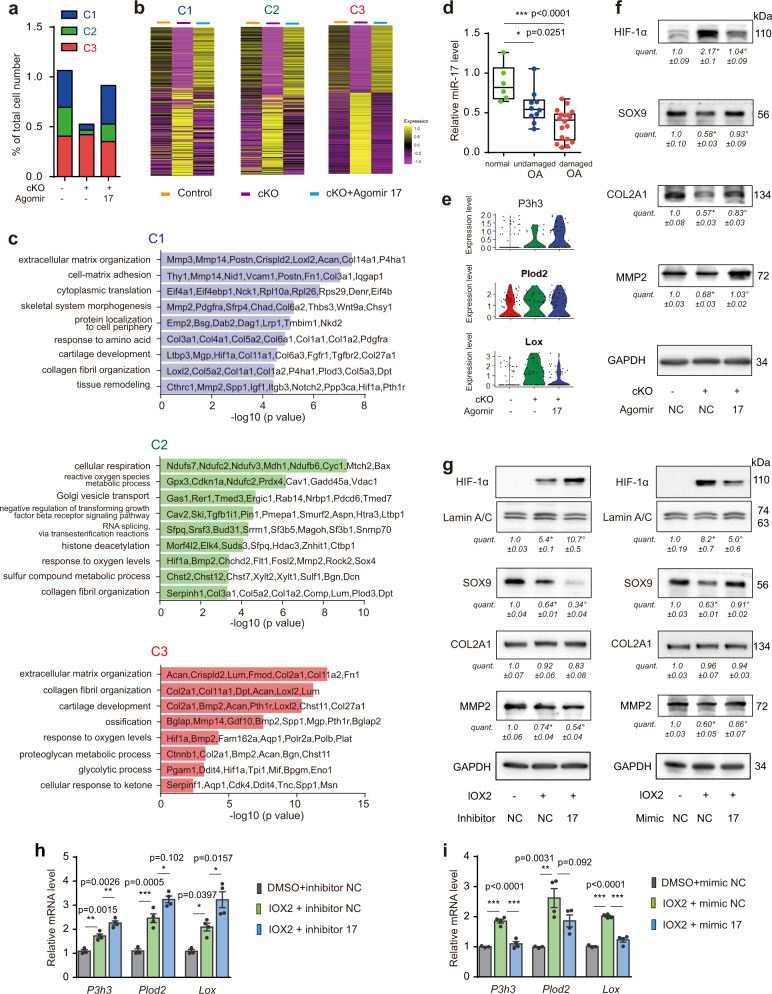
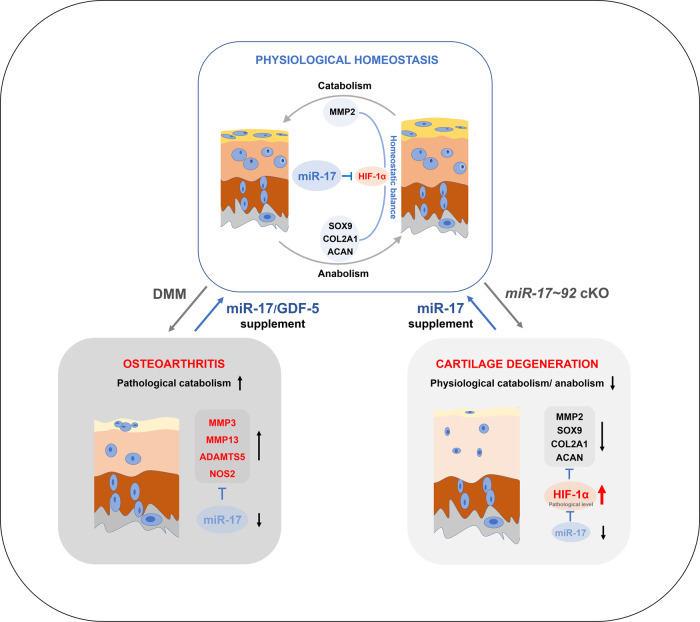
Damaged hyaline cartilage has no capacity for self-healing, making osteoarthritis (OA) "difficult-to-treat". Cartilage destruction is central to OA patho-etiology and is mediated by matrix degrading enzymes. Here we report decreased expression of miR-17 in osteoarthritic chondrocytes and its deficiency contributes to OA progression. Supplementation of exogenous miR-17 or its endogenous induction by growth differentiation factor 5, effectively prevented OA by simultaneously targeting pathological catabolic factors including matrix metallopeptidase-3/13 (MMP3/13), aggrecanase-2 (ADAMTS5), and nitric oxide synthase-2 (NOS2). Single-cell RNA sequencing of hyaline cartilage revealed two distinct superficial chondrocyte populations (C1/C2). C1 expressed physiological catabolic factors including MMP2, and C2 carries synovial features, together with C3 in the middle zone. MiR-17 is highly expressed in both superficial and middle chondrocytes under physiological conditions, and maintains the physiological catabolic and anabolic balance potentially by restricting HIF-1α signaling. Together, this study identified dual functions of miR-17 in maintaining cartilage homeostasis and prevention of OA.


Conflict of interest statement

The authors declare no competing interests.

Figures

Fig. 1
Fig. 1. MiR-17 deficiency exacerbated cartilage destruction in DMM-induced OA.
a Representative images from the safranin O/fast green and H&E staining, as well as FISH analysis of miR-17 in knee joint sections at 4, 8, or 12 weeks after sham operation or DMM surgery. Male mice underwent surgeries at the age of 10-week old. Cartilage structure was visualized by safranin O/fast green. H&E staining showed layers of articular cartilage. The color bars at the left side of pictures were used to demonstrate the different layers. The blue staining by DAPI showed nuclei to visualize the cellular location of miR-17. The images are representative of three independent experiments. b OARSI scores (n = 6 mice at each timepoint) and percentage of miR-17-positive cells in FISH staining (n = 4 mice at each timepoint) from mice at indicated timepoints after operation. OARSI scores were used to quantify the cartilage destruction from safranin O staining sections. c Safranin O staining and scoring of OARSI grade in mice subjected to sham operation or DMM surgery and weekly intra-articular injection of antagomir-NC or antagomir-17 (3 nmol) for three times, starting from 1 week after surgery. n = 6 mice (sham + antagomir-NC, sham + antagomir-17); n = 8 mice (DMM + antagomir-NC, DMM + antagomir-17). d Representative images of safranin O/fast green staining of joint sections and OARSI scores. Agomir-NC or agomir-17 (1.5 nmol) was injected into knee joints 4 weeks after sham operation or DMM surgery. The injections were performed weekly for 4 times. n = 8 mice per group. e Representative images of safranin O/fast green staining and OARSI grade from miR-17~92 cKO mice and their control littermates (miR-17~92fl/fl) at 4 weeks after DMM surgery. n = 6 mice per group. The cKO mice and their controls were injected with tamoxifen at the age of 7-week old and performed surgeries at the age of 8-week old. f Representative images of safranin O/fast green staining and OARSI grade in miR-17~92 cKO mice subjected to DMM surgery and intra-articular injection of agomir-NC, or agomir-17 (2 nmol). The injections were preformed weekly for 3 times beginning at 1 week after surgery. n = 6 mice per group. Data are presented as boxplots. Boxplots: center line, median; box limits, 25 to 75th percentiles; whiskers, min to max. NS not significant, *P < 0.05, **P < 0.01, and ***P < 0.001. One-way ANOVA (nonparametric) with Dunn’s multiple comparisons test for OARSI grade in (b, c); Mann–Whitney U test (two sided) for (d, e, f); one-way ANOVA with Bonferroni’s test for percentage of positive cells in (b). All scale bars, 100 μm. All the analyses were sourced from tibial cartilage. Source data are provided as a Source Data file.
Fig. 2
Fig. 2. miR-17 inhibits cartilage destruction by targeting multiple pathological catabolic factors.
a Luciferase activity of 293 T cells co-transfected with dual-luciferase reporter constructs containing wild-type or mutated 3′-UTRs, as well as negative control (mimic NC) or miR-17 mimic. The data presented are mean percentage changes over mimic NC ± s.e.m. n = 6 biologically independent samples (NC + wt UTR, miR-17+wt UTR); n = 4 biologically independent samples (NC + mut UTR, miR-17 + mut UTR). b Mouse articular chondrocytes were transfected with miR-17 mimic (50 nM) or mimic NC and treated with or without IL-1β (5 ng/mL) for 24 h. The protein levels of catabolic and anabolic factors were determined by western blot followed by densitometry analysis. Blots are representative of three independent experiments. c, d qRT-PCR analysis of catabolic genes in knee cartilage (c), and representative images of IHC staining and quantification of MMP13+, ADAMTS5+ and NOS2+ cells in joint sections (d) of mice subjected to sham or DMM surgery and intra-articular injections of agomir-NC or agomir-17 (1.5 nmol) for 4 weeks, beginning at 4 weeks after surgery. n = 5 biologically independent samples per group in c. For MMP13 and ADAMTS5 staining, n = 4 mice (sham); n = 5 mice (DMM, DMM + agomir-17). For NOS2 staining, n = 4 mice per group. e, f qRT-PCR analysis of catabolic genes (e) and representative images of MMP13, ADAMTS5, and NOS2 immunostaining, and quantification of positive cells (f) from knee joints of cKO mice subjected to DMM surgery and intra-articular injection of agomir-NC, or agomir-17 (2 nmol). The injections were performed at 1 week after surgery and samples were collected at 2.5 weeks after surgery. n = 4 biologically independent samples per group in (e); n = 4 mice per group in (f). All scale bars, 100 μm. Data are presented as mean ± s.e.m. or boxplots (center line, median; box limits, 25 to 75th percentiles; whiskers, min to max), and dots represent individual mice or biologically independent samples. NS, not significant, *P < 0.05, **P < 0.01, and ***P < 0.001 in (a, cf). *P < 0.05 versus control group, °P < 0.05 versus IL-1β + mimic NC in (b). Two-sided Student’s t test for (a); one-way ANOVA with Bonferroni’s test for (bf). Exact P values in (b): *P = 0.0011, °P = 0.0205 (MMP3); *P <0.0001, °P = 0.0039 (MMP13); *P = 0.0015, °P = 0.0040 (ADAMTS5); *P = 0.0001, °P = 0.0013 (NOS2); *P = 0.0013, P > 0.9999 (SOX9); *P = 0.0001, P > 0.9999 (COL2A1). Source data are provided as a Source Data file.
Fig. 3
Fig. 3. Endogenous miR-17 was upregulated by GDF-5 to suppress cartilage destruction in DMM mice.
a, b FISH for miR-17 and safranin O/fast green staining of joint sections (a), and quantification of miR-17-positive cells and OARSI scores (b). Veh (PBS) or GDF-5 (100 ng per injection) was injected weekly for 4 weeks, beginning at 4 weeks after sham or DMM surgery. n = 4 mice per group for cell counting. For OARSI grade, n = 4 mice (sham); n = 6 mice (DMM); n = 5 mice (DMM + GDF-5). ce qRT-PCR analysis of catabolic genes (c); safranin O/fast green staining and IHC staining for MMP13, ADAMTS5 and NOS2 (d); OARSI scores; and quantification of cells positive for immunostaining (e) from knee joints. A combination of GDF-5 (0 or 100 ng) and 3 nmol of the antagomir (antagomir-17 or antagomir-NC) was injected intra-articularly. The injections were performed weekly for 4 weeks, beginning at 4 weeks after sham or DMM surgery. n = 4 biologically independent samples (sham + antagomir-NC) and n = 5 biologically independent samples for other groups in (c). For OARSI scores, n = 4 mice (sham); n = 7 mice (DMM); n = 9 mice (GDF-5 + antagomir-NC, GDF-5 + antagomir-17). For MMP13 staining, n = 5 mice (antagomir-17); n = 4 mice in other groups. For NOS2 and ADAMTS5 staining, n = 4 mice per group. All scale bars, 100 μm. Data were presented as boxplots or mean ± s.e.m. Boxplots: center line, median; box limits, 25th to 75th percentiles; whiskers, min to max. *P < 0.05, **P < 0.01, and ***P < 0.001. One-way ANOVA with Bonferroni’s test for percentage of positive cells; two-sided Mann–Whitney U test for OARSI grade; two-sided Student’s t test for (c). Source data are provided as a Source Data file.
Fig. 4
Fig. 4. Cartilage degeneration was developed in miR-17~92 cKO mice.
a, b Safranin O/fast green staining and H&E staining of knee joint cartilage (a), OARSI grade (n = 6 mice in control and cKO 8wk; n = 9 mice in cKO; n = 8 mice in cKO + agomir-17), cartilage thickness (n = 6 mice per group) and cell counts of superficial chondrocytes (n = 5 mice in control; n = 6 mice for other groups) in femoral condylar cartilage (b) from miR-17~92fl/fl (control), miR-17~92 cKO and agomir-17-injected cKO mice at 4 or 8 weeks after tamoxifen injection, were presented. The arrows in (a) indicated cartilage degeneration (left panels) and superficial chondrocytes (right panels). The triangles in (a) indicated splitting in cartilage matrix. c, d IHC staining of MMP13, ADAMTS5 and NOS2 (c), and qRT-PCR analysis of catabolic factors (d) in cartilage of control and miR-17~92 cKO mice at 4 weeks after tamoxifen injection. n = 4 mice per group in (c) and n = 3 mice per group in (d). Data were presented as boxplots (center line, median; box limits, 25 to 75th percentiles; whiskers, min to max), or the mean ± s.e.m. values. *P < 0.05, and ***P < 0.001. Mann–Whitney U test (two sided) for OARSI grade; one-way ANOVA with Bonferroni’s test for cartilage thickness and cell number; two-sided Student’s t test for qRT-PCR. All scale bars, 100 μm. Exact P values in (d): 0.2236 (Mmp3), 0.7143 (Mmp13),0.0513 (Adamts5), 0.8648 (Nos2). Source data are provided as a Source Data file.
Fig. 5
Fig. 5. scRNA-seq analysis identified three subsets of chondrocytes.
a Medial femoral condyle tissue from the region enclosed by the dotted lines was isolated for cell dissociation. n = 9 mice. Scale bar, 250 μm. b Putative chondrocyte population (171 cells) and unsupervised clustering identified clusters C1, C2, and C3 in cartilage. c Heatmap showing the expression of the top 20 identified significantly differentially expressed genes in clusters C1, C2, and C3. d Immunofluorescence staining of representative markers identified by scRNA-seq in articular cartilage. n = 3 independent experiments. All scale bars, 100 μm. e GO analysis and representative genes for clusters C1, C2, and C3.
Fig. 6
Fig. 6. MiR-17 maintains balanced anabolism and catabolism in subsets of articular chondrocytes.
a Cell percentages in each cluster of control, miR-17~92 cKO and cKO + agomir-17 mice. b Genes reversed by miR-17 supplementation in miR-17~92 cKO mice in clusters C1, C2, and C3. c GO analysis of genes upregulated in clusters C1, C2, and C3 in miR-17~92 cKO+ agomir-17 mice in (b). d qRT-PCR analysis of miR-17 expression in normal (n = 6), undamaged (n = 10) osteoarthritic and damaged (n = 18) osteoarthritic human cartilage. e Violin plots showing changes in levels of collagen-modifying genes in control, miR-17~92 cKO and cKO + agomir-17 mice. f Protein levels of HIF-1α, SOX9, COL2A1, and MMP2 in articular cartilage of control, miR-17~92 cKO and cKO + agomir-17 mice at 2 weeks after tamoxifen injections were determined by western blot followed by densitometry analysis. Blots are representative of three independent experiments. gi Mouse articular chondrocytes were transfected with miR-17 inhibitor (100 nM) or inhibitor NC or miR-17 mimic (50 nM) or mimic NC and treated with or without IOX2 (20 μM) for 72 h. The protein levels of HIF-1α, SOX9, COL2A1 and MMP2 were determined by western blot followed by densitometry analysis. Blots are representative of three independent experiments (g). The gene expression of P3h3, Plod2, and Lox were determined by qRT-PCR. n = 3 biologically independent samples (none-IOX2 treatment groups); n = 4 biologically independent samples (IOX2 treatment groups) (h, i). Data are presented as means ± s.e.m. or boxplots (center line, median; box limits, 25 to 75th percentiles; whiskers, min to max), and dots represent biologically independent samples. *P < 0.05, **P < 0.01, and ***P < 0.001 in (d, h, i); *P < 0.05 versus control group, °P < 0.05 versus cKO group in (f); *P < 0.05 versus none-IOX2 group, °P < 0.05 versus IOX2 with inhibitor/mimic NC group in (g) (one-way ANOVA with Bonferroni’s test). Exact P values in (f): *P = 0.0004, °P = 0.0005 (HIF-1α); *P = 0.0219, °P = 0.0467 (SOX9); *P = 0.0026, °P = 0.0303 (COL2A1); *P = 0.0003, °P = 0.0002 (MMP2). Exact P values in left panel of (g): *P < 0.0001, °P < 0.0001 (HIF-1α); *P = 0.0009, °P = 0.0025 (SOX9); P = 0.9211, P = 0.7283 (COL2A1); *P = 0.0162, °P = 0.0454 (MMP2). Exact P values in right panel of (g): *P = 0.0002, °P = 0.0140 (HIF-1α); *P < 0.0001, °P = 0.0001 (SOX9); P > 0.9999, P > 0.9999 (COL2A1); *P = 0.0024, °P = 0.0201 (MMP2). Source data are provided as a Source Data file.
Fig. 7
Fig. 7. Model depicting the mechanisms of miR-17 in maintaining cartilage homeostasis and prevention of OA.
MiR-17 is a regulator for HIF-1α in articular chondrocytes, and catabolic and anabolic balance was maintained under physiological HIF-1α expression. The cellular and ECM change of the articular cartilage was shown in mouse models of DMM or miR-17~92 cKO. The faded color in superficial and middle layers indicates ECM destruction or degeneration. In DMM-induced OA, pathological catabolic factors targeted by miR-17 were increased. In miR-17~92 cKO mice, miR-17 deficiency caused pathological increase of HIF-1α, and decreased the physiological catabolism and anabolism in chondrocytes. Supplementation with exogenous miR-17 or inducing endogenous miR-17 by GDF-5 treatment prevented OA and restored cartilage homeostasis.

References

    1. Hunter DJ, Bierma-Zeinstra S. Osteoarthritis. Lancet. 2019;393:1745–1759. doi: 10.1016/S0140-6736(19)30417-9. - DOI - PubMed
    1. Oo WM, Yu SP, Daniel MS, Hunter DJ. Disease-modifying drugs in osteoarthritis: current understanding and future therapeutics. Expert Opin. Emerg. Drugs. 2018;23:331–347. doi: 10.1080/14728214.2018.1547706. - DOI - PubMed
    1. Ferket BS, et al. Impact of total knee replacement practice: cost effectiveness analysis of data from the osteoarthritis initiative. BMJ. 2017;356:j1131. doi: 10.1136/bmj.j1131. - DOI - PMC - PubMed
    1. Poulet B, Staines KA. New developments in osteoarthritis and cartilage biology. Curr. Opin. Pharmacol. 2016;28:8–13. doi: 10.1016/j.coph.2016.02.009. - DOI - PubMed
    1. Grogan SP, et al. Zone-specific gene expression patterns in articular cartilage. Arthritis Rheum. 2013;65:418–428. doi: 10.1002/art.37760. - DOI - PMC - PubMed

Publication types