. 2022 May 4;13(1):2437.
doi: 10.1038/s41467-022-30104-1.

Potential fire risks in South America under anthropogenic forcing hidden by the Atlantic Multidecadal Oscillation

Affiliations

Potential fire risks in South America under anthropogenic forcing hidden by the Atlantic Multidecadal Oscillation

Yanfeng Wang et al. Nat Commun. .

Abstract

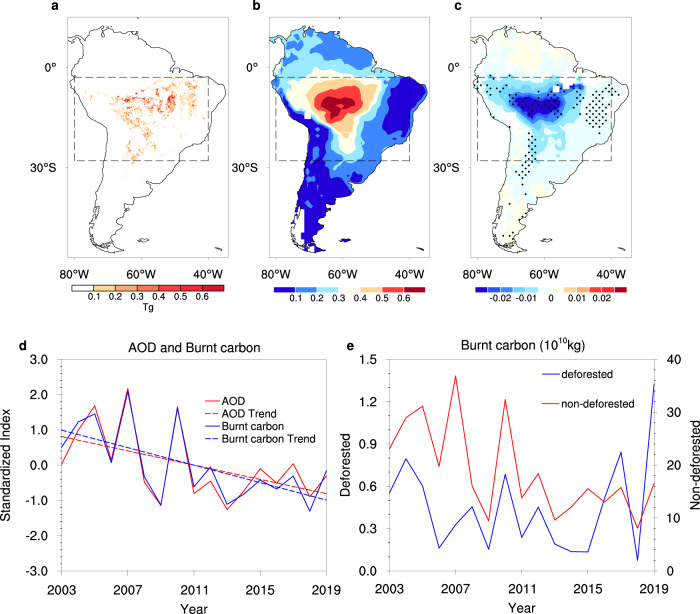
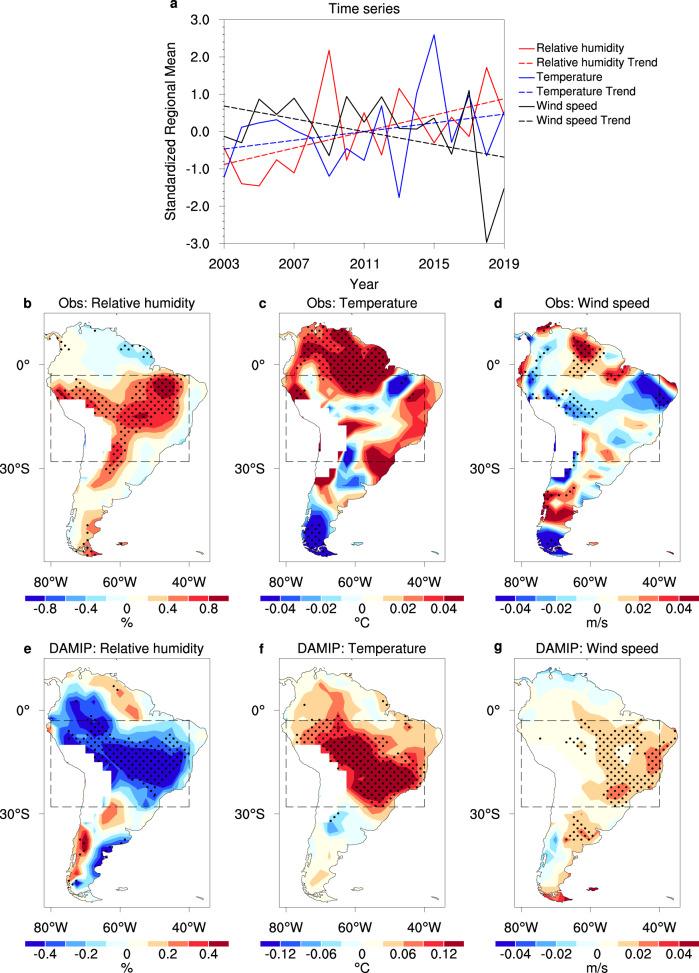
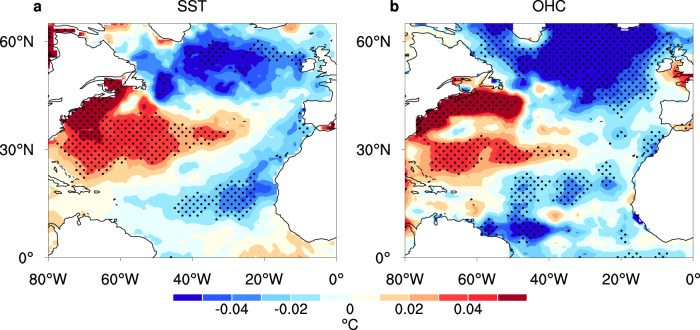
Fires in South America have profound effects on climate change and air quality. Although anthropogenic forcing has exacerbated drought and fire risks, the fire emissions and aerosol pollution in the southern Amazon and the Pantanal region showed a consistent long-term decrease during the dry season (August-October) between 2003 and 2019. Here, we find that the decreasing trend in fire emissions, mainly located in the non-deforested region, was associated with climatic conditions unfavorable for intensifying and spreading fires, including increased humidity and slower surface wind speed. These climatic trends can be attributed to weakening of the positive phase of the Atlantic Multidecadal Oscillation, which has strengthened the northeast trade winds within the region (3°S-13°N) and the northwest winds east of the Andes that transport more moisture into the southern Amazon and the Pantanal region. Our findings show the mitigating effects of weakening of the positive Atlantic Multidecadal Oscillation phase on human-induced intensification of fire risks in South America and warn of potentially increased risks of fires and aerosol pollution under intensified anthropogenic forcing in the future.


Conflict of interest statement

The authors declare no competing interests.

Figures

Fig. 1
Fig. 1. Burnt carbon and AOD in South America during the dry season in the time period 2003–2019.
a Cumulative amount of burnt carbon and b the seasonal-mean AOD. c Long-term trend of the AOD (units: yr−1), where the stippling indicates passing the Mann–Kendall test at the 0.1 significance level. The boxes outlined by black dashed lines show the location of the SAP region. d Time series and trend of standardized regionally averaged AOD and cumulative burnt carbon from fires in the SAP region. e Burnt carbon in the deforested and non-deforested areas of the SAP region.
Fig. 2
Fig. 2. Changes in the climatic conditions related to fires in South America during the dry season.
a Time series and trend of the observed standardized 925 hPa relative humidity, surface temperature, and surface wind speed in the SAP region during the time period 2003–2019. Long-term trends in the 925 hPa relative humidity (units: % yr−1), surface temperature (units: °C yr−1), and surface wind speed (units: m/s yr−1) from bd the observations (2003–2019) and eg anthropogenic forcing effects in the DAMIP dataset (2003–2014). Stippling indicates passing the Mann–Kendall test at the 0.1 significance level.
Fig. 3
Fig. 3. Long-term trends in the North Atlantic Ocean.
Long-term trends in the a SST (units: °C yr−1) and b OHC (units: °C yr−1) in the North Atlantic Ocean during the dry season for the time period 2003–2019. Stippling indicates passing the Mann–Kendall test at the 0.1 significance level.
Fig. 4
Fig. 4. Linkages among the AMO and the 925 hPa relative humidity in the SAP region.
a Standardized annual mean AMO index and the 925 hPa relative humidity (from the NCEP R1, R2, and JRA55 datasets) in the SAP region during the time period 1960–2019 after applying the 8-year running mean. The AMO index is detrended via the Residual method. bd Differences in the 925 hPa relative humidity, 850 hPa wind vectors, surface wind speed, and the 5-month SPEI between the negative (1969–1996 and 2015–2019) and positive (1960–1968 and 1997–2014) phases of the AMO. The linear trends for all variables in the time period 1960–2019 have been removed.

References

    1. Davidson EA, et al. The Amazon basin in transition. Nature. 2012;481:321–328. doi: 10.1038/nature10717. - DOI - PubMed
    1. Masson-Delmotte, V. et al. IPCC: The Physical Science Basis. Contribution of Working Group I to the Sixth Assessment Report of the Intergovernmental Panel on Climate Change. (Cambridge Univ. Press, 2021).
    1. Stocker, T. F. et al. IPCC: The Physical Science Basis. Contribution of Working Group I to the Fifth Assessment Report of the Intergovernmental Panel on Climate Change. (Cambridge Univ. Press, 2013).
    1. Malhi Y, et al. The regional variation of aboveground live biomass in old-growth Amazonian forests. Glob. Change Biol. 2006;12:1107–1138. doi: 10.1111/j.1365-2486.2006.01120.x. - DOI
    1. Lenton TM, et al. Tipping elements in the Earth’s climate system. Proc. Natl Acad. Sci. USA. 2008;105:1786. doi: 10.1073/pnas.0705414105. - DOI - PMC - PubMed

Publication types