. 2022 May 4;8(1):59.
doi: 10.1038/s41523-022-00422-0.

Lipid exposure activates gene expression changes associated with estrogen receptor negative breast cancer

Affiliations

Lipid exposure activates gene expression changes associated with estrogen receptor negative breast cancer

Shivangi Yadav et al. NPJ Breast Cancer. .

Erratum in

Abstract

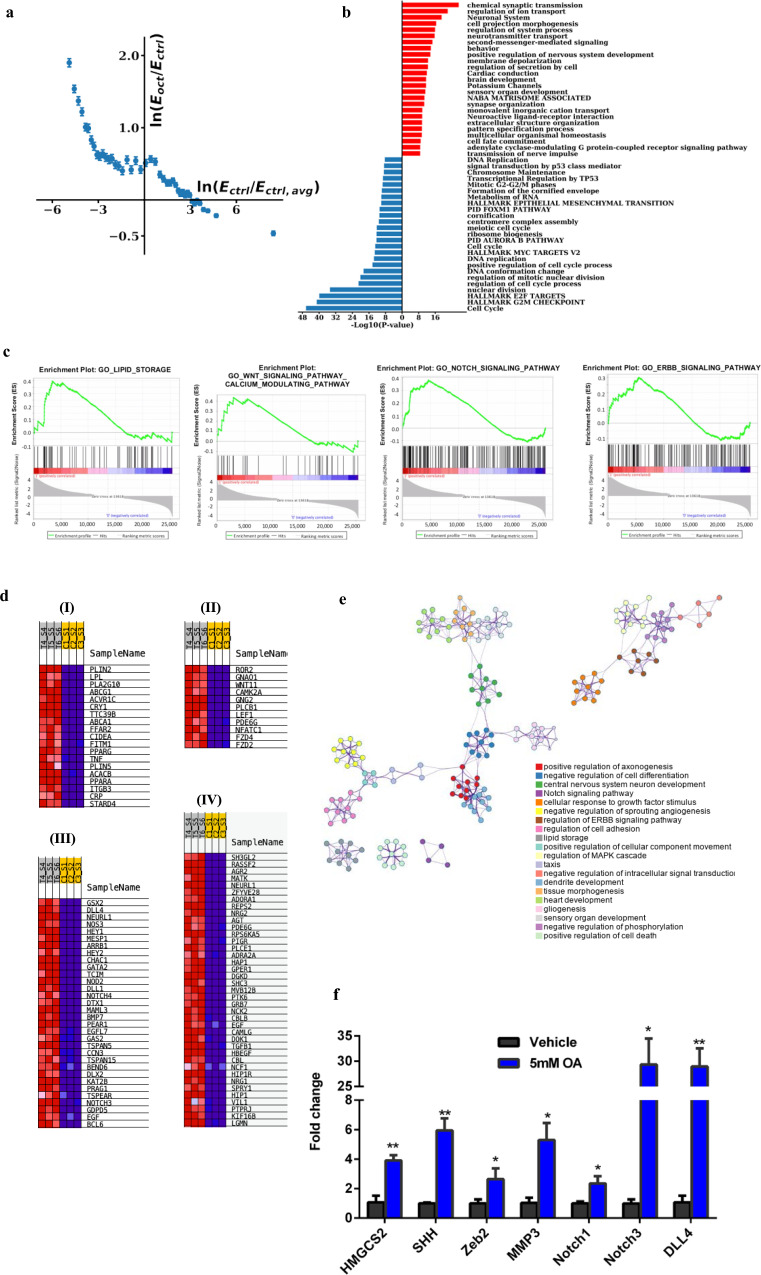
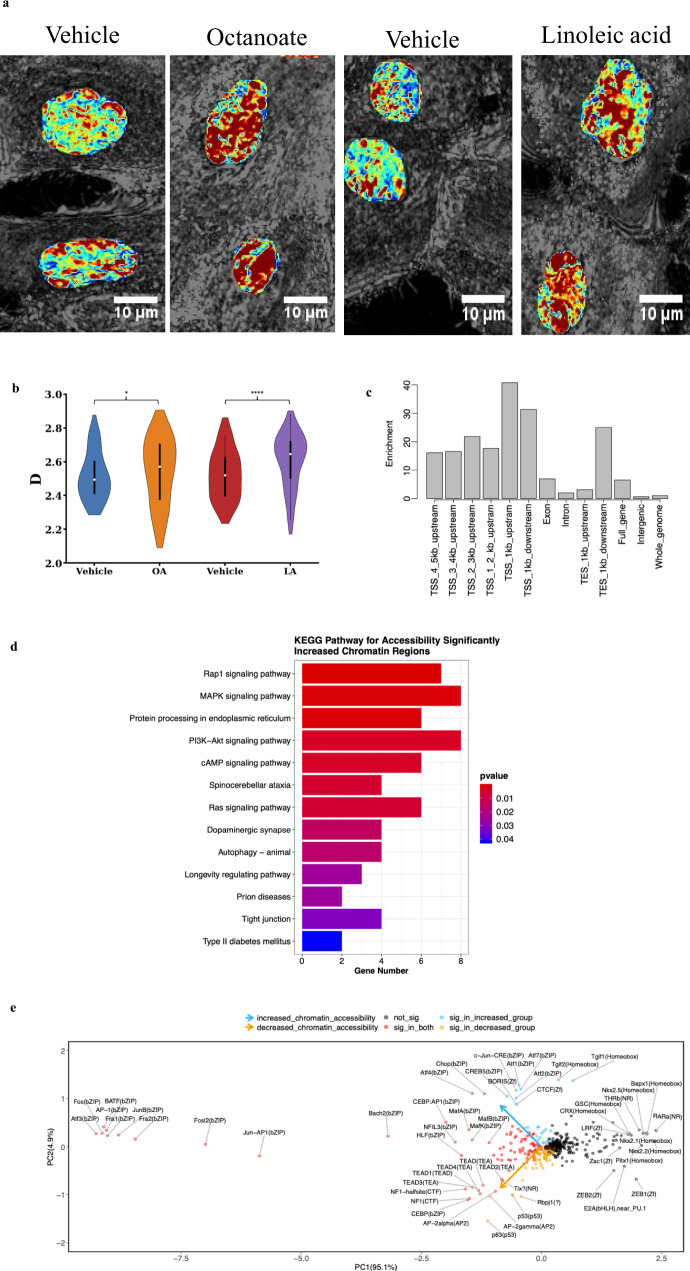
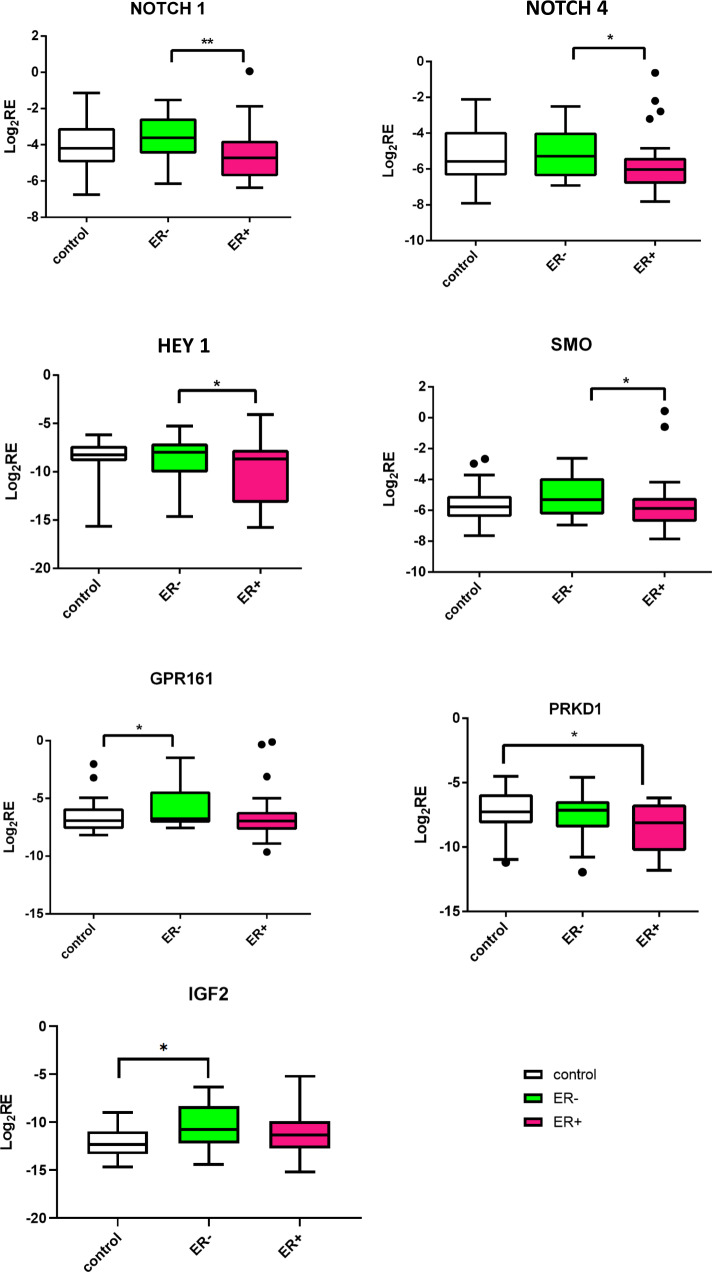
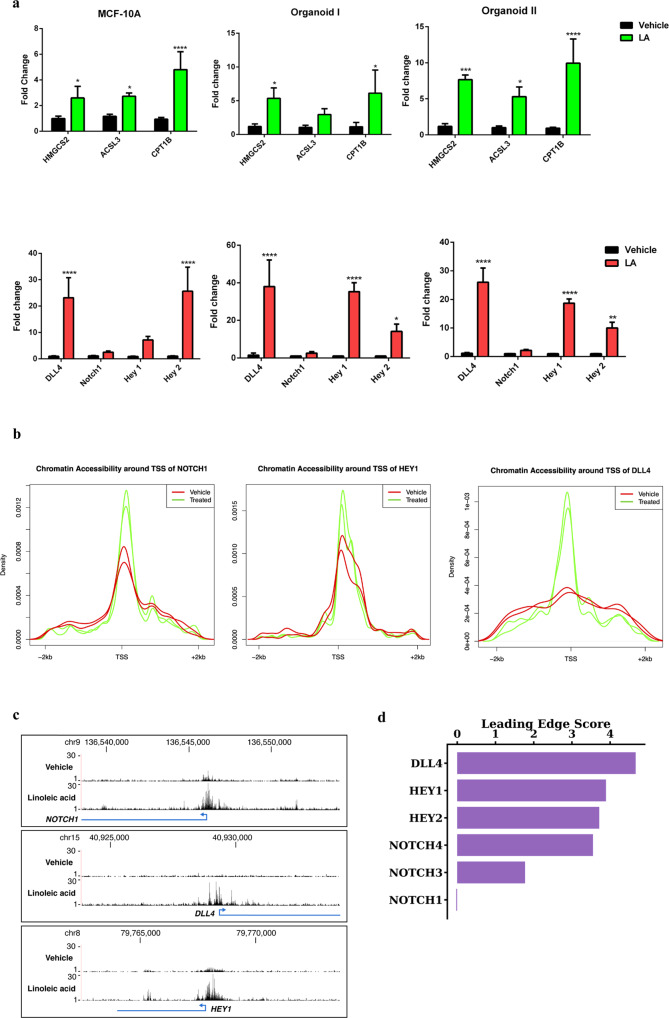
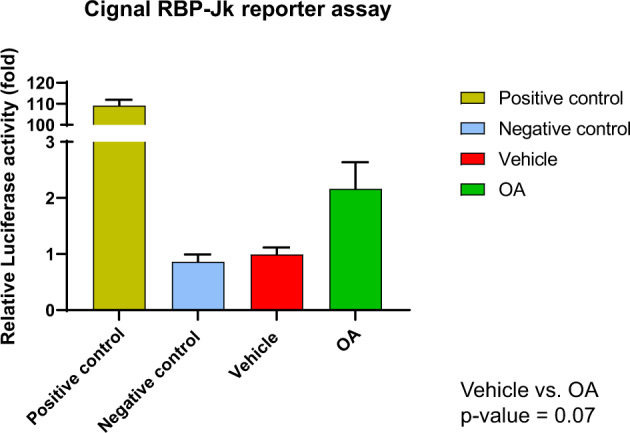
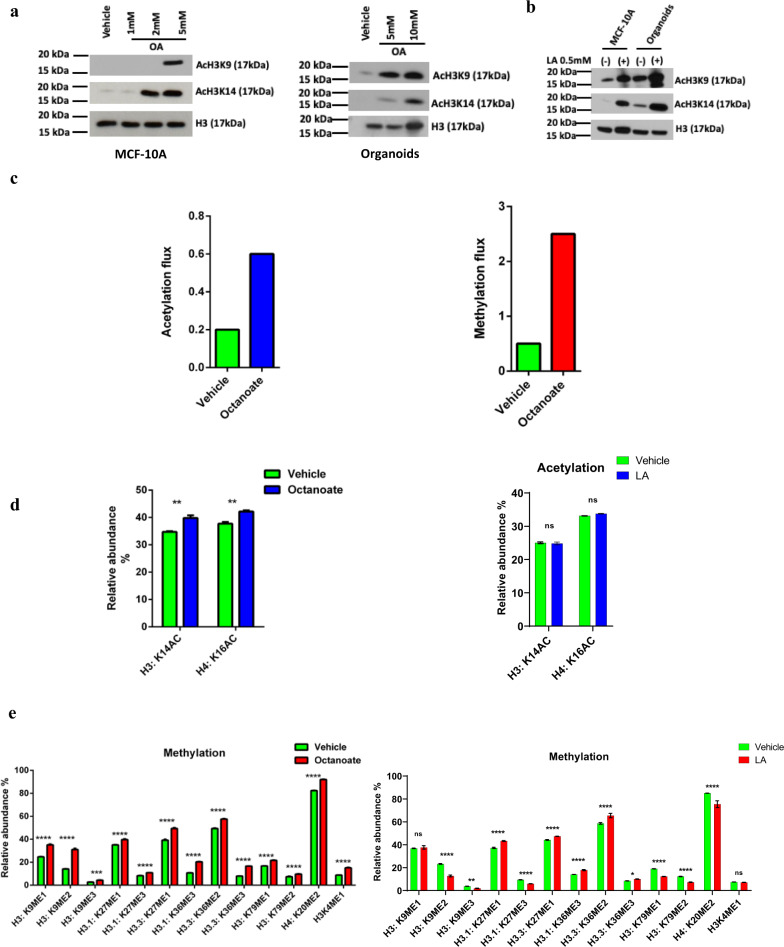
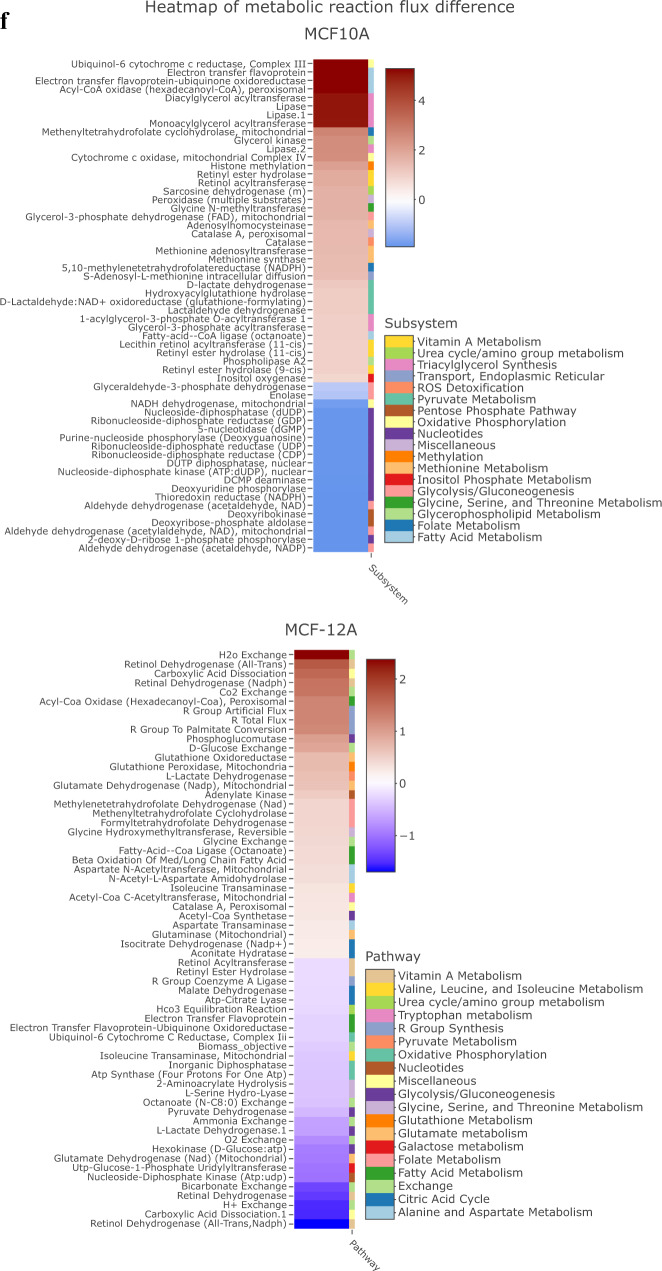
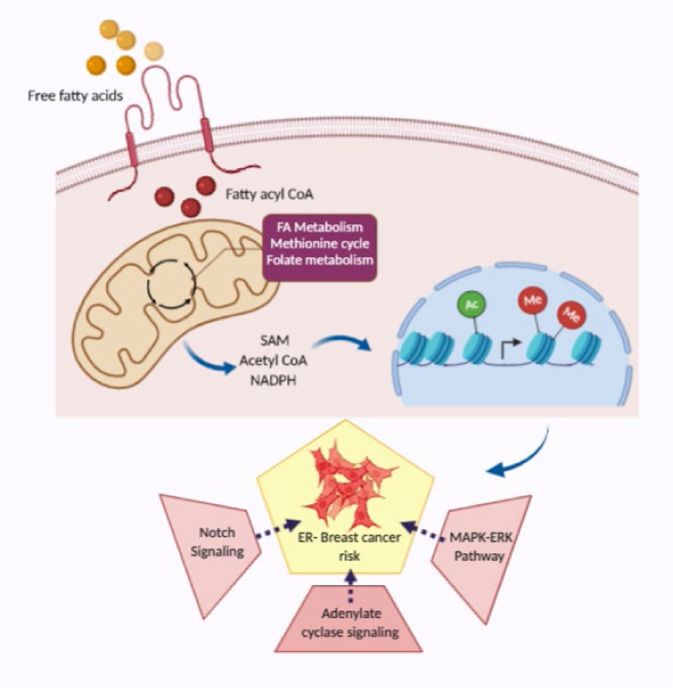
Improved understanding of local breast biology that favors the development of estrogen receptor negative (ER-) breast cancer (BC) would foster better prevention strategies. We have previously shown that overexpression of specific lipid metabolism genes is associated with the development of ER- BC. We now report results of exposure of MCF-10A and MCF-12A cells, and mammary organoids to representative medium- and long-chain polyunsaturated fatty acids. This exposure caused a dynamic and profound change in gene expression, accompanied by changes in chromatin packing density, chromatin accessibility, and histone posttranslational modifications (PTMs). We identified 38 metabolic reactions that showed significantly increased activity, including reactions related to one-carbon metabolism. Among these reactions are those that produce S-adenosyl-L-methionine for histone PTMs. Utilizing both an in-vitro model and samples from women at high risk for ER- BC, we show that lipid exposure engenders gene expression, signaling pathway activation, and histone marks associated with the development of ER- BC.


Conflict of interest statement

The authors declare no competing interests.

Figures

Fig. 1
Fig. 1. Lipid-rich environment enables transcriptional reprogramming in mammary epithelial cells.
a Twenty-four hour treatment of MCF-10A cells with 5 mM octanoate results in a completely distinct transcriptional profile compared to untreated controls. Ectrl is the expression of genes in the control condition across all 3 control replicates, Ectrl,avg is the average expression for the control condition across all genes and replicates, Eoct is the expression of genes across all 3 octanoate replicates. Ectrl/Ectrl,avg represents the ratio of expression of a particular gene to the average expression across all control cells. Thus, a positive value of lnEctrlEctrl,avg corresponds to genes that are highly expressed in the control conditions while a negative value of lnEctrlEctrl,avg corresponds to genes that have an initial lower expression in the control condition. Eoct/Ectrl represents the ratio of expression of a particular gene for octanoate-treated versus vehicle control-treated cells. Genes with initially low expression are upregulated while genes with initially high expression are downregulated upon octanoate treatment. b Gene ontology analysis of differentially expressed genes induced by octanoate treatment. Upregulated and downregulated genes were first identified using DESeq2 (FDR < 0.01, |logFC| > 1) for 5 mM octanoate treated cells compared to vehicle-treated control cells. Pathway enrichment analysis was performed on identified differentially expressed genes with annotations from online pathway databases (KEGG, Hallmark, Canonical Pathways, Reactome, BioCarta) and Gene Ontology Biological Processes. Pathway enrichment was ranked by p-value on a −Log10 scale and a selection from the top 25 pathways associated with upregulated genes (in red) and downregulated genes (in blue) are shown. c GSEA analysis of Gene Ontology Biological Processes showing top pathways associated with octanoate treatment with FDR < 0.1 related to differentiation, cell signaling, and metabolic processes. d List of core enrichment genes differentially expressed in treated replicates-T4, T5, T6 versus control replicates- C1, C2, C3: (I) Lipid storage pathways (II) Wnt pathway (III) Notch pathway (IV) ERBB pathway, each pathway as identified by GSEA leading edge analysis. Expression values are represented as colors and range from red (high expression) to dark blue (lowest expression). e Network analysis of pathways associated with the octanoate phenotype in GSEA analysis of Gene Ontology Biological Processes. f qPCR analysis of genes associated with the NOTCH pathway (mean ± s.d.). Two genes, NOTCH3 and DLL4 show remarkable upregulation upon 5 mM octanoate treatment compared to other identified genes such as NOTCH1. Statistical significance was determined by the unpaired t-test with Welch’s correction (**P < 0.01, *P < 0.05).
Fig. 2
Fig. 2. Linoleic acid alters large-scale chromatin packing behavior in MCF-10A cells.
a Representative PWS microscopy images of MCF-10A cell nuclei at 24 h after treatment with vehicle controls and lipids—octanoate and linoleic acid. Scale bars, 10 μm. Chromatin packing scaling (D) map of nuclei shows an increase in chromatin packing scaling upon lipid treatment as demonstrated by an increase in red regions. b Changes in average chromatin packing scaling among MCF-10A cells upon treatment with vehicle controls and lipids compared to untreated cells. Significance was determined using unpaired Kolmogorov–Smirnov t-test (****P < 0.0001, *P < 0.05). Bar graphs show the mean change in intranuclear D across cell populations for N = 88 cells PBS (vehicle for octanoate), N = 110 cells Octanoate (OA), N = 103 cells BSA (vehicle for linoleic acid), and N = 94 Linoleic acid (LA). c Enrichment of genomic locations for 1704 open chromatin regions (FDR < 0.05, logFC > 1) in LA treated MCF-10A cells. The enrichment of peaks in each type of genomic region relative to the whole genome is shown on the y-axis. Two ATAC-seq libraries were used for the analysis. d Pathway analysis for the regions with increased chromatin accessibility in linoleic acid-treated cells identified using the KEGG database. e Biplot showing changes in chromatin accessibility for specific regions identified by HOMER analysis. Motifs with a significant increase in the chromatin accessibility are shown in blue and those with a significant decrease in accessibility are shown in yellow (FDR < 0.05 and |logFC| > 1).
Fig. 3
Fig. 3. Notch pathway is overexpressed in CUB samples of patients at high risk of ER− disease.
Expression of genes from various pathways in matching CUBs from ER-negative, ER-positive patients, and controls. The log2-transformed relative (log2RE) amounts of mRNA expression normalized to the housekeeping gene and expressed as log22−(CtX−CtGAPDH) = −(CtX − Ct GAPDH) where Ct is threshold cycle and X is gene of interest. IGF2 and GPR161 were significantly higher in ER-negative versus control. Genes from the Notch pathway were significantly higher in ER negative CUBs in comparison to ER positive patients. Mann–Whitney test was used to test the pairwise differences between the samples (ER+, ER−, Control) * P < 0.05; ** P < 0.01. Boxplots show mean and SEM with whiskers indicating 1–99th percentile.
Fig. 4
Fig. 4. Increased DLL4/Notch signaling is associated with the stimulated fatty acid oxidation.
a qPCR data showing increase in lipid metabolism genes (green) and Notch pathway genes (red) after 24 h linoleate treatment in MCF-10A and mammary organoids (mean ± s.d.). Organoid I was donated by a postmenopausal 61-year-old with a BMI of 22 and Organoid II by a premenopausal 28-year-old with a BMI of 31. Statistical significance was determined by the unpaired t-test with Welch’s correction (****P < 0.0001, ***P < 0.001, **P < 0.01, *P < 0.05). b Chromatin accessibility in the lipid-treated cells around the transcription start site (TSS) of NOTCH1, HEY1, and DLL4 (FDR < 0.001). c Gene tracks and increase in peaks for the Notch genes in LA treated cells with the exact location on the chromosome. d Leading edge scores for genes of interest associated with the NOTCH signaling pathway as determined by GSEA leading edge analysis. DLL4, HEY1, HEY2, NOTCH3, and NOTCH4 were identified as core enrichment genes in the NOTCH pathway.
Fig. 5
Fig. 5. Effects of OA on Notch signaling.
NOTCH transcriptional activity was measured using the Cignal RBP-Jk reporter assay following exposure of MCF-10A cells to 5 mM octanoic acid (OA) for 24 h. Luciferase levels were normalized to Renilla luciferase. The results were plotted as fold change with respect to the untreated. (n = 3, mean ± SEM). The p-value was calculated by unpaired t-test.
Fig. 6
Fig. 6. Fatty acids drive histone modifications and metabolic flux.
Western blot of histone acetylation at H3 lysine K9 and K14 in MCF-10A cells and organoids treated with a octanoate and b linoleic acid. c The effect of octanoate treatment on histone acetylation and methylation flux in MCF-10A cells predicted using genome-scale metabolic modeling. Proteomic acetylation (d) and methylation (e) profiling measured by mass spectrometry of MCF-10A cells treated in triplicate with 5 mM octanoate for 24 h in a complete media compared to vehicle (left) and 0.5 mM linoleate for 24 h in complete media compared to vehicle (right) (mean ± s.d.). Two-way ANOVA was performed to determine the statistical significance and corrected for multiple comparisons using Sidak test (****P < 0.0001, ***P < 0.001, **P < 0.01, *P < 0.05, ns not significant). f Heatmap of reaction flux differences predicted by metabolic modeling to be differentially active (p-value < 0.01) between control and treatment (increased flux in red, decreased flux in blue). The corresponding pathways (subsystem) that each reaction belongs to is listed in the legend.
Fig. 7
Fig. 7. Proposed model illustrating the orchestration of lipid-induced molecular changes.
Sensors: Senses the fatty acid-rich environment and perturb cellular metabolism providing the essential substrate for histone modifications and thereby turning on the Mediators- histone PTMs, which consequently activates the Effectors- Notch, adenylate cyclase, and MAPK-ERK the key protein signaling associated with ER− breast cancer.

Similar articles

Cited by

References

    1. Weigelt B, Reis-Filho JS. Histological and molecular types of breast cancer: Is there a unifying taxonomy? Nat. Rev. Clin. Oncol. 2009;6:718–730. doi: 10.1038/nrclinonc.2009.166. - DOI - PubMed
    1. Gail MH, et al. Projecting individualized probabilities of developing breast cancer for white females who are being examined annually. J. Natl Cancer Inst. 1989;81:1879–1886. doi: 10.1093/jnci/81.24.1879. - DOI - PubMed
    1. Fisher B, et al. Tamoxifen for prevention of breast cancer: report of the National Surgical Adjuvant Breast and Bowel Project P-1 Study. J. Natl Cancer Inst. 1998;90:1371–1388. doi: 10.1093/jnci/90.18.1371. - DOI - PubMed
    1. Cuzick J, et al. Long-term results of tamoxifen prophylaxis for breast cancer–96-month follow-up of the randomized IBIS-I trial. J. Natl Cancer Inst. 2007;99:272–282. doi: 10.1093/jnci/djk049. - DOI - PubMed
    1. Cuzick J, et al. Use of anastrozole for breast cancer prevention (IBIS-II): Long-term results of a randomised controlled trial. Lancet. 2020;395:117–122. doi: 10.1016/S0140-6736(19)32955-1. - DOI - PMC - PubMed