. 2022 Jun;32(6):513-529.
doi: 10.1038/s41422-022-00668-0. Epub 2022 May 4.

Derivation of totipotent-like stem cells with blastocyst-like structure forming potential

Affiliations

Derivation of totipotent-like stem cells with blastocyst-like structure forming potential

Yaxing Xu et al. Cell Res. 2022 Jun.

Abstract

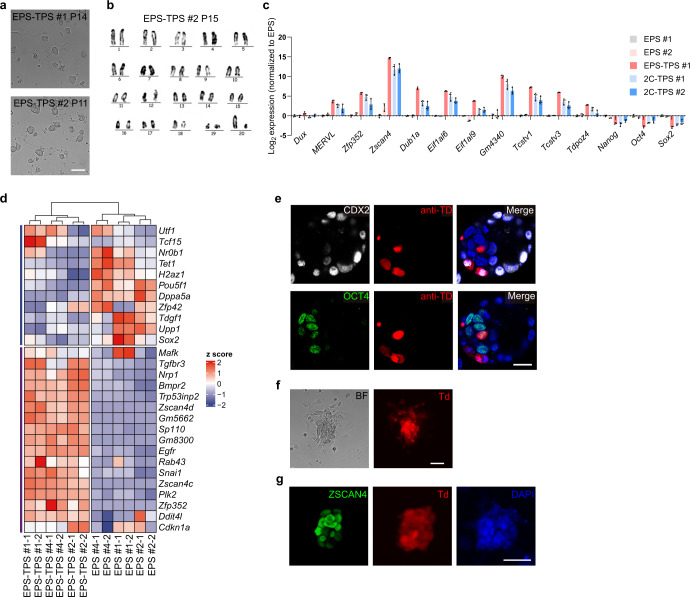
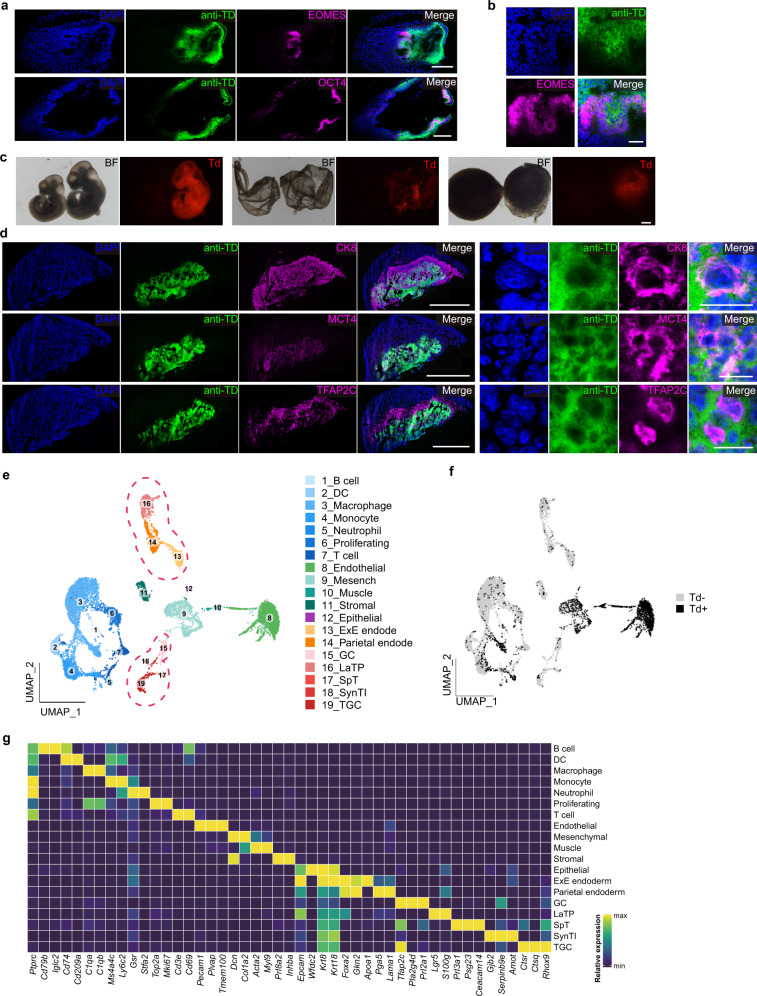
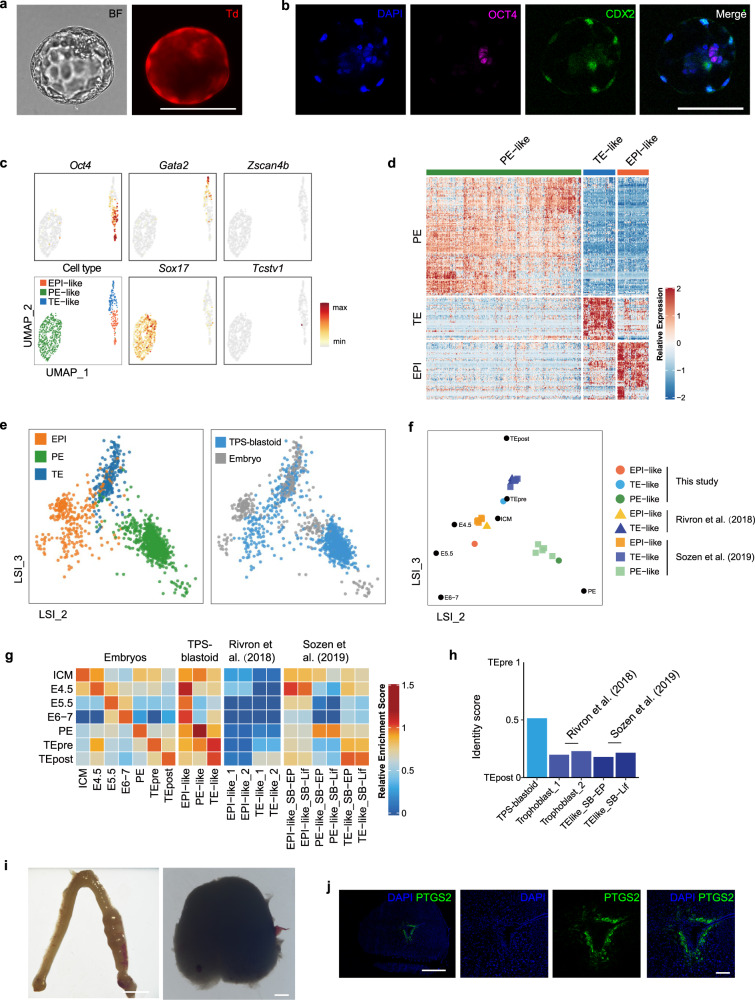
It is challenging to derive totipotent stem cells in vitro that functionally and molecularly resemble cells from totipotent embryos. Here, we report that a chemical cocktail enables the derivation of totipotent-like stem cells, designated as totipotent potential stem (TPS) cells, from 2-cell mouse embryos and extended pluripotent stem cells, and that these TPS cells can be stably maintained long term in vitro. TPS cells shared features with 2-cell mouse embryos in terms of totipotency markers, transcriptome, chromatin accessibility and DNA methylation patterns. In vivo chimera formation assays show that these cells have embryonic and extraembryonic developmental potentials at the single-cell level. Moreover, TPS cells can be induced into blastocyst-like structures resembling preimplantation mouse blastocysts. Mechanistically, inhibition of HDAC1/2 and DOT1L activity and activation of RARγ signaling are important for inducing and maintaining totipotent features of TPS cells. Our study opens up a new path toward fully capturing totipotent stem cells in vitro.


Conflict of interest statement

The authors declare no competing interests.

Figures

Fig. 1
Fig. 1. Identification of a chemical cocktail that induce totipotent stem-like cells in vitro.
a Representative images showing induction of TPS cells from EPS cells under the CPEC condition. Scale bar, 100 μm. Similar images were obtained in at least 5 independent experiments. b Karyotype analysis of TPS cells after long-term culturing under the CPEC condition. Similar images were obtained in 3 independent experiments. c qPCR analysis of expression of totipotency and pluripotency marker genes in TPS cells converted from EPS cells (EPS-TPS #1) and TPS cells derived from 2-cell embryos (2C-TPS #1 and #2). n = 3 biological replicates. Similar results were obtained in at least 2 independent experiments. Relative expressions were normalized to EPS #1. d Heatmap showing the relative expression of representative totipotency and pluripotency genes in TPS and EPS cells. e Representative immunofluorescent analysis showing expression of trophectoderm (CDX2) and epiblast (OCT4) markers in TPS derivatives in the chimeric blastocysts. These images showed different focal planes of the same embryo. Scale bar, 20 μm. anti-TD, immuno-staining of tdTomato protein. Similar images were obtained in at least 2 independent experiments. f Representative morphology of CPEC-treated outgrowth derived from 2-cell embryos expressing tdTomato. Scale bar, 100 μm. BF, bright field. Td, tdTomato. Similar images were obtained in at least 2 independent experiments. g Representative immunofluorescent analysis of ZSCAN4 expression in TPS cells derived from 2-cell embryos expressing tdTomato. Scale bar, 50 μm. Td, endogenous tdTomato. Similar images were obtained in at least 2 independent experiments.
Fig. 2
Fig. 2. TPS cells share transcriptomic and epigenetic features with 2-cell blastomere.
a UMAP plot showing the expression of representative totipotency marker genes in TPS, ES and EPS cells at the single-cell level. Different cell types are indicated using different colors. b Latent semantic indexing (LSI) analysis comparing developmental progression from zygote to postimplantation (E5.25–E7.5) epiblast with TPS cells, ES cells, EPS cells, TBLCs and spontaneous 2C-like cells. 2C-TPS-sub, TPS 2C-subpopulation; TBLC-sup, subpopulation from TBLCs; 2CLC, spontaneous 2C-like cells. The detailed method for constructing the mouse embryonic development trajectory is provided in Materials and methods section. Sequencing data of different stem cell types are from GSE33923, GSE168728, GSE74155, and GSE145609. c Quadratic programming-based deconvolution analysis showing the transcriptomic similarity between 2-cell embryo and different in vitro cell types. Embryonic cells from different developmental stages are included as controls. EPS-TPS-sub, TPS 2C-subpopulation from EPS-TPS cells; 2C-TPS-sub, TPS 2C-subpopulation from 2C-TPS cells; TBLC-sup, subpopulation from TBLCs; 2CLC, spontaneous 2C-like cells. d ssGSEA analysis showing the similarities between embryonic cells from different developmental stages and in vitro cell types. EPS-TPS-sub, TPS 2C-subpopulation from EPS-TPS cells; 2C-TPS-sub, TPS 2C-subpopulation from 2C-TPS cells; TBLC-sup, subpopulation from TBLCs; 2CLC, spontaneous 2C-like cells. e Comparison of regulon activities between TPS 2C-subpopulation (TPS-sub) and EPS cells. Regulons that are enriched in TPS 2C-subpopulation and EPS cells are highlighted. f Analysis of regulon activities at different developmental stages. The activities of top 20 regulons that are upregulated and downregulated in TPS 2C-subpopulation (TPS-sub) are quantified. g Identification of open and closed peaks that are enriched in TPS cells. ES and EPS cells were used for comparison. Orange color (high) indicates TPS-enriched open peaks, and blue color (low) indicates TPS-enriched closed peaks. h Average signal intensities of TPS-enriched open and closed peaks in TPS, ES, EPS cells and 2-cell embryos. Orange color indicates TPS-enriched open peaks, and blue color indicates TPS-enriched closed peaks. “ES: this study” indicates sequencing data of ES cell samples that were collected and sequenced in this study. “ES: public” indicates sequencing data of ES cells from public resources. i Comparison of global DNA CpG methylation levels in TPS, ES, EPS cells and embryonic cells from different developmental stages (2-cell, 4-cell, E6.5 and E7.5 embryos, E3.5 inner cell mass (ICM)).
Fig. 3
Fig. 3. TPS cells can generate both embryonic and extraembryonic lineages in vivo.
a Representative immunofluorescent analysis of expression of embryonic (OCT4) and extraembryonic ectoderm (EOMES) markers in chimeric derivative cells from single TPS cells in E7.5 conceptuses. The stained sections were from the same analyzed conceptus. Scale bars, 200 μm. anti-TD, immuno-staining of tdTomato protein. Similar images were obtained in at least 3 independent experiments. b Enlarged images showing contribution of single TPS derivatives in the extraembryonic ectoderm region. Scale bar, 50 μm. anti-TD, immuno-staining of tdTomato protein. c Representative images showing contribution of single TPS derivative cells in E10.5 embryo, yolk sac and placenta. Scale bar, 500 μm. Td, endogenous tdTomato. BF, bright field. Similar images were obtained in at least 3 independent experiments. d Representative immunofluorescent analysis of E10.5 chimeric placenta generated by injection of single TPS cells (tdTomato labeled). 2-cell embryo-derived TPS cells were used. The left panels show the original images and the right panels show the enlarged images. anti-TD, immuno-staining of tdTomato protein. Scale bars, 2 mm (left panels) and 20 μm (right panels). Similar images were obtained in at least 3 independent experiments. e UMAP plot showing the 19 main clusters in E17.5 chimeric placenta. Pink dotted line indicates extraembryonic cell lineages. f UMAP plot showing tdTomato expression in E17.5 chimeric placenta. Td+, tdTomato-positive cells. Td–, tdTomato-negative cells. g Heatmap showing the average expression of specific marker genes for each cluster from f.
Fig. 4
Fig. 4. Induction of blastocyst-like structures from TPS cells in vitro.
a Representative morphology of blastoids induced from TPS cells. Scale bar, 100 μm. BF, bright field. Td, endogenous tdTomato. Similar images were obtained in at least 3 independent experiments. b Representative immunofluorescent analysis of trophectoderm (CDX2) and epiblast (OCT4) marker genes in TPS-blastoids. Scale bars, 100 μm. Similar images were obtained in at least 3 independent experiments. c UMAP plot showing the expression of representative marker genes for epiblast, trophectoderm, primitive endoderm, and totipotency in TPS-blastoid cells at the single-cell level. EPI-like, epiblast-like cells; PE-like, primitive endoderm-like cells; TE-like, trophectoderm-like cells. d Heatmap showing expression of 262 representative marker genes for epiblast, primitive endoderm and trophectoderm in TPS-blastoid cells. EPI-like, epiblast-like cells; PE-like, primitive endoderm-like cells; TE-like, trophectoderm-like cells. e LSI analysis comparing cells from E4.5 blastocysts and TPS-blastoids. Left panel shows cell lineage assignments, and right panel shows plots for blastocyst and TPS-blastoids. EPI, epiblast; PE, primitive endoderm; TE, trophectoderm. f LSI analysis comparing embryonic cells from different developmental stages with blastoid cells from different studies. The single-cell RNA-seq data of blastoid cells from this study, Rivron et al. and Sozen et al. were analyzed. ICM, E3.5 inner cell mass; E4.5, E4.5 epiblast; E5.5, E5.5 epiblast; E6–7, E6–7 epiblast; PE, primitive endoderm (E4.5–E7.5); TEpre, trophectoderm from E3.5–E4.5 blastocysts; TEpost, E5.25–E6.5 extraembryonic ectoderm; EPI-like, epiblast-like cells; PE-like, primitive endoderm-like cells; TE-like, trophectoderm-like cells. g ssGSEA analysis showing the similarities between embryonic cells from different developmental stages and blastoid cells from different studies. The single-cell RNA-seq data of blastoid cells from this study, Rivron et al. and Sozen et al. were analyzed. SB-EP indicates cells from EPS/TS-blastoids. SB-Lif indicates cells from ES/TS-blastoids. h Quadratic programming-based deconvolution analysis showing the transcriptomic similarity between preimplantation trophectoderm and trophectoderm-like cells from different studies. i Representative images showing the formation of decidua in the mouse uterus 4 days after TPS-derived blastoids were transferred at 2.5 dpc. Scale bars, 5 mm (left image) and 500 μm (right image). Similar images were obtained in at least 3 independent experiments. j Representative immunofluorescent analysis of PTGS2 expression in TPS-derived decidua. Scale bars, 500 μm (left) and 100 μm (right). Similar images were obtained in at least 2 independent experiments.
Fig. 5
Fig. 5. Mechanistic exploration of totipotency induction and maintenance in TPS cells.
a Western blot analysis showing the levels of histone H3 and H4 acetylation and H3K79me2 of EPS and TPS cells. Similar results were obtained in at least 2 independent experiments. b qPCR analysis of expression levels of classical RAR downstream target genes in EPS and TPS cells. n = 3 biological replicates. c qPCR analysis of expression levels of representative totipotency marker genes on day 3 upon treatment of different small molecule combinations. In the CPEC condition, EPZ004777, VPA, CD1530 and CHIR 99021 were replaced by small molecules targeting DOT1L, HDAC, RA signaling and GSK3β, respectively. n = 2 technical replicates. Similar results were obtained in at least 2 independent experiments. EPS, EPS cells; Basal, EPS cells cultured in the basal medium of CPEC condition. EPZ rep, VPA rep, CD1530 rep and CHIR rep indicate small molecules that target DOT1L, HDAC, RA and GSK3β, respectively. d qPCR analysis of Hdac1 and Hdac2 expression in EPS cells after shRNA knockdown of Hdac1/2. shHdac, Hdac1/2 shRNA. n = 2 biological replicates. e qPCR analysis of expression levels of representative totipotency marker genes on day 3 after knocking down Hdac1/2 in EPS cells during TPS cell induction. EPS, EPS cells; CPEC-V + shHdac, replacement of VPA with Hdac1/2 knockdown. n = 2 biological replicates. f qPCR analysis of Dot1l expression in EPS cells after shRNA knockdown of Dot1l. shDot1l, Dot1l shRNA. n = 3 biological replicates. g qPCR analysis of expression levels of representative totipotency marker genes on day 3 after knocking down Dot1l in EPS cells during TPS cell induction. EPS, EPS cells; CPEC-E + shDot, replacement of EPZ004777 with Dot1l knockdown. n = 3 biological replicates. h qPCR analysis of the effect of inhibiting RAR signaling on totipotency induction (left panel) and maintenance (right panel) in TPS cells. Expression of representative totipotency marker genes were analyzed. RARγi, LY2955303; RARα/βi, LE135; RXRi, UVI3003. n = 3 biological replicates. i qPCR analysis of the effect of CPEC chemical cocktail on totipotency maintenance in early preimplantation embryos. Small molecules were added from the 2-cell embryo stage for 2 days. DMSO was used as a negative control. 2C, 2-cell embryo. n = 2 biological replicates. j qPCR analysis of the effect of Dux knockdown on maintaining totipotency in TPS cells. Expression of representative totipotency marker genes were analyzed. Dux KD, dux knockdown. n = 2 biological replicates. k qPCR analysis of the effect of Dux knockdown on inducing totipotency from EPS cells. Expression of representative totipotency marker genes were analyzed. Dux KD, dux knockdown. n = 2 biological replicates. l qPCR analysis of the effect of p53 knockdown on inducing totipotency from EPS cells. Expression of representative totipotency marker genes were analyzed. p53 KD, p53 knockdown. n = 2 biological replicates.

Comment in

  • Towards capturing of totipotency.
    Zhong C, Li R, Izpisua Belmonte JC. Zhong C, et al. Cell Res. 2022 Aug;32(8):705-706. doi: 10.1038/s41422-022-00686-y. Cell Res. 2022. PMID: 35790810 Free PMC article. No abstract available.

References

    1. Papaioannou VE, Mkandawire J, Biggers JD. Development and phenotypic variability of genetically identical half mouse embryos. Development. 1989;106:817–827. doi: 10.1242/dev.106.4.817. - DOI - PubMed
    1. Tarkowski AK. Experiments on the development of isolated blastomers of mouse eggs. Nature. 1959;184:1286–1287. doi: 10.1038/1841286a0. - DOI - PubMed
    1. Rossant J, Tam PPL. Blastocyst lineage formation, early embryonic asymmetries and axis patterning in the mouse. Development. 2009;136:701–713. doi: 10.1242/dev.017178. - DOI - PubMed
    1. Cockburn K, Rossant J. Making the blastocyst: lessons from the mouse. J. Clin. Invest. 2010;120:995–1003. doi: 10.1172/JCI41229. - DOI - PMC - PubMed
    1. Frankenberg SR, de Barros FRO, Rossant J, Renfree MB. The mammalian blastocyst. Wiley Interdiscip. Rev. Dev. Biol. 2016;5:210–232. doi: 10.1002/wdev.220. - DOI - PubMed

Publication types