. 2022 May 4;13(1):2456.
doi: 10.1038/s41467-022-30146-5.

Unveiling hidden energy poverty using the energy equity gap

Affiliations

Unveiling hidden energy poverty using the energy equity gap

Shuchen Cong et al. Nat Commun. .

Abstract

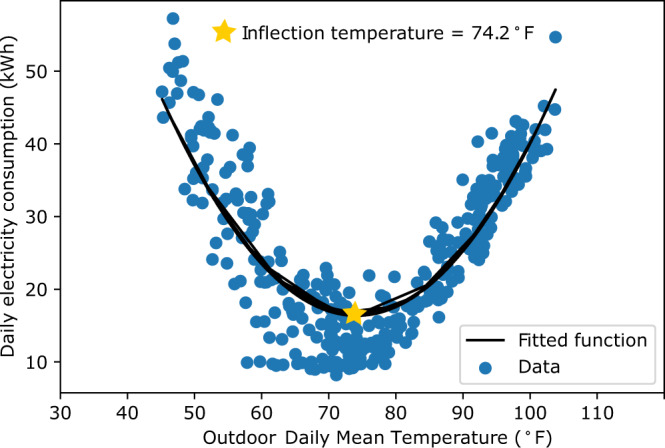
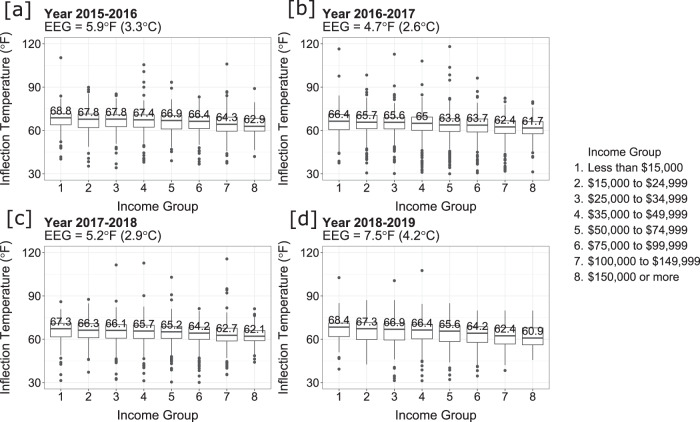
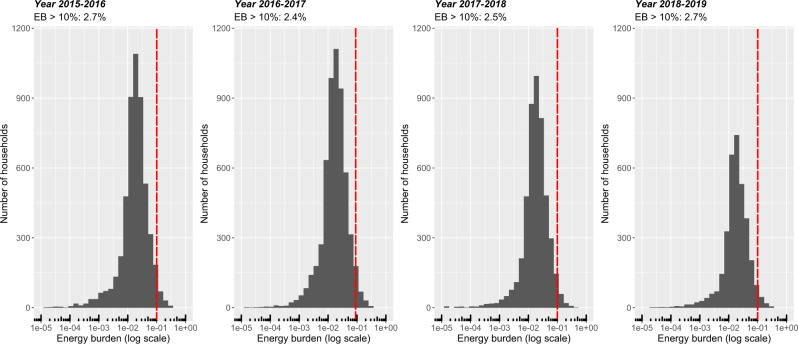
Income-based energy poverty metrics ignore people's behavior patterns, particularly reducing energy consumption to limit financial stress. We investigate energy-limiting behavior in low-income households using a residential electricity consumption dataset. We first determine the outdoor temperature at which households start using cooling systems, the inflection temperature. Our relative energy poverty metric, the energy equity gap, is defined as the difference in the inflection temperatures between low and high-income groups. In our study region, we estimate the energy equity gap to be between 4.7-7.5 °F (2.6-4.2 °C). Within a sample of 4577 households, we found 86 energy-poor and 214 energy-insecure households. In contrast, the income-based energy poverty metric, energy burden (10% threshold), identified 141 households as energy-insecure. Only three households overlap between our energy equity gap and the income-based measure. Thus, the energy equity gap reveals a hidden but complementary aspect of energy poverty and insecurity.


Conflict of interest statement

The authors declare no competing interests.

Figures

Fig. 1
Fig. 1. Categories of energy poverty metrics.
The X-axis represents relative or absolute metrics, or whether the metric has a distinct threshold for energy poverty. The Y-axis represents primary or secondary metrics, or whether a metric requires more than basic consumer-level data to calculate. A primary-absolute metric can be energy burden, or percent of income spent on energy bills; a primary-relative metric can be self-reported energy poverty indicators; a secondary-absolute metric can be a combination of the previous two, where an arbitrary score is calculated based on energy burden and survey results; and a secondary-relative metric can be an energy access-consumption matrix, often used to portray the progress of energy access in developing countries. The energy equity gap is a primary metric that can be both relative and absolute, where it can tell us the relative energy equity progress of a region, as well as household-level energy poverty.
Fig. 2
Fig. 2. Identifying the inflection temperature for daily electricity consumption and local daily mean outdoor temperature.
This graph represents the daily electricity consumption of one household for one year (N = 365). The star marks the inflection temperature for this household for this year. We note that our true temperature response function includes electricity price, weekend, holiday, day of the week, and month of the year effects. The inflection temperature is the minimum of the quadratic temperature response function between the residuals after controlling for these factors and outdoor temperature.
Fig. 3
Fig. 3. The distribution of inflection temperature across income groups.
The energy equity gap (EEG) for each year is calculated as the difference between the highest and lowest median inflection temperature (indicated by the middle bar and number) among all income groups in all four panels, income group 1 had the highest, and income group 8 had the lowest median inflection temperature. The energy equity gap (EEG) is shown at the top of each panel. (a) 2015–2016 N = 4577 households, (b) 2016–2017 N = 4522 households, (c) 2017–2018 N = 3852 households, (d) 2018–2019 N = 2650 households. Each box and whiskers plot indicates the minima and maxima of inflection temperatures of one income group for one year (the lower and upper bound of the whiskers), the first and third quantiles (the lower and upper bound of the box), and the median (the middle line). The outliers are shown as dots on either side of the whiskers. Source data can be found in our code repository.
Fig. 4
Fig. 4. Energy equity gap (EEG) and median inflection temperature changes across study years.
Each line represents one income group. Each data point represents the median inflection temperature of the income group for that year.
Fig. 5
Fig. 5. Inter- and intra-group comparison of the inflection temperature and energy equity gap for ethnicity and age groups.
Median inflection temperatures by (a) ethnicity and (c) age group show disparities across demographics. The energy equity gap highlights energy consumption behavior differences between high and low-income populations within their respective (b) ethnicity and (d) age groups. See Supplementary Information Notes 3 and 4 for more details.
Fig. 6
Fig. 6. Tier systems for energy poverty and insecurity identification using the energy equity gap.
The darker the shade the more severe the level of energy poverty experienced by a household is.
Fig. 7
Fig. 7. Energy insecurity measured using the energy burden (EB) metric.
The x-axis represents the percent of income a household spends on electricity. The red dotted line indicates the 10% income spending threshold, and EB10 details the proportion of households above the energy spending threshold. For example, in 2015–2016, 2.7% of households in our sample spent more than 10% of their income on electricity. The maximum amount of spending in our sample population is 35%.

References

    1. Sovacool BK. Fuel poverty, affordability, and energy justice in England: Policy insights from the Warm Front Program. Energy. 2015;93:361–371. doi: 10.1016/j.energy.2015.09.016. - DOI
    1. Primc K, Slabe-Erker R, Majcen B. Constructing energy poverty profiles for an effective energy policy. Energy Policy. 2019;128:727–734. doi: 10.1016/j.enpol.2019.01.059. - DOI
    1. Climate Change Impacts in the United States: The Third National Climate Assessment. https://nca2014.globalchange.gov/downloads10.7930/J0Z31WJ2 (2014).
    1. Wu, X., Brady, J. E., Rosenberg, H. & Li, G. Emergency department visits for heat stroke in the United States, 2009 and 2010. Injury Epidemiol.1, 8 (2014). - PMC - PubMed
    1. Heat wave: a social autopsy of disaster in Chicago, Klinenberg. https://press.uchicago.edu/ucp/books/book/chicago/H/bo20809880.html (2015). - PubMed

Publication types