. 2022 May 4;12(1):7214.
doi: 10.1038/s41598-022-10706-x.

North Asian population relationships in a global context

Affiliations

North Asian population relationships in a global context

Kenneth K Kidd et al. Sci Rep. .

Abstract

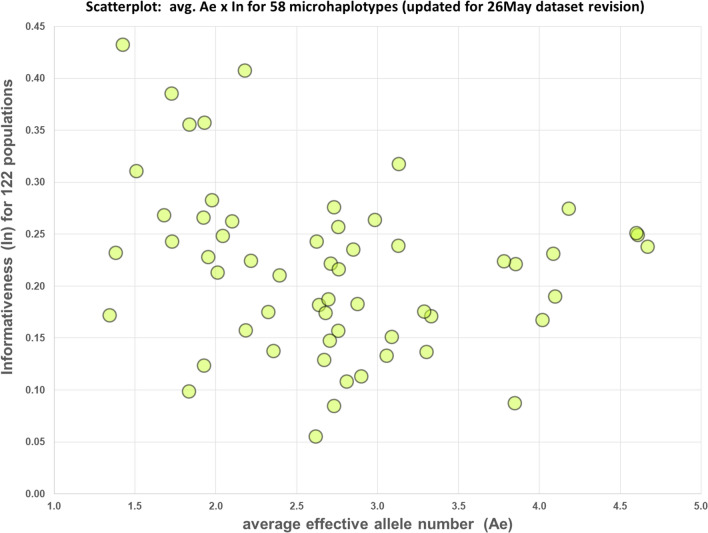
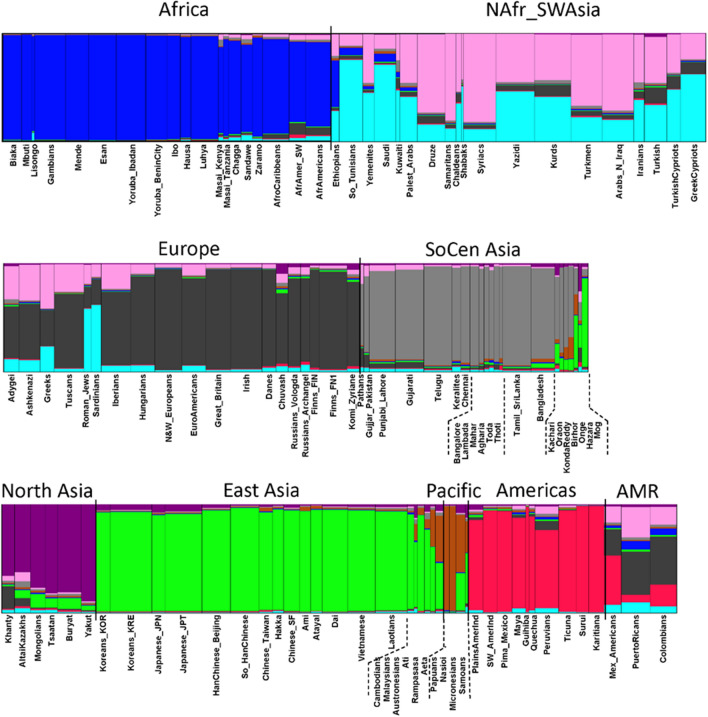
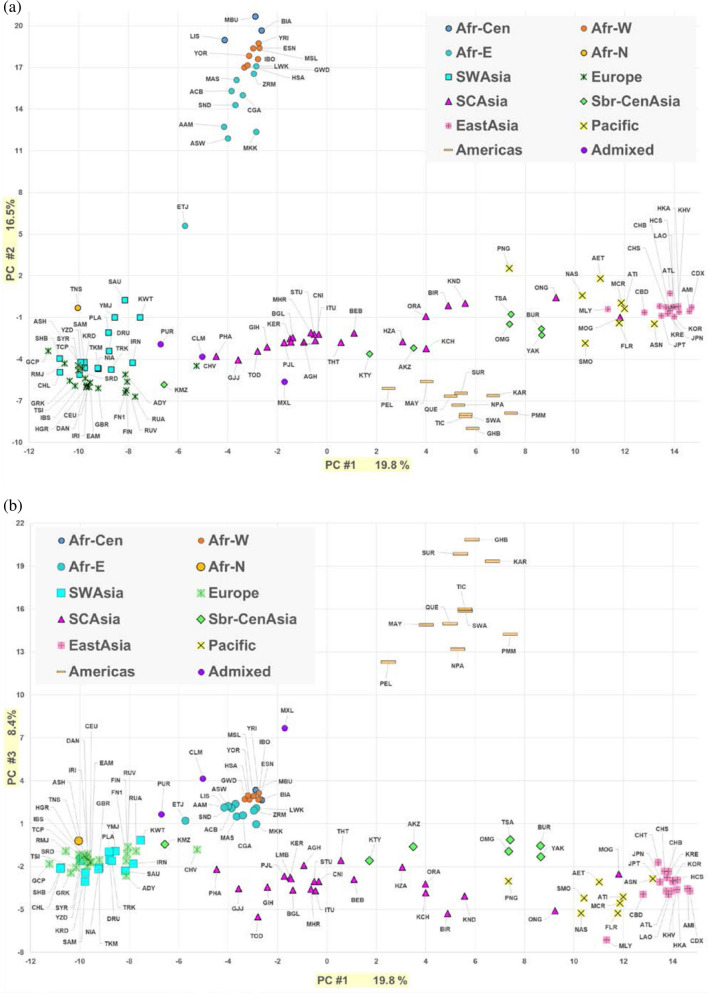
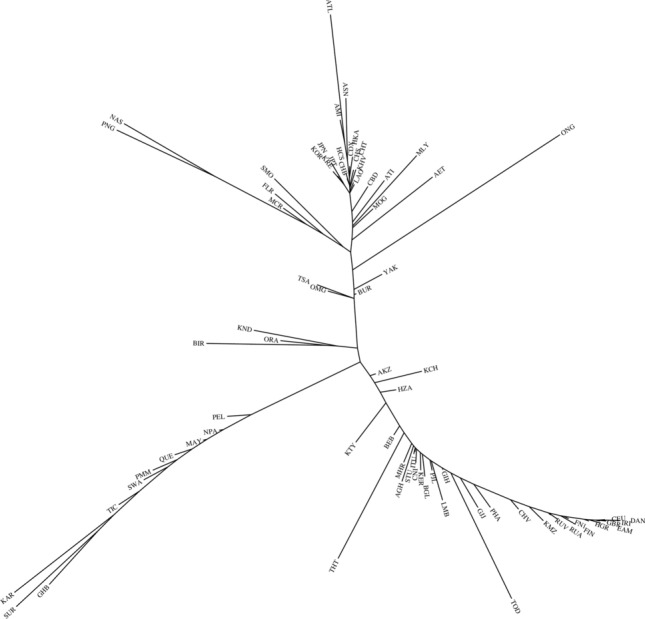
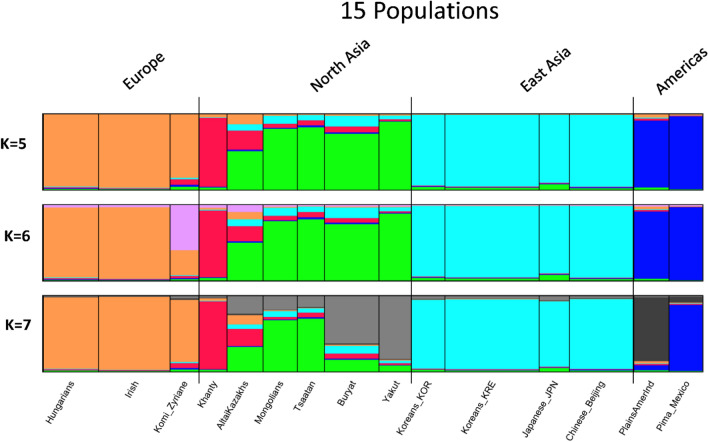
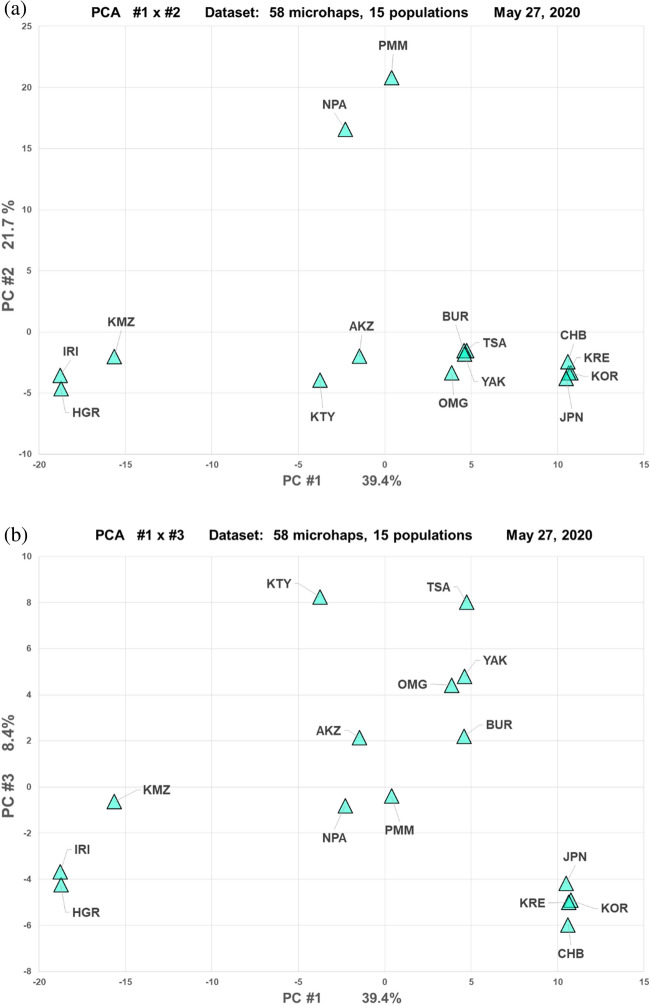
Population genetic studies of North Asian ethnic groups have focused on genetic variation of sex chromosomes and mitochondria. Studies of the extensive variation available from autosomal variation have appeared infrequently. We focus on relationships among population samples using new North Asia microhaplotype data. We combined genotypes from our laboratory on 58 microhaplotypes, distributed across 18 autosomes, on 3945 individuals from 75 populations with corresponding data extracted for 26 populations from the Thousand Genomes consortium and for 22 populations from the GenomeAsia 100 K project. A total of 7107 individuals in 122 total populations are analyzed using STRUCTURE, Principal Component Analysis, and phylogenetic tree analyses. North Asia populations sampled in Mongolia include: Buryats, Mongolians, Altai Kazakhs, and Tsaatans. Available Siberians include samples of Yakut, Khanty, and Komi Zyriane. Analyses of all 122 populations confirm many known relationships and show that most populations from North Asia form a cluster distinct from all other groups. Refinement of analyses on smaller subsets of populations reinforces the distinctiveness of North Asia and shows that the North Asia cluster identifies a region that is ancestral to Native Americans.


Conflict of interest statement

The authors declare no competing interests.

Figures

Figure 1
Figure 1
Scatterplot of Ae by In for 58 microhaps evaluated on 122 populations. See text.
Figure 2
Figure 2
STRUCTURE results by population averages for 122 populations at K = 9. The result with the highest likelihood is shown as population averages. AMR indicates the American populations from the 1000 Genomes dataset that have very low Native American ancestry and have predominantly European and some West African ancestry. The plots for K = 7 through 9 are shown in Supplemental Fig. S2; plots of likelihoods for K values are in Supplemental Fig. S5.
Figure 3
Figure 3
PCA results for 122 populations. (a) PC1 by PC2. (b) PC1 by PC3.
Figure 4
Figure 4
STRUCTURE results by population averages for 74 populations at K = 7 through K = 9. At each K value the result with the highest likelihood is shown as population average. This subset of the 122 populations is in the same order as in Table 2. The plots of individuals for these three K values are shown in Supplemental Fig. S4; plots of likelihoods for K values are in Supplemental Fig. S6. In the lower part of the figure, individual bar plots are shown for East Asia with the individuals sorted by the major cluster values within each population.
Figure 5
Figure 5
PCA results for 74 populations. (a) PC1 by PC2. (b) PC1 by PC3.
Figure 6
Figure 6
Best exact Least Squares tree for 74 populations. This best of 445 different trees examined has no internal negative segments but does have eight external negative segments to the CHV, FIN1, GIH, PJL, BEB, PEL, BUR, and JPT populations. In their local positions in the graph the segments are small in absolute value and are indicative of small deviations from true additivity in their pairwise genetic distances. They generally are located in reasonable locations with respect to what is known about their relationships. For example, the FIN1 sample from 1 KG clusters with the independent FIN sample from Kidd Lab.
Figure 7
Figure 7
STRUCTURE results by population averages for 15 populations at K = 5 through K = 7. At each K value the result with the highest likelihood is shown as population averages. The plots of individuals for these three K values are shown in Supplemental Fig. S6; plots of likelihoods for K values are in Supplemental Fig. S8.
Figure 8
Figure 8
PCA results for 15 populations. (a) PC1 by PC2. (b) PC1 by PC3.
Figure 9
Figure 9
Best exact Least Squares tree for 15 populations. Negative branches to the Buryat, Altai Kazakhs, and Khanty are orange.

References

    1. Kidd KK, et al. Microhaplotype loci are a powerful new type of forensic marker. Forensic Sci. Int. Genet. Suppl. Ser. 2013;4:e123–e124. doi: 10.1016/j.fsigss.2013.10.063. - DOI
    1. Kidd KK, et al. Current sequencing technology makes microhaplotypes a powerful new type of genetic marker for forensics. Forensic Sci. Int. Genet. 2014;12:215–224. doi: 10.1016/j.fsigen.2014.06.014. - DOI - PubMed
    1. Oldoni F, Kidd KK, Podini D. Microhaplotypes in forensic genetics. Forensic Sci. Int. Genet. 2019;38:54–69. doi: 10.1016/j.fsigen.2018.09.009. - DOI - PubMed
    1. Zhu J, et al. Evaluation of the microhaplotype markers in kinship analysis. Electrophoresis. 2019;40:1091–1095. doi: 10.1002/elps.201800351. - DOI - PubMed
    1. Staadig A, Tillmar A. Evaluation of microhaplotypes in forensic kinship analysis from a Swedish population perspective. Int. J. Legal Med. 2021;135:1151–1160. doi: 10.1007/s00414-021-02509-y. - DOI - PMC - PubMed

Publication types