. 2022 May 4;13(1):2454.
doi: 10.1038/s41467-022-30102-3.

Liver-directed lentiviral gene therapy corrects hemophilia A mice and achieves normal-range factor VIII activity in non-human primates

Affiliations

Liver-directed lentiviral gene therapy corrects hemophilia A mice and achieves normal-range factor VIII activity in non-human primates

Michela Milani et al. Nat Commun. .

Abstract

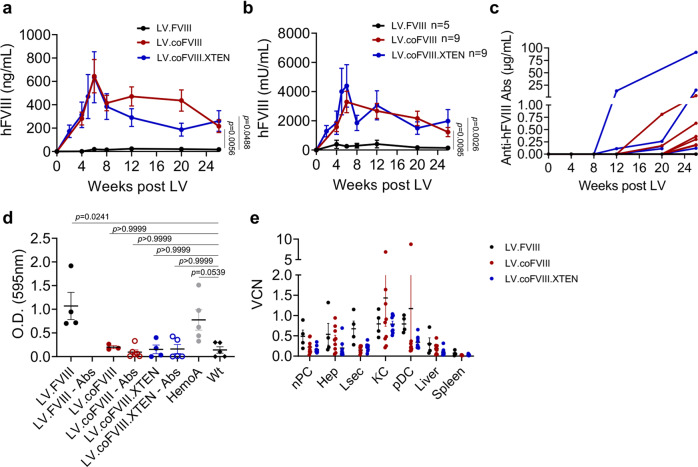
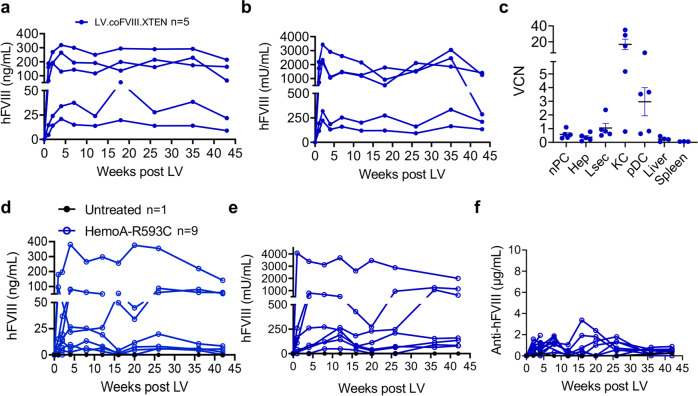
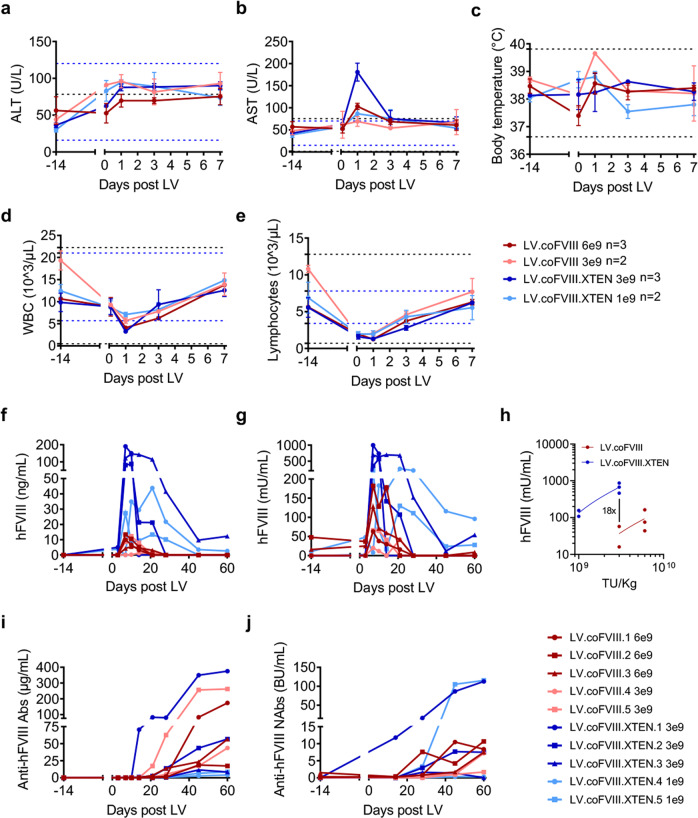
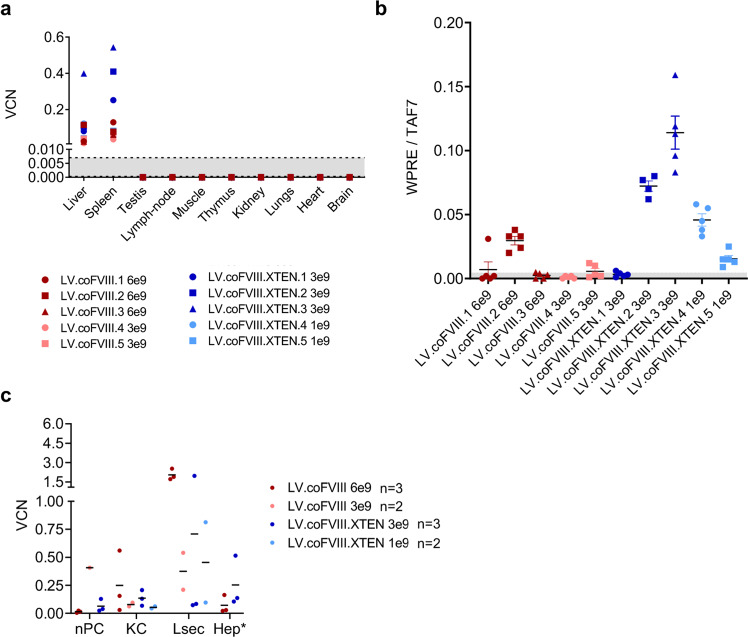
Liver gene therapy with adeno-associated viral (AAV) vectors delivering clotting factor transgenes into hepatocytes has shown multiyear therapeutic benefit in adults with hemophilia. However, the mostly episomal nature of AAV vectors challenges their application to young pediatric patients. We developed lentiviral vectors, which integrate in the host cell genome, that achieve efficient liver gene transfer in mice, dogs and non-human primates, by intravenous delivery. Here we first compare engineered coagulation factor VIII transgenes and show that codon-usage optimization improved expression 10-20-fold in hemophilia A mice and that inclusion of an unstructured XTEN peptide, known to increase the half-life of the payload protein, provided an additional >10-fold increase in overall factor VIII output in mice and non-human primates. Stable nearly life-long normal and above-normal factor VIII activity was achieved in hemophilia A mouse models. Overall, we show long-term factor VIII activity and restoration of hemostasis, by lentiviral gene therapy to hemophilia A mice and normal-range factor VIII activity in non-human primate, paving the way for potential clinical application.


Conflict of interest statement

L.N., A.C., A.A., M.M., T.L., S.P.W. are inventors on patent applications submitted by Foundation Telethon and San Raffaele Scientific Institute or Bioverativ/Sanofi on LV technology related to the work presented in this manuscript (WO2019/152692; WO2016009326). FT and SRSI, through SR-Tiget, have established a research collaboration on liver-directed lentiviral gene therapy of hemophilia with Bioverativ/Sanofi. The remaining authors declare no competing interests.

Figures

Fig. 1
Fig. 1. FVIII transgene selection in hemophilia A mice.
a, b Mean with standard error of the mean (SEM) of human FVIII (hFVIII) antigen (a) or activity (b) measured in the plasma of Hemophilia A (HemoA) mice treated as newborns by i.v. injection of 2.5 × 1010 TU/kg of the indicated LV (n = 5, for LV.FVIII in black; n = 9 for LV.coFVIII in red; n = 9 for LV.coFVIII.XTEN in blue). Linear mixed model (LME) followed by post-hoc analysis (difference between experimental groups and the reference control group is evaluated at the last time point). Bonferroni’s adjusted p-values from the post-hoc analysis are shown (b). c Single values of anti-hFVIII antibodies (Abs) measured in the plasma of mice in (a, b). d Single values and mean with SEM of hemoglobin absorbance at 595 nm collected during tail-clipping assay (see methods section) from LV-treated mice, HemoA untreated mice and wild type (wt) age-matched controls, as indicated. Abs-positive mice (empty dots) show hemostasis restoration similar to Abs-negative and wt mice. Kruskal–Wallis test followed by post-hoc analysis. e Single values and mean with SEM of vector copies per diploid genome (VCN) measured in fractionated and FACS-sorted liver subpopulations (nPC, non-parenchymal cells; Hep, hepatocytes; Lsec, liver sinusoidal endothelial cells; KC, Kupffer cells; pDC, plasmacytoid dendritic cells) or in total liver and spleen of mice in (a, b) 5–6 months after LV administration. O.D., optical density; co, codon-optimized; U: units. Source data are provided as a Source Data file.
Fig. 2
Fig. 2. Dose–response of LV expressing selected FVIII transgenes in newborn-treated HemoA mice monitored long-term.
ac Single values of hFVIII antigen (a), activity (b), or anti-hFVIII Abs (c) measured in the plasma of HemoA mice treated as newborns (n = 4) by i.v. injection of 1 × 1010 TU/kg of LV.coFVIII. d Single values and mean with SEM of VCN measured in fractionated and FACS-sorted liver subpopulations or in total liver and spleen of mice in (ac) 20 months after LV administration. eg Mean with SEM of hFVIII antigen (e), activity (f), or anti-hFVIII Abs (g) measured in the plasma of HemoA mice treated as newborns by i.v. injection of the indicated doses of LV.coFVIII (n = 7 per group). h, i Mean with SEM of hFVIII antigen (h), activity (i) measured in the plasma of Abs-negative HemoA mice treated as newborns by i.v. injection of the indicated doses of LV.coFVIII.XTEN (n = 7, for 1.3 × 1010 TU/kg; n = 6, for 6 × 109 TU/kg; n = 5, for 3 × 109 TU/kg; n = 5, for 1.5 × 109 TU/kg). Linear mixed model (LME) followed by post-hoc analysis (difference between experimental groups and the reference control group is evaluated at the last time point). Bonferroni’s adjusted p-values from the post-hoc analysis are shown. Due to the lower number of time points, to improve model fit, in panel (h), time variable has been entered in the model as categorical variable. In panel (i), four extreme outlier observations have been removed from the analysis. j Single values of plateau circulating hFVIII in mice shown in (g, red dots) and in (i, blue dots) at the indicated LV doses (for mice treated with LV.coFVIII.XTEN: n = 7, for 1.3 × 1010 TU/kg; n = 6, for 6 × 109 TU/kg; n = 5, for 3 × 109 TU/kg; n = 5, for 1.5 × 109 TU/kg; for mice treated with LV.coFVIII: n = 7 for each dose). k Single values of anti-hFVIII abs (full lines, plotted on left Y-axis) and hFVIII antigen (dashed lines, plotted on right Y-axis) measured in the plasma of Abs-positive HemoA mice (3/10 mice treated at 1.3 × 1010 TU/Kg; 2/7 mice treated at 6 × 109 TU/kg; 3/8 mice treated at 3 × 109 TU/kg; 1/6 mice treated at 1.5 × 109 TU/kg). l Single values and mean with SEM of VCN measured in the total liver of mice in (h, i) 6 months post-LV administration at the indicated doses. Source data are provided as a Source Data file.
Fig. 3
Fig. 3. In vivo LV gene therapy in HemoA adult mice.
a, b Single values of hFVIII antigen (a) or activity (b) measured in the plasma of immunodeficient RagHemoA mice treated at 8 weeks of age (n = 5) by i.v. injection of 8 × 1010 TU/kg of LV.coFVIII.XTEN. c Single values and mean with SEM of VCN measured in fractionated and FACS-sorted liver subpopulations or in total liver and spleen of mice in (a, b) 11 months after LV administration. d Single values of hFVIII antigen (d), activity (e) or anti-hFVIII Abs (f) measured in the plasma of immune-competent HemoA-R593C mice treated at 7 weeks of age (n = 9) by i.v. injection of 4 × 10¹⁰ TU/kg of LV.coFVIII.XTEN.
Fig. 4
Fig. 4. Tolerability and efficacy of in vivo LV gene therapy in NHP.
a–e Mean with SEM (n = 3) or range (n = 2) of the serum concentration of alanine aminotransferase (ALT, a), aspartate aminotransferase (AST, b), body temperature (c), counts of white blood cells (WBC, d) and lymphocytes (e) of NHP treated with LV.coFVIII (n = 3 6 × 109 TU/kg; n = 2 3 × 109 TU/kg), or with LV.coFVIII.XTEN (n = 3 3 × 10⁹ TU/kg; n = 2 1 × 109 TU/kg) at the indicated time after administration. The black dashed lines show the mean±3 standard deviations (SD) calculated on a pool of 38 pre-LV samples taken from 19 animals; the blue dashed lines show the normal reference values for Macaca fascicularis. f, g Single values of the concentration of hFVIII antigen (f) or activity (g) measured in the plasma of LV-treated NHP (as indicated) at the indicated time after administration. h Mean of the concentration of hFVIII activity before Abs development in NHP treated as indicated at the indicated dose. i, j Single values of the concentration of total anti-hFVIII Abs (i), or neutralizing anti-hFVIII Abs (j) in the serum of LV-treated NHP (as indicated) at the indicated time after administration. BU: Bethesda Units.
Fig. 5
Fig. 5. LV biodistribution in treated NHP.
a Single values of VCN in the indicated organs of LV-treated NHP, as indicated, at necropsy (60 days post-LV). The dashed lines defining the gray area represent the lower limit of detection (0.0003) and the lower limit of reliable quantification (0.007, see methods section). b Single values and mean with SEM of expression analysis by quantitative PCR of WPRE normalized on the endogenous TAF7 gene on RNA extracted from five different liver lobes of LV-treated NHP, as indicated. The gray area represents mean background signal for WPRE expression in the spleen. c Single values of VCN measured or calculated (*) in the indicated liver subpopulation after gradient purification (nPC) or FACS-sorting (KC, Lsec). VCN in Hep is calculated according to the formula VCNliver = (VCNHep × 0.7) + (VCNnPC × 0.3). This formula is based on average proportion of liver cell subpopulations in the liver.
Fig. 6
Fig. 6. Immune responses following in vivo LV gene therapy in NHP.
aj Mean and SEM (n = 3, NHP treated with 6 × 109 TU/kg of LV.coFVIII or with 3 × 109 TU/kg of LV.coFVIII.XTEN) or range (n = 2, NHP treated with 3 × 109 TU/kg of LV.coFVIII or with 1 × 109 TU/kg of LV.coFVIII.XTEN) of the serum concentration of interferon-γ (IFNγ, a), interferon gamma-induced protein 10 (IP-10, b), interferon–inducible T-cell alpha chemoattractant (I-TAC, c), interleukin-5 (IL-5, d), IL-6 (e), IL-18 (f), IL-1 receptor antagonist (IL-1RA, g), monocyte chemoattractant protein 1 (MCP1, h), growth-regulated protein beta (GRO-β, i) and IL-10 (j) in LV-treated NHP, as indicated. Black dotted lines are mean±1 SD calculated on a pool of pre-LV samples taken from 20 animals. Gray area represent the window of immune-suppression regimen in LV.coFVIII or LV.coFVIII.XTEN-treated NHP (see “methods” section for details). k Histogram reporting the frequency of hFVIII-specific IFNγ producing T cells/106 T cells in NHP treated as indicated. The 18 pools of FVIII peptides cover the entire transgenes encoded by the administered LV (see Supplementary Fig. 7 for ELISpot wells). l Heatmap reporting the stimulation index (i.e. proliferation over unstimulated cells) of splenocytes kept in culture in presence of the indicated amounts of hFVIII, as indicated. Source data are provided as a Source Data file.

References

    1. Peters R, Harris T. Advances and innovations in haemophilia treatment. Nat. Rev. Drug Discov. 2018;17:493–508. doi: 10.1038/nrd.2018.70. - DOI - PubMed
    1. Mahlangu J, et al. Emicizumab prophylaxis in patients who have hemophilia A without inhibitors. N. Engl. J. Med. 2018;379:811–822. doi: 10.1056/NEJMoa1803550. - DOI - PubMed
    1. High KA, Roncarolo MG. Gene therapy. N. Engl. J. Med. 2019;381:455–464. doi: 10.1056/NEJMra1706910. - DOI - PubMed
    1. Nathwani AC, et al. Long-term safety and efficacy of factor IX gene therapy in hemophilia B. N. Engl. J. Med. 2014;371:1994–2004. doi: 10.1056/NEJMoa1407309. - DOI - PMC - PubMed
    1. George LA, et al. Hemophilia B gene therapy with a high-specific-activity factor IX variant. N. Engl. J. Med. 2017;377:2215–2227. doi: 10.1056/NEJMoa1708538. - DOI - PMC - PubMed

Publication types