. 2022 May;605(7909):357-365.
doi: 10.1038/s41586-022-04698-x. Epub 2022 May 4.

CDC7-independent G1/S transition revealed by targeted protein degradation

Affiliations

CDC7-independent G1/S transition revealed by targeted protein degradation

Jan M Suski et al. Nature. 2022 May.

Abstract

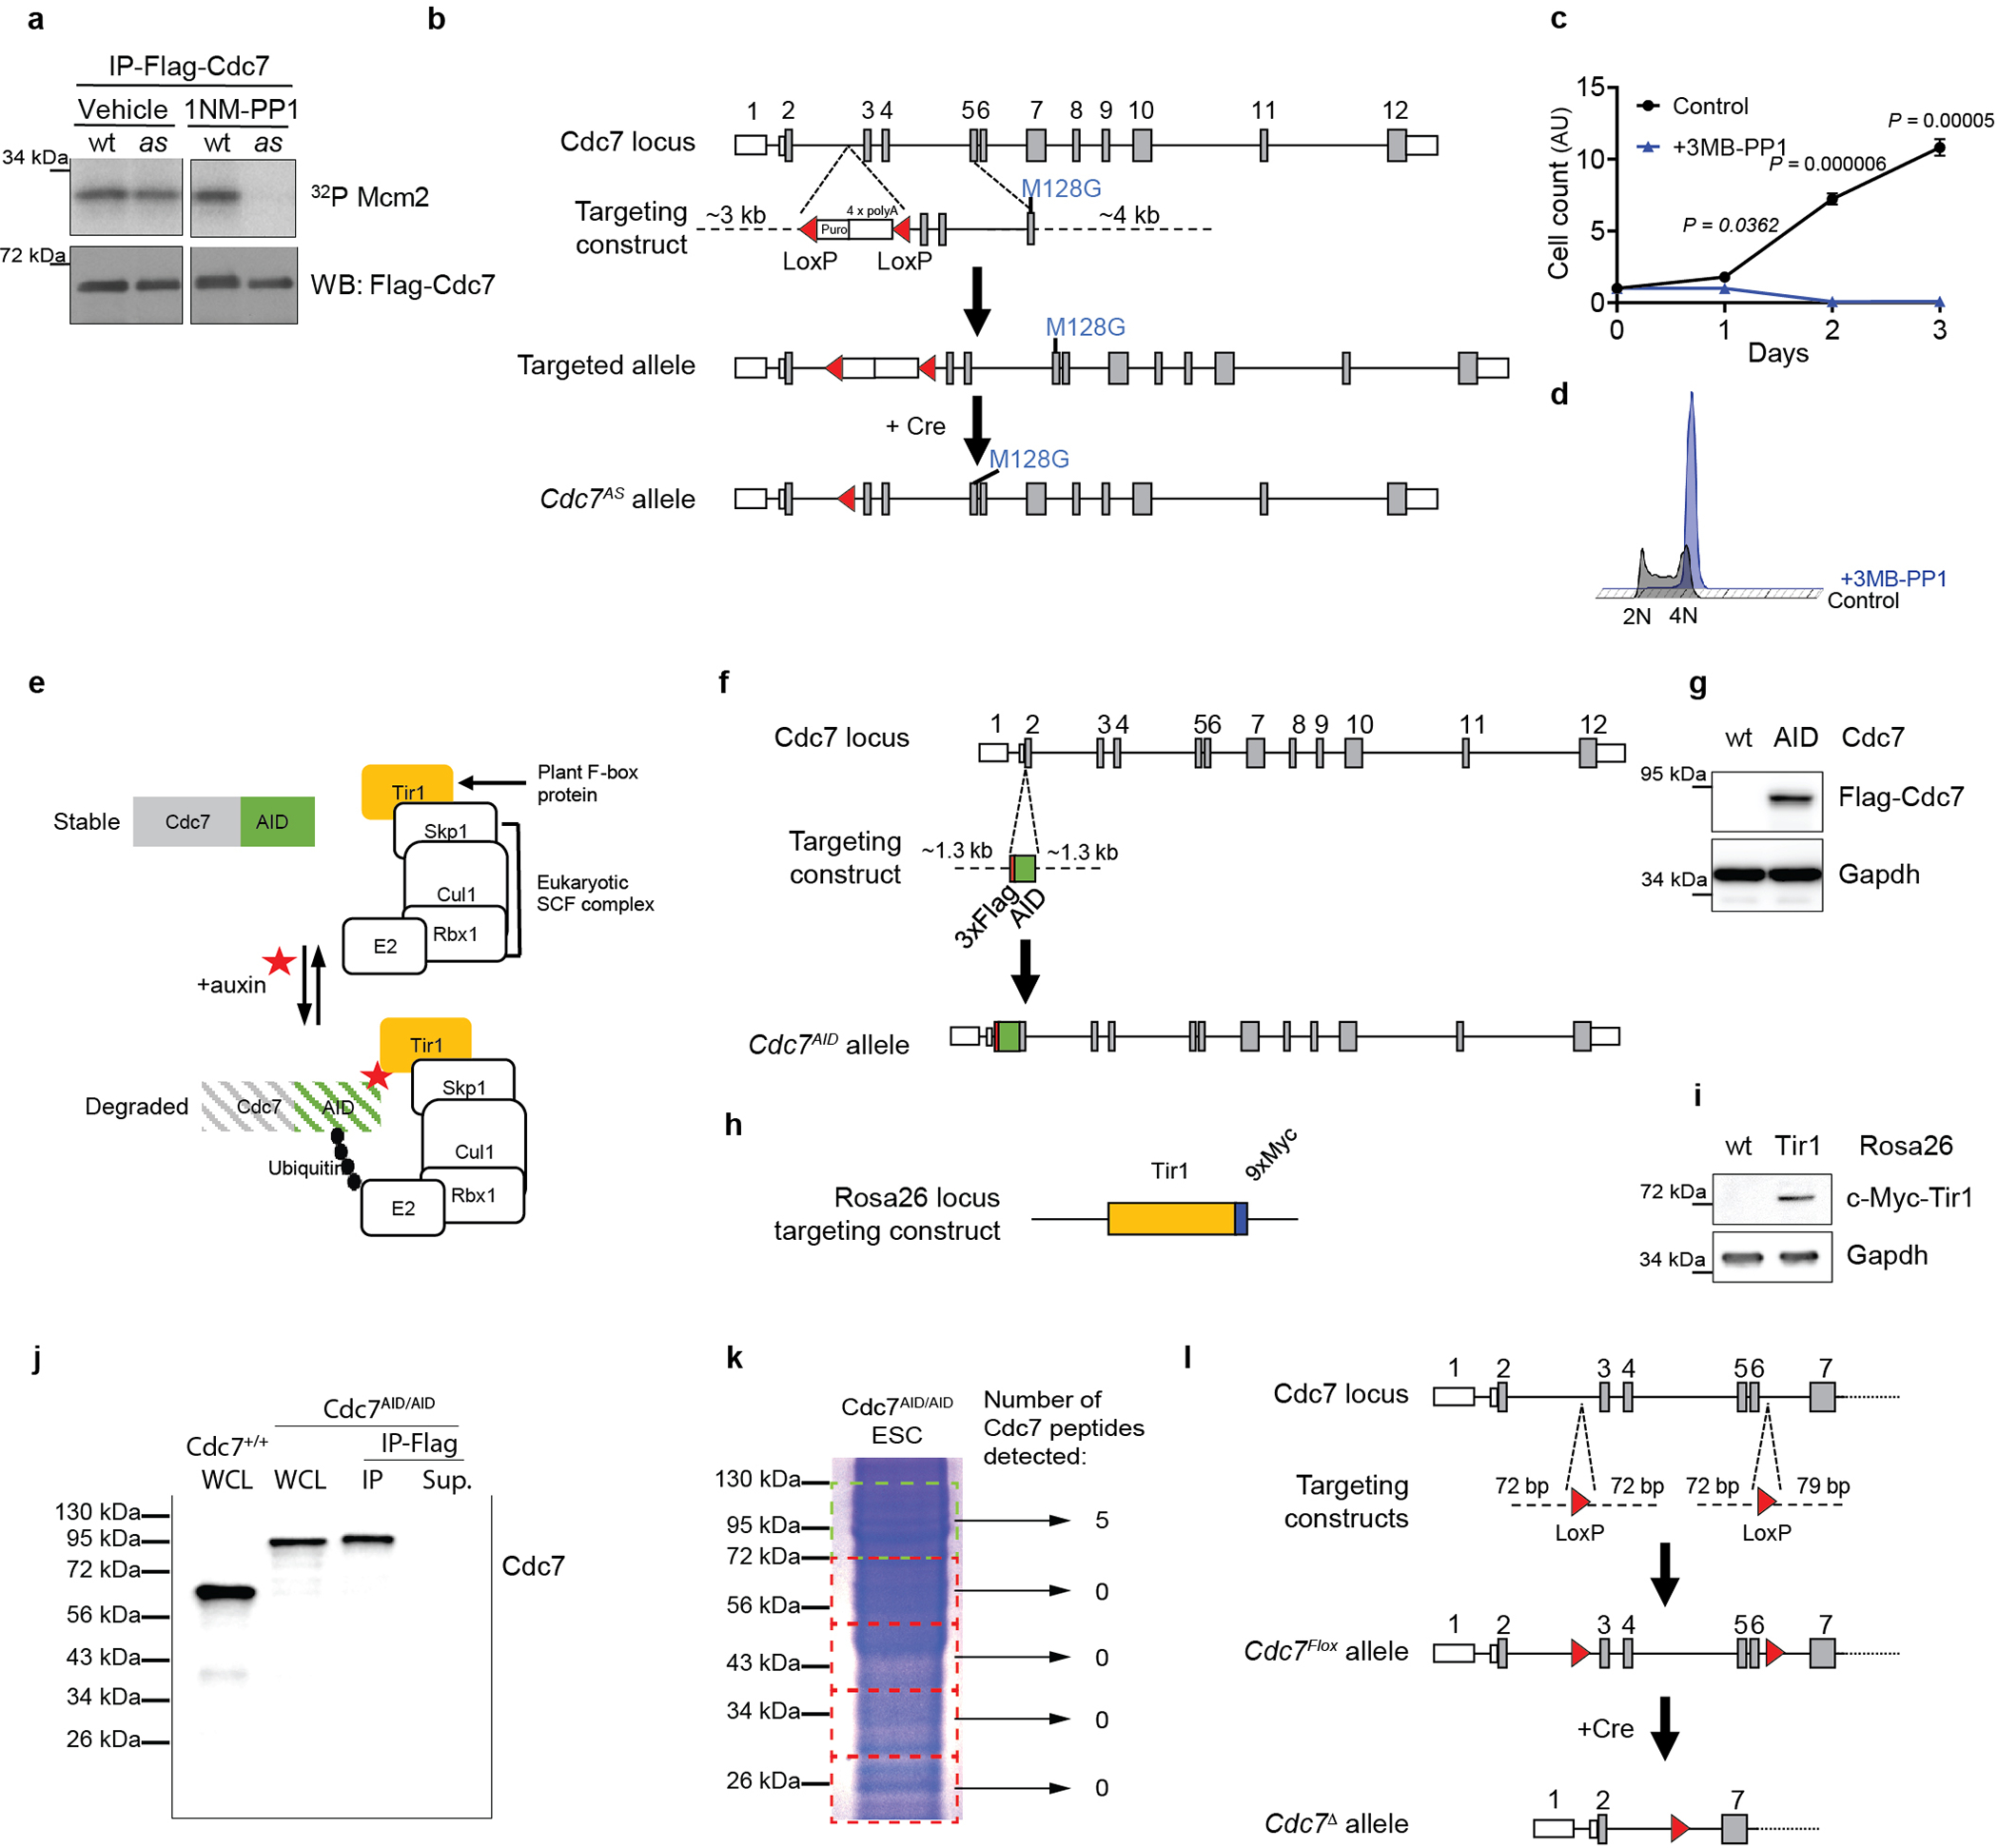
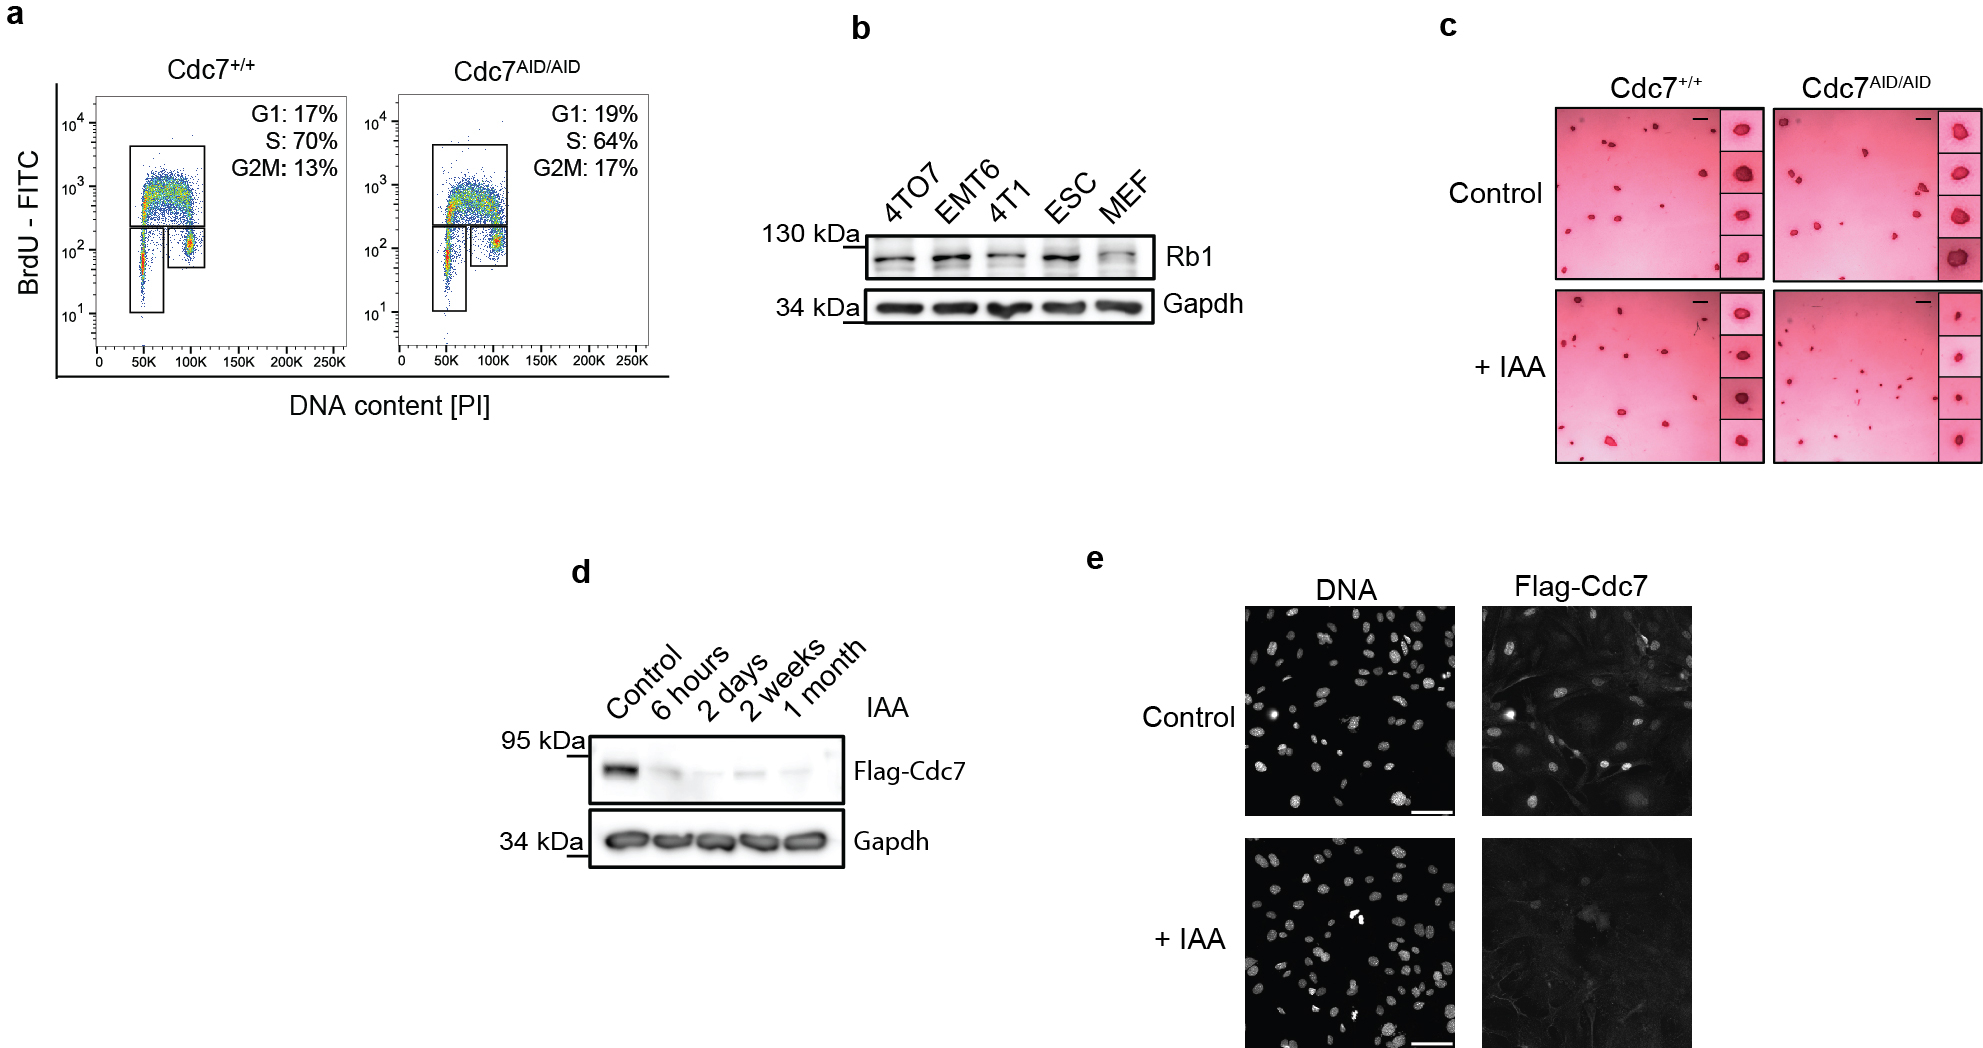
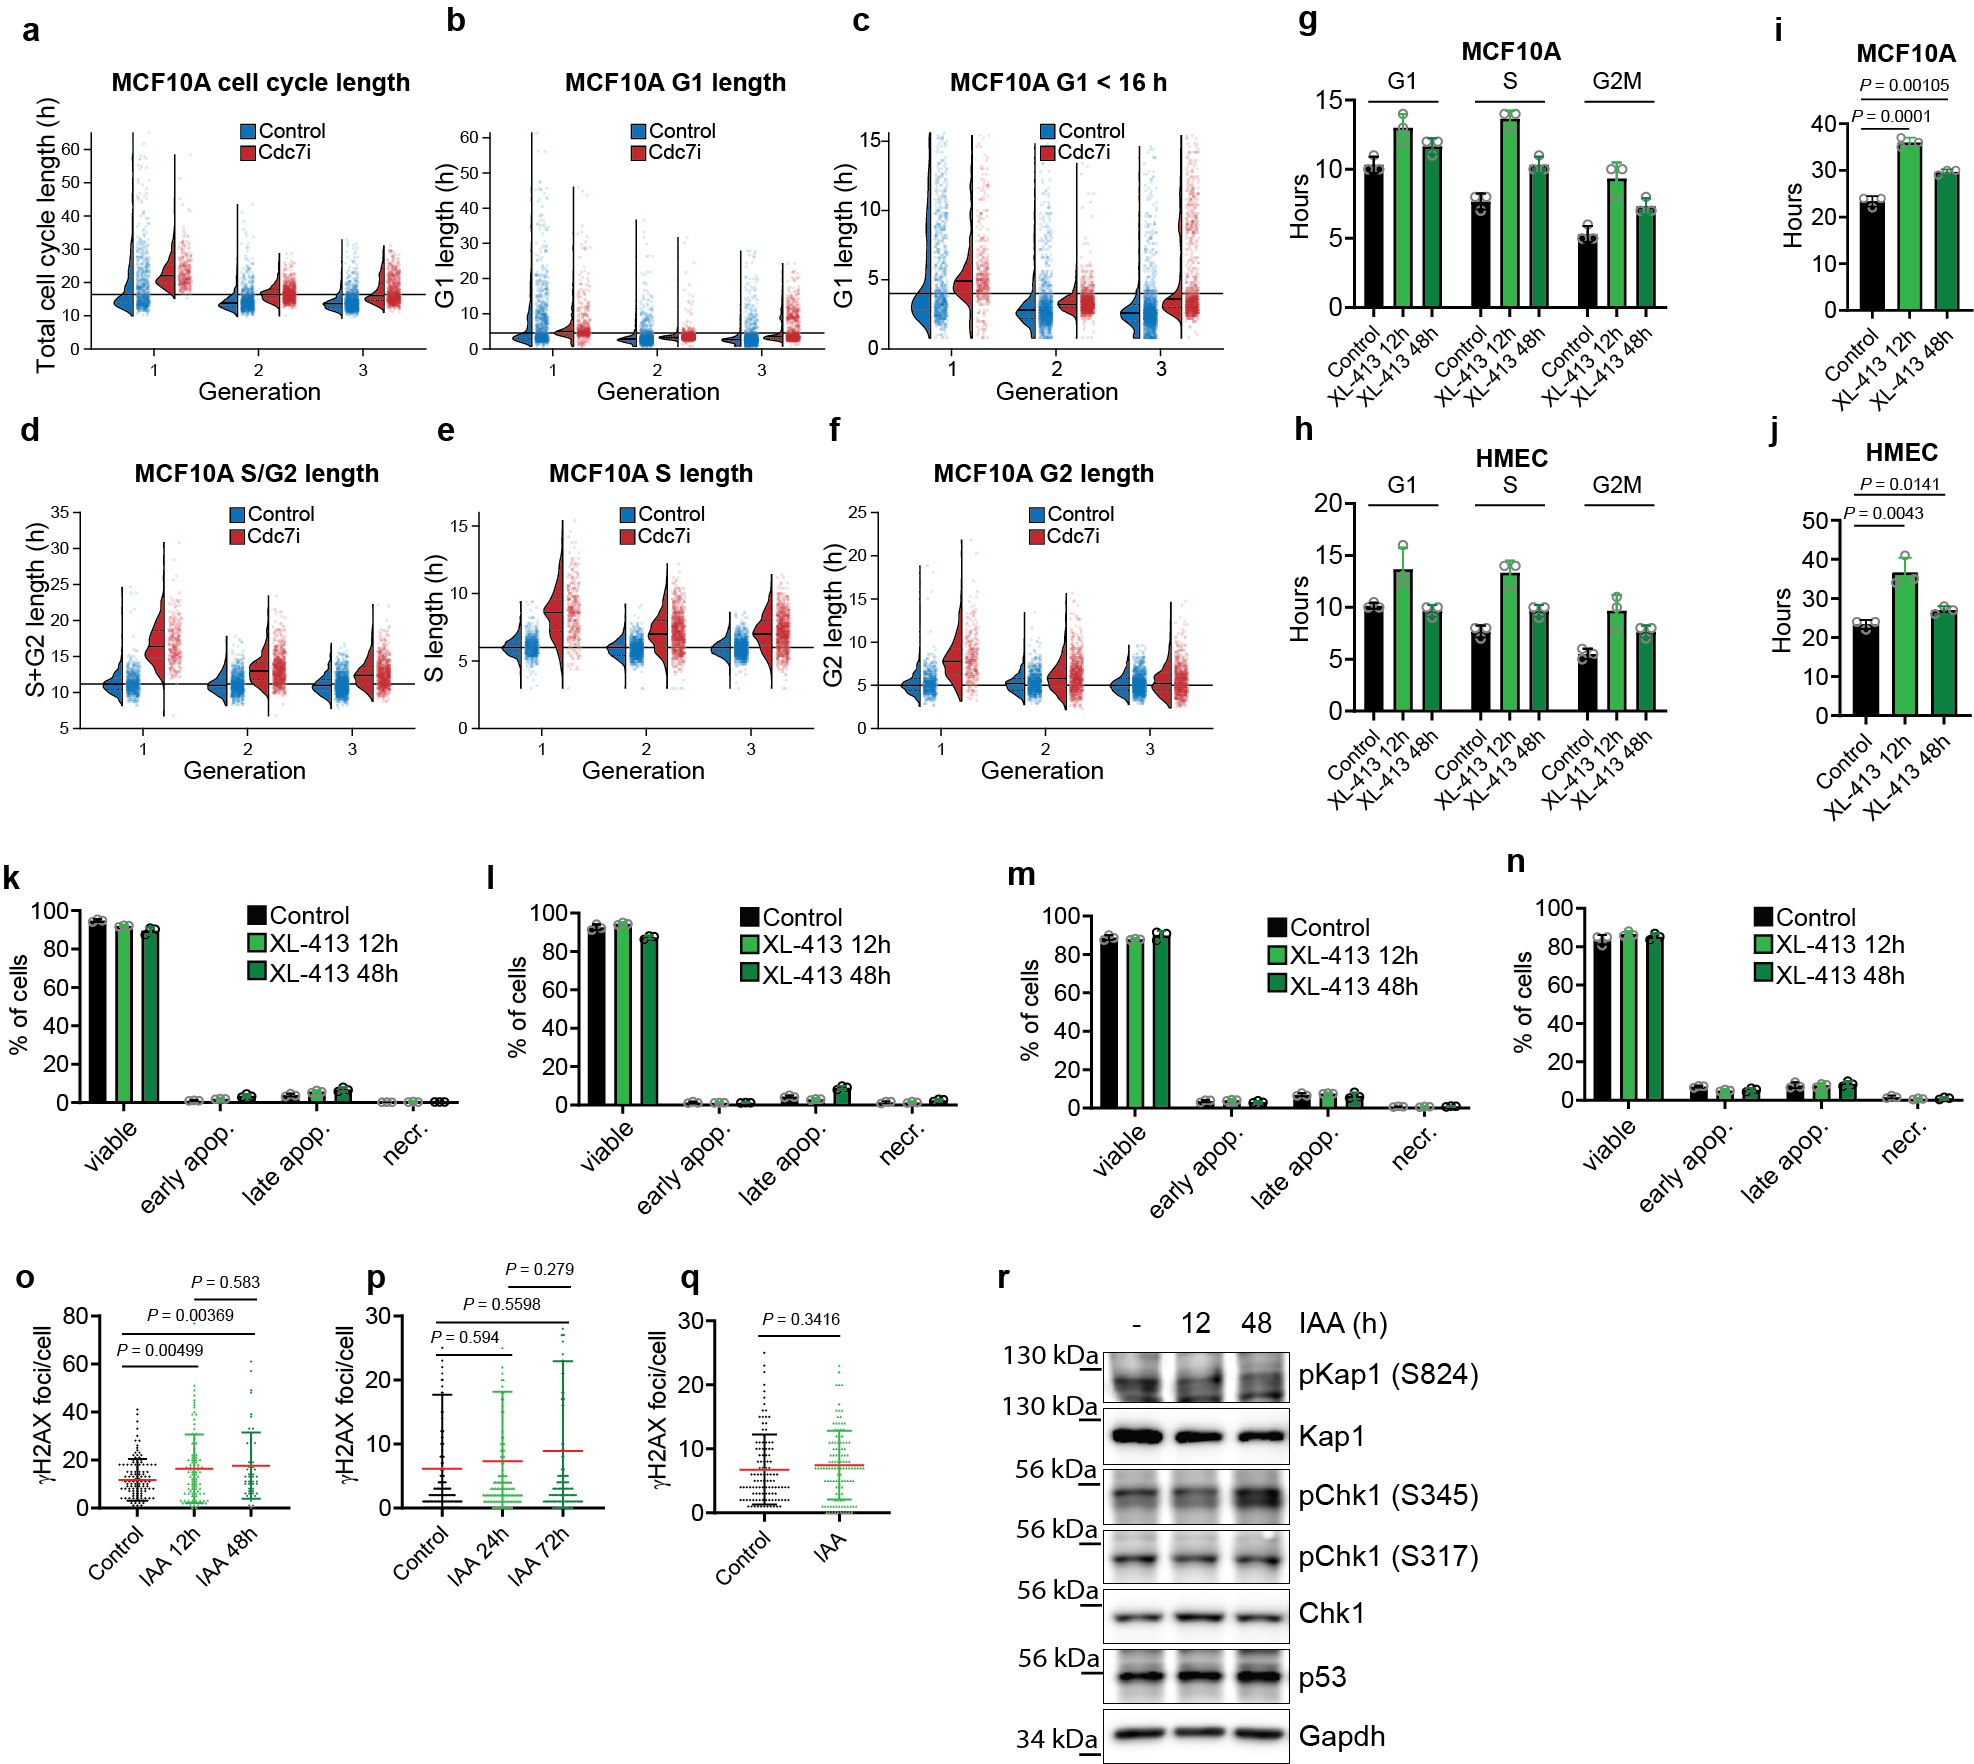
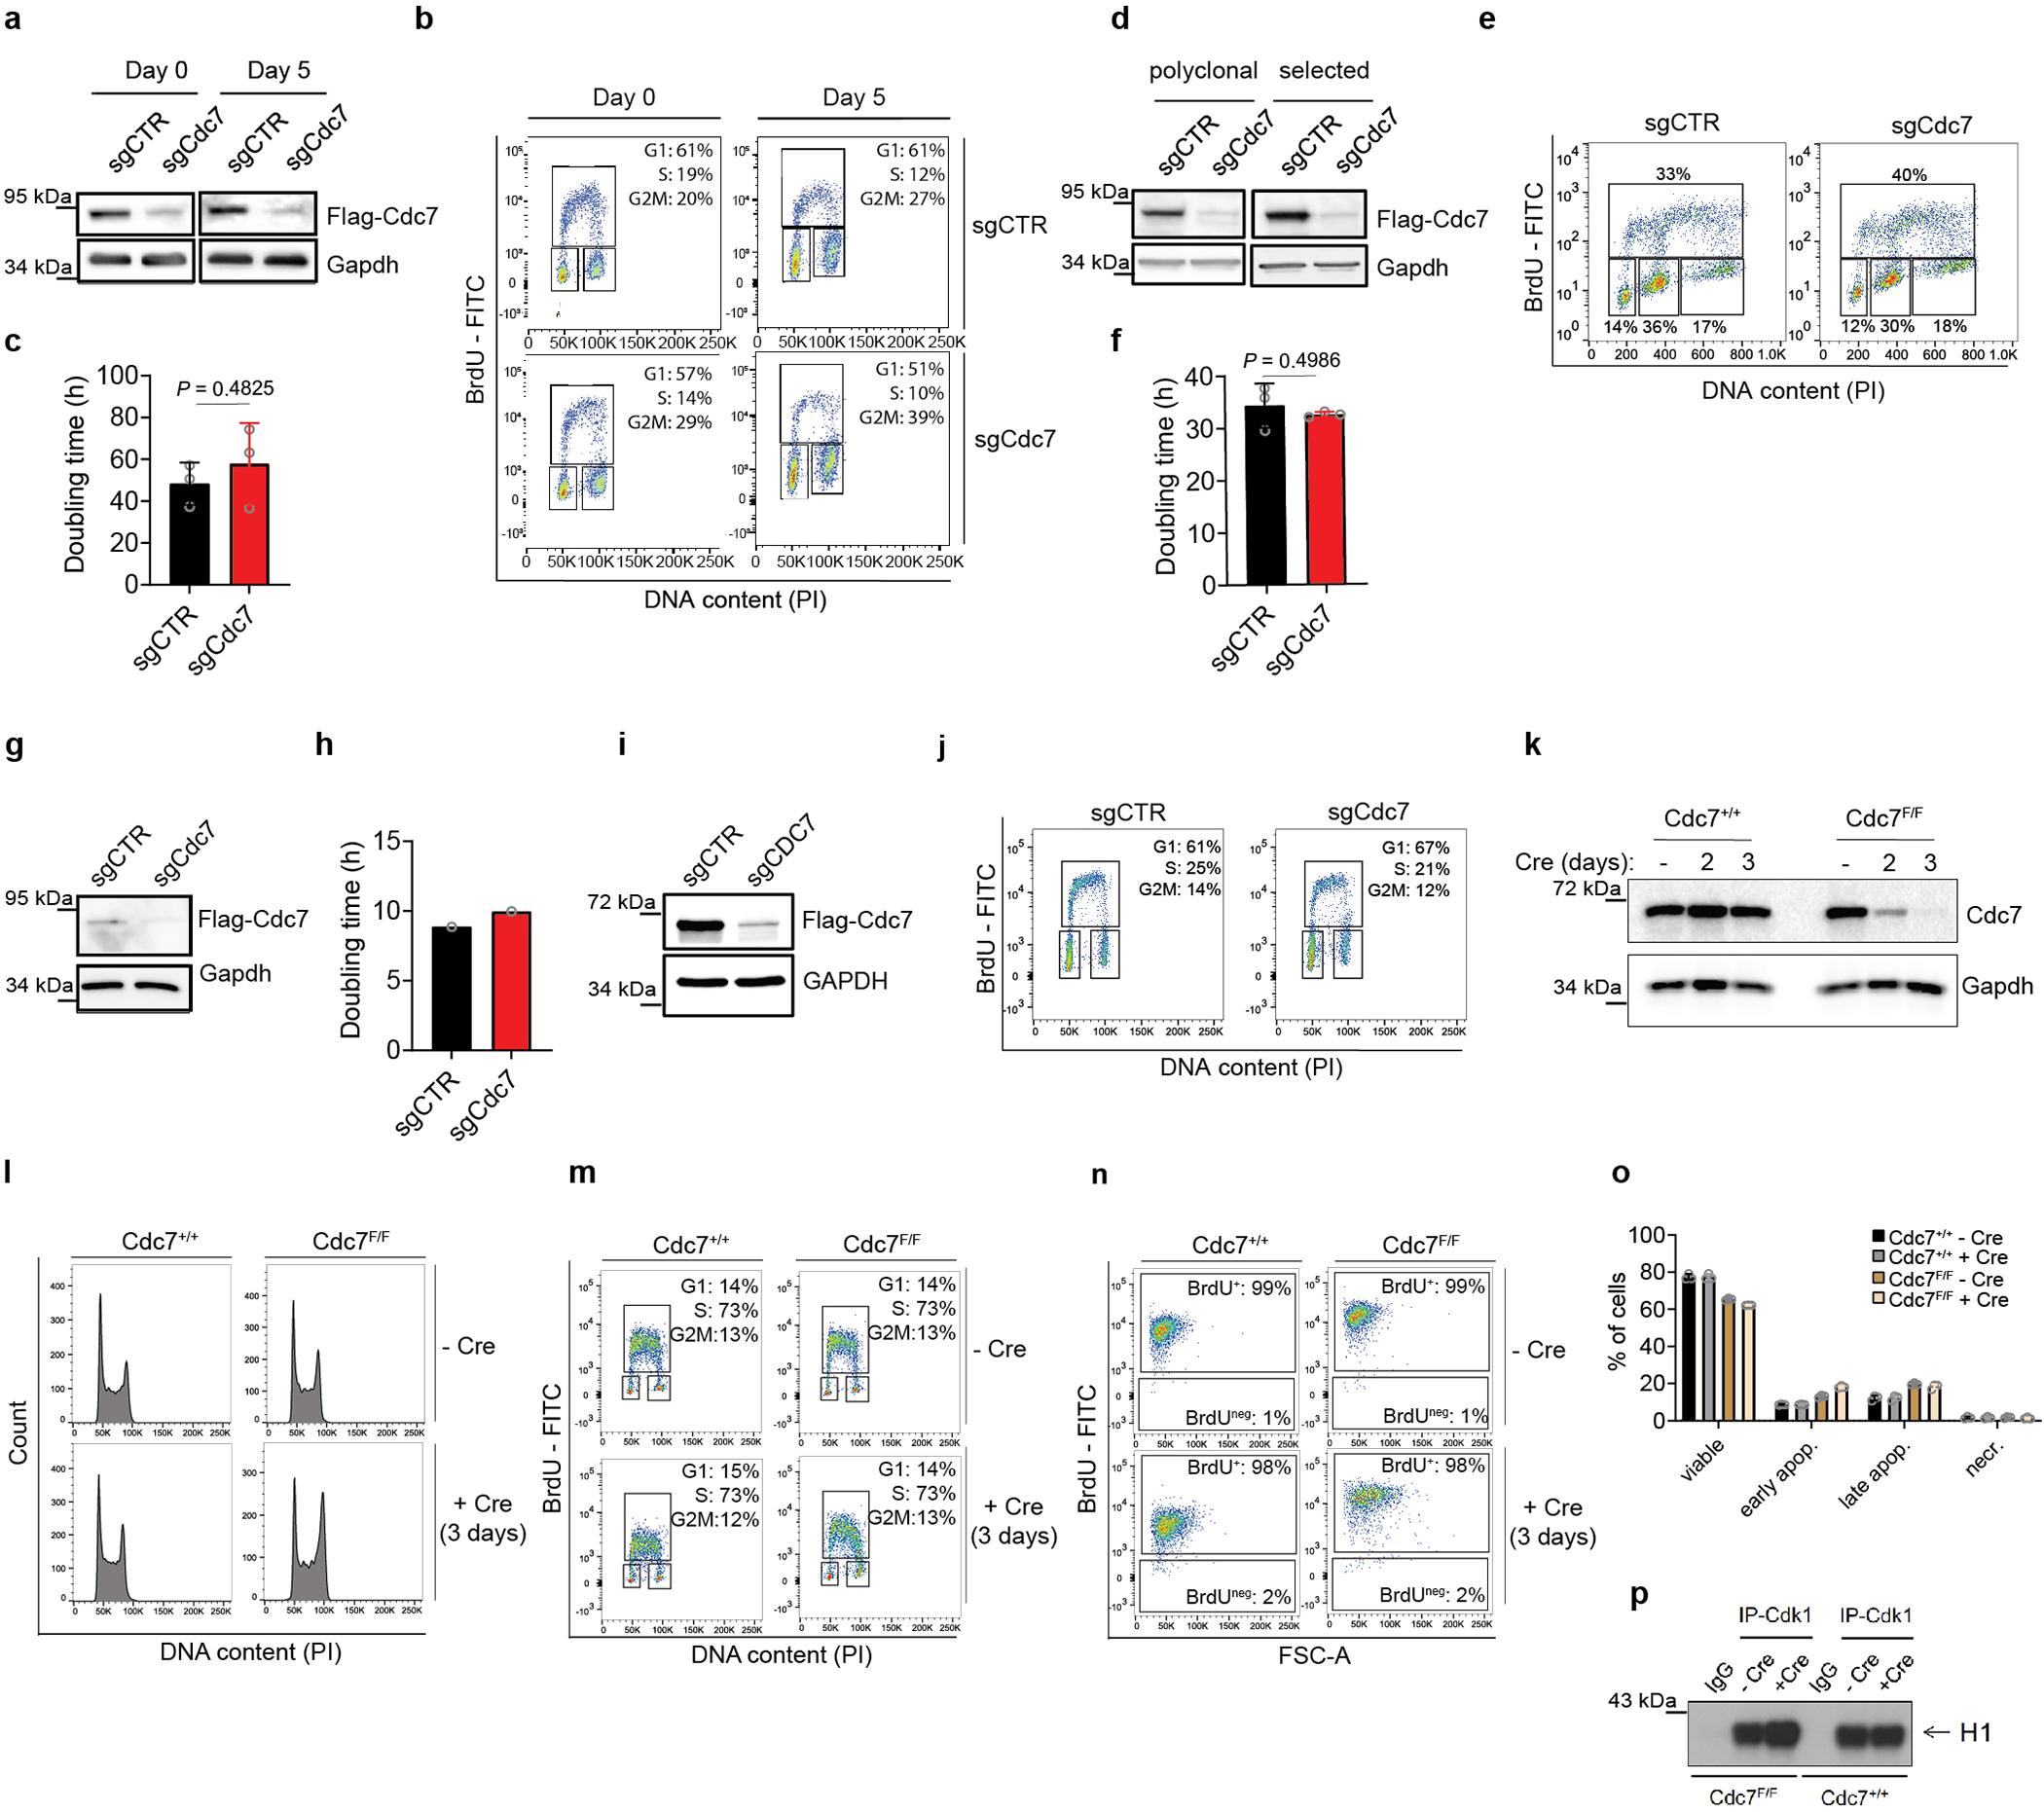
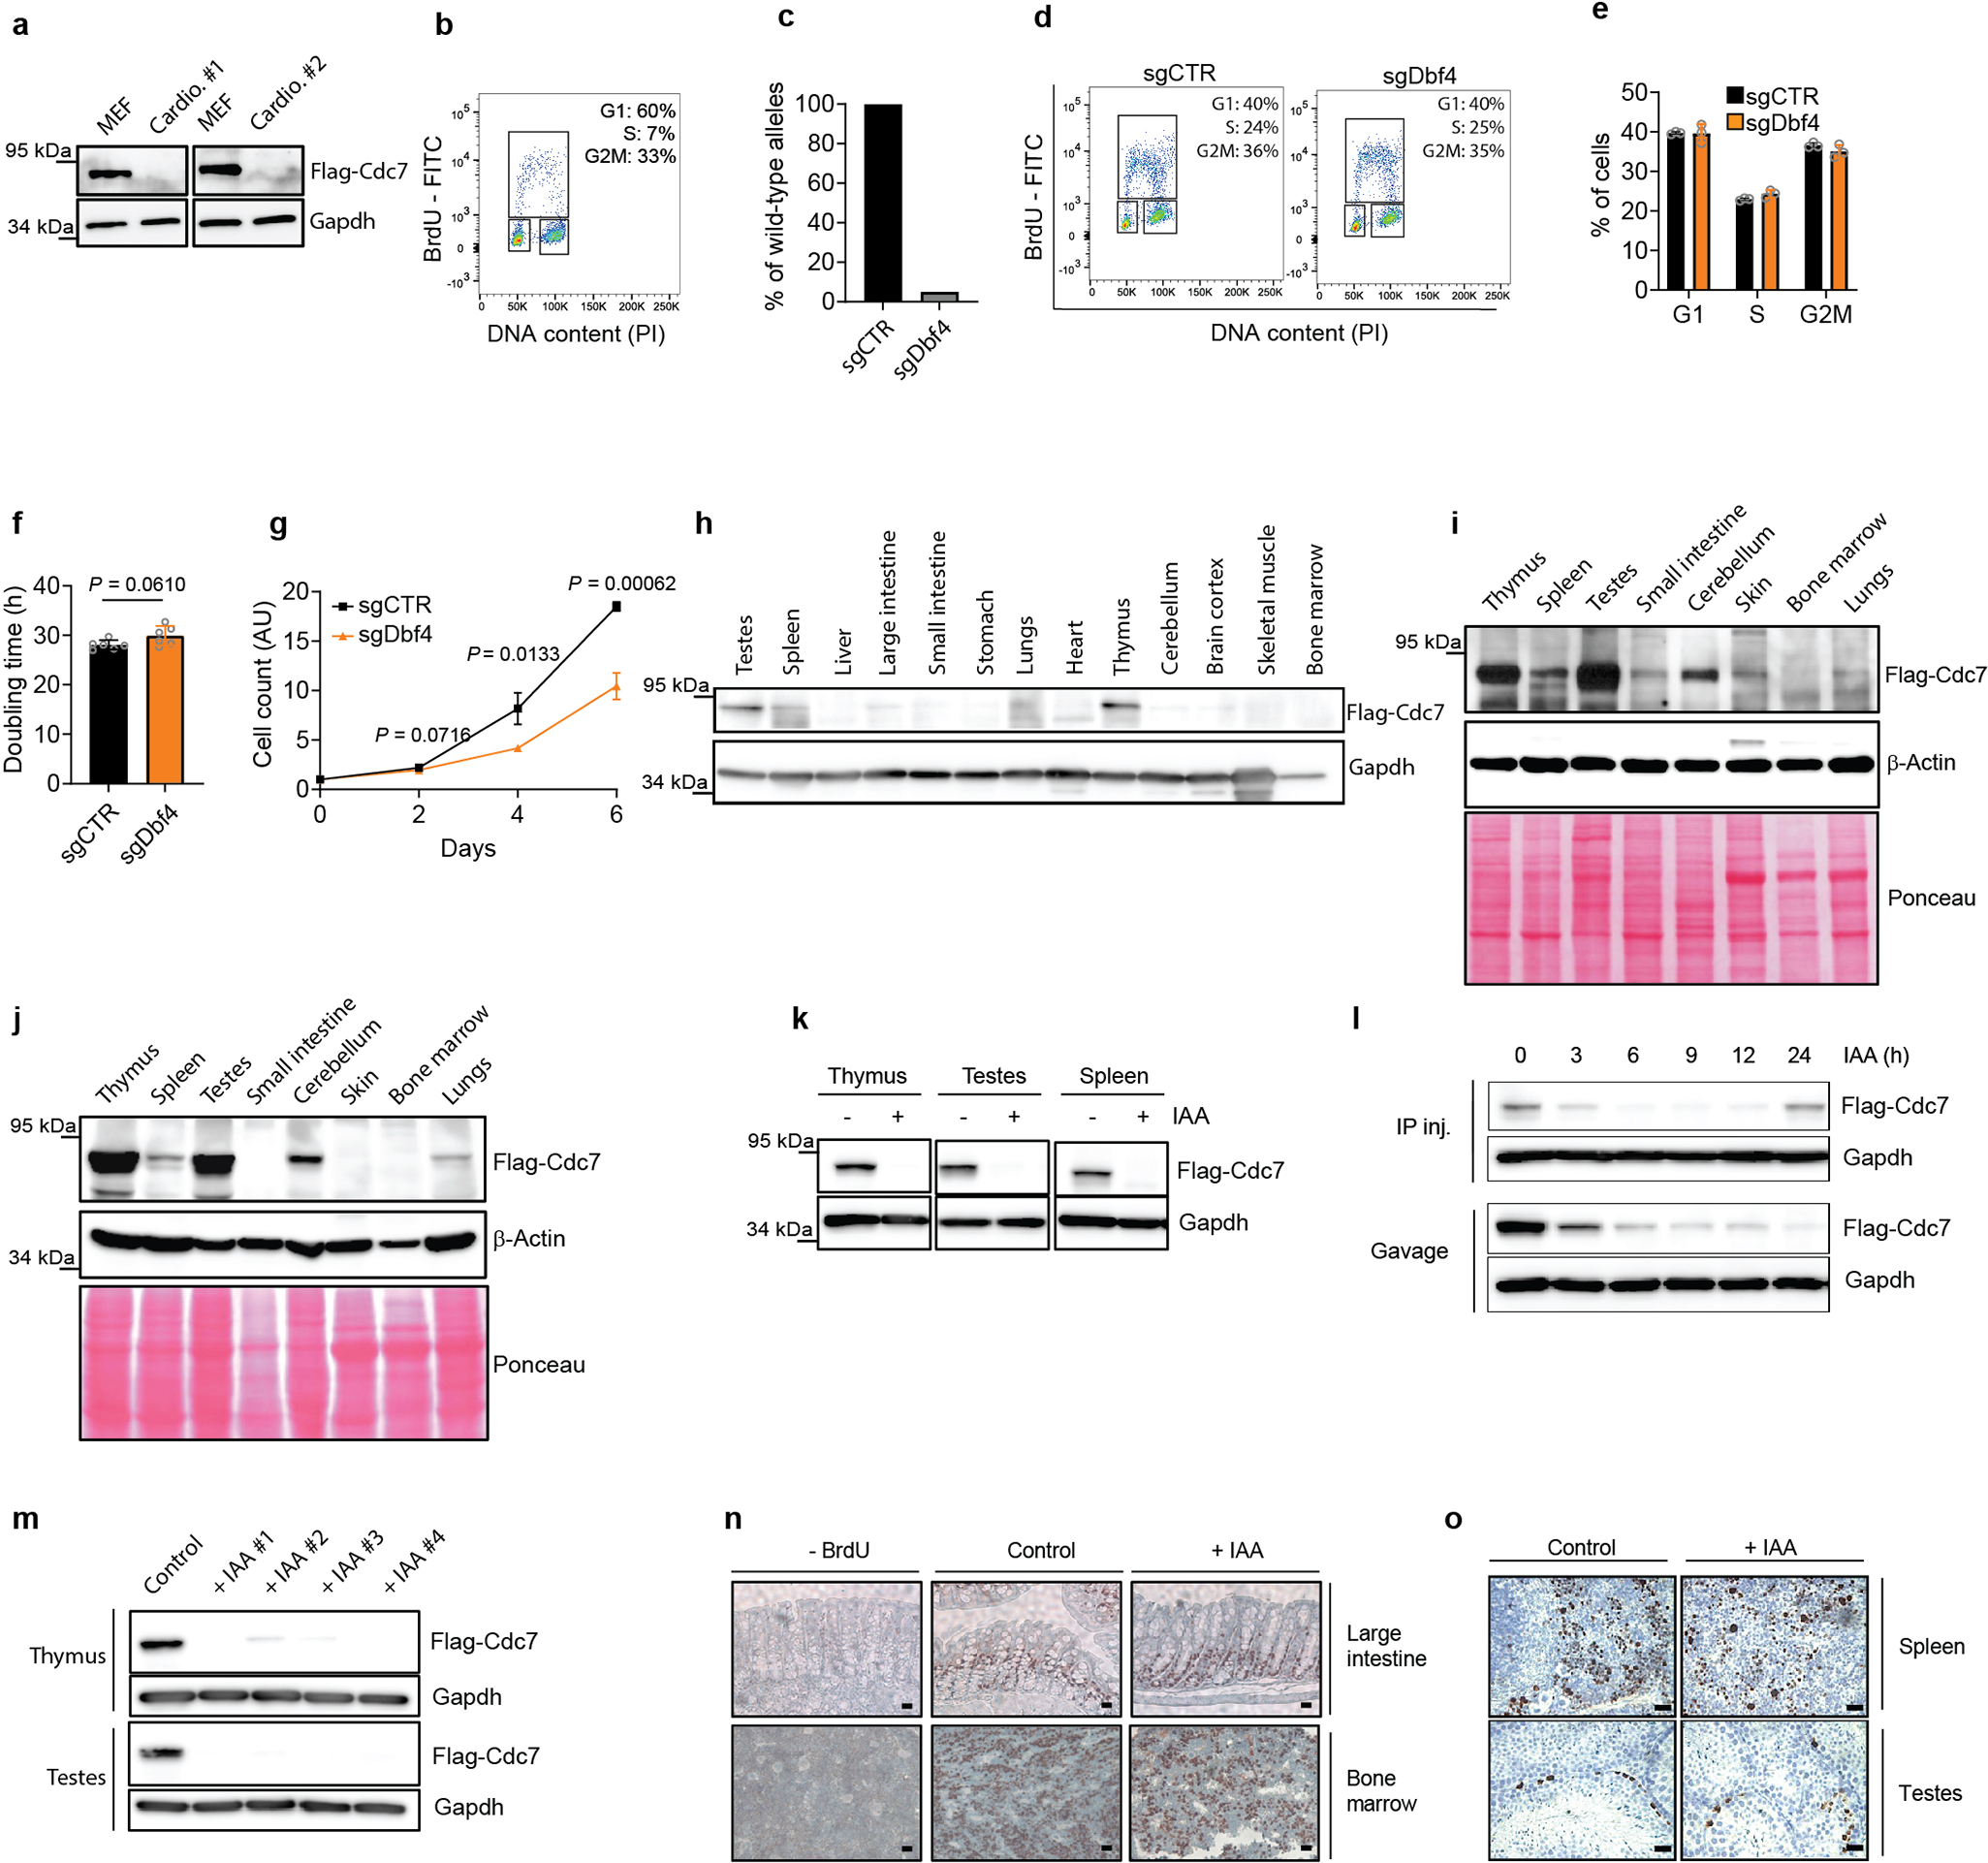
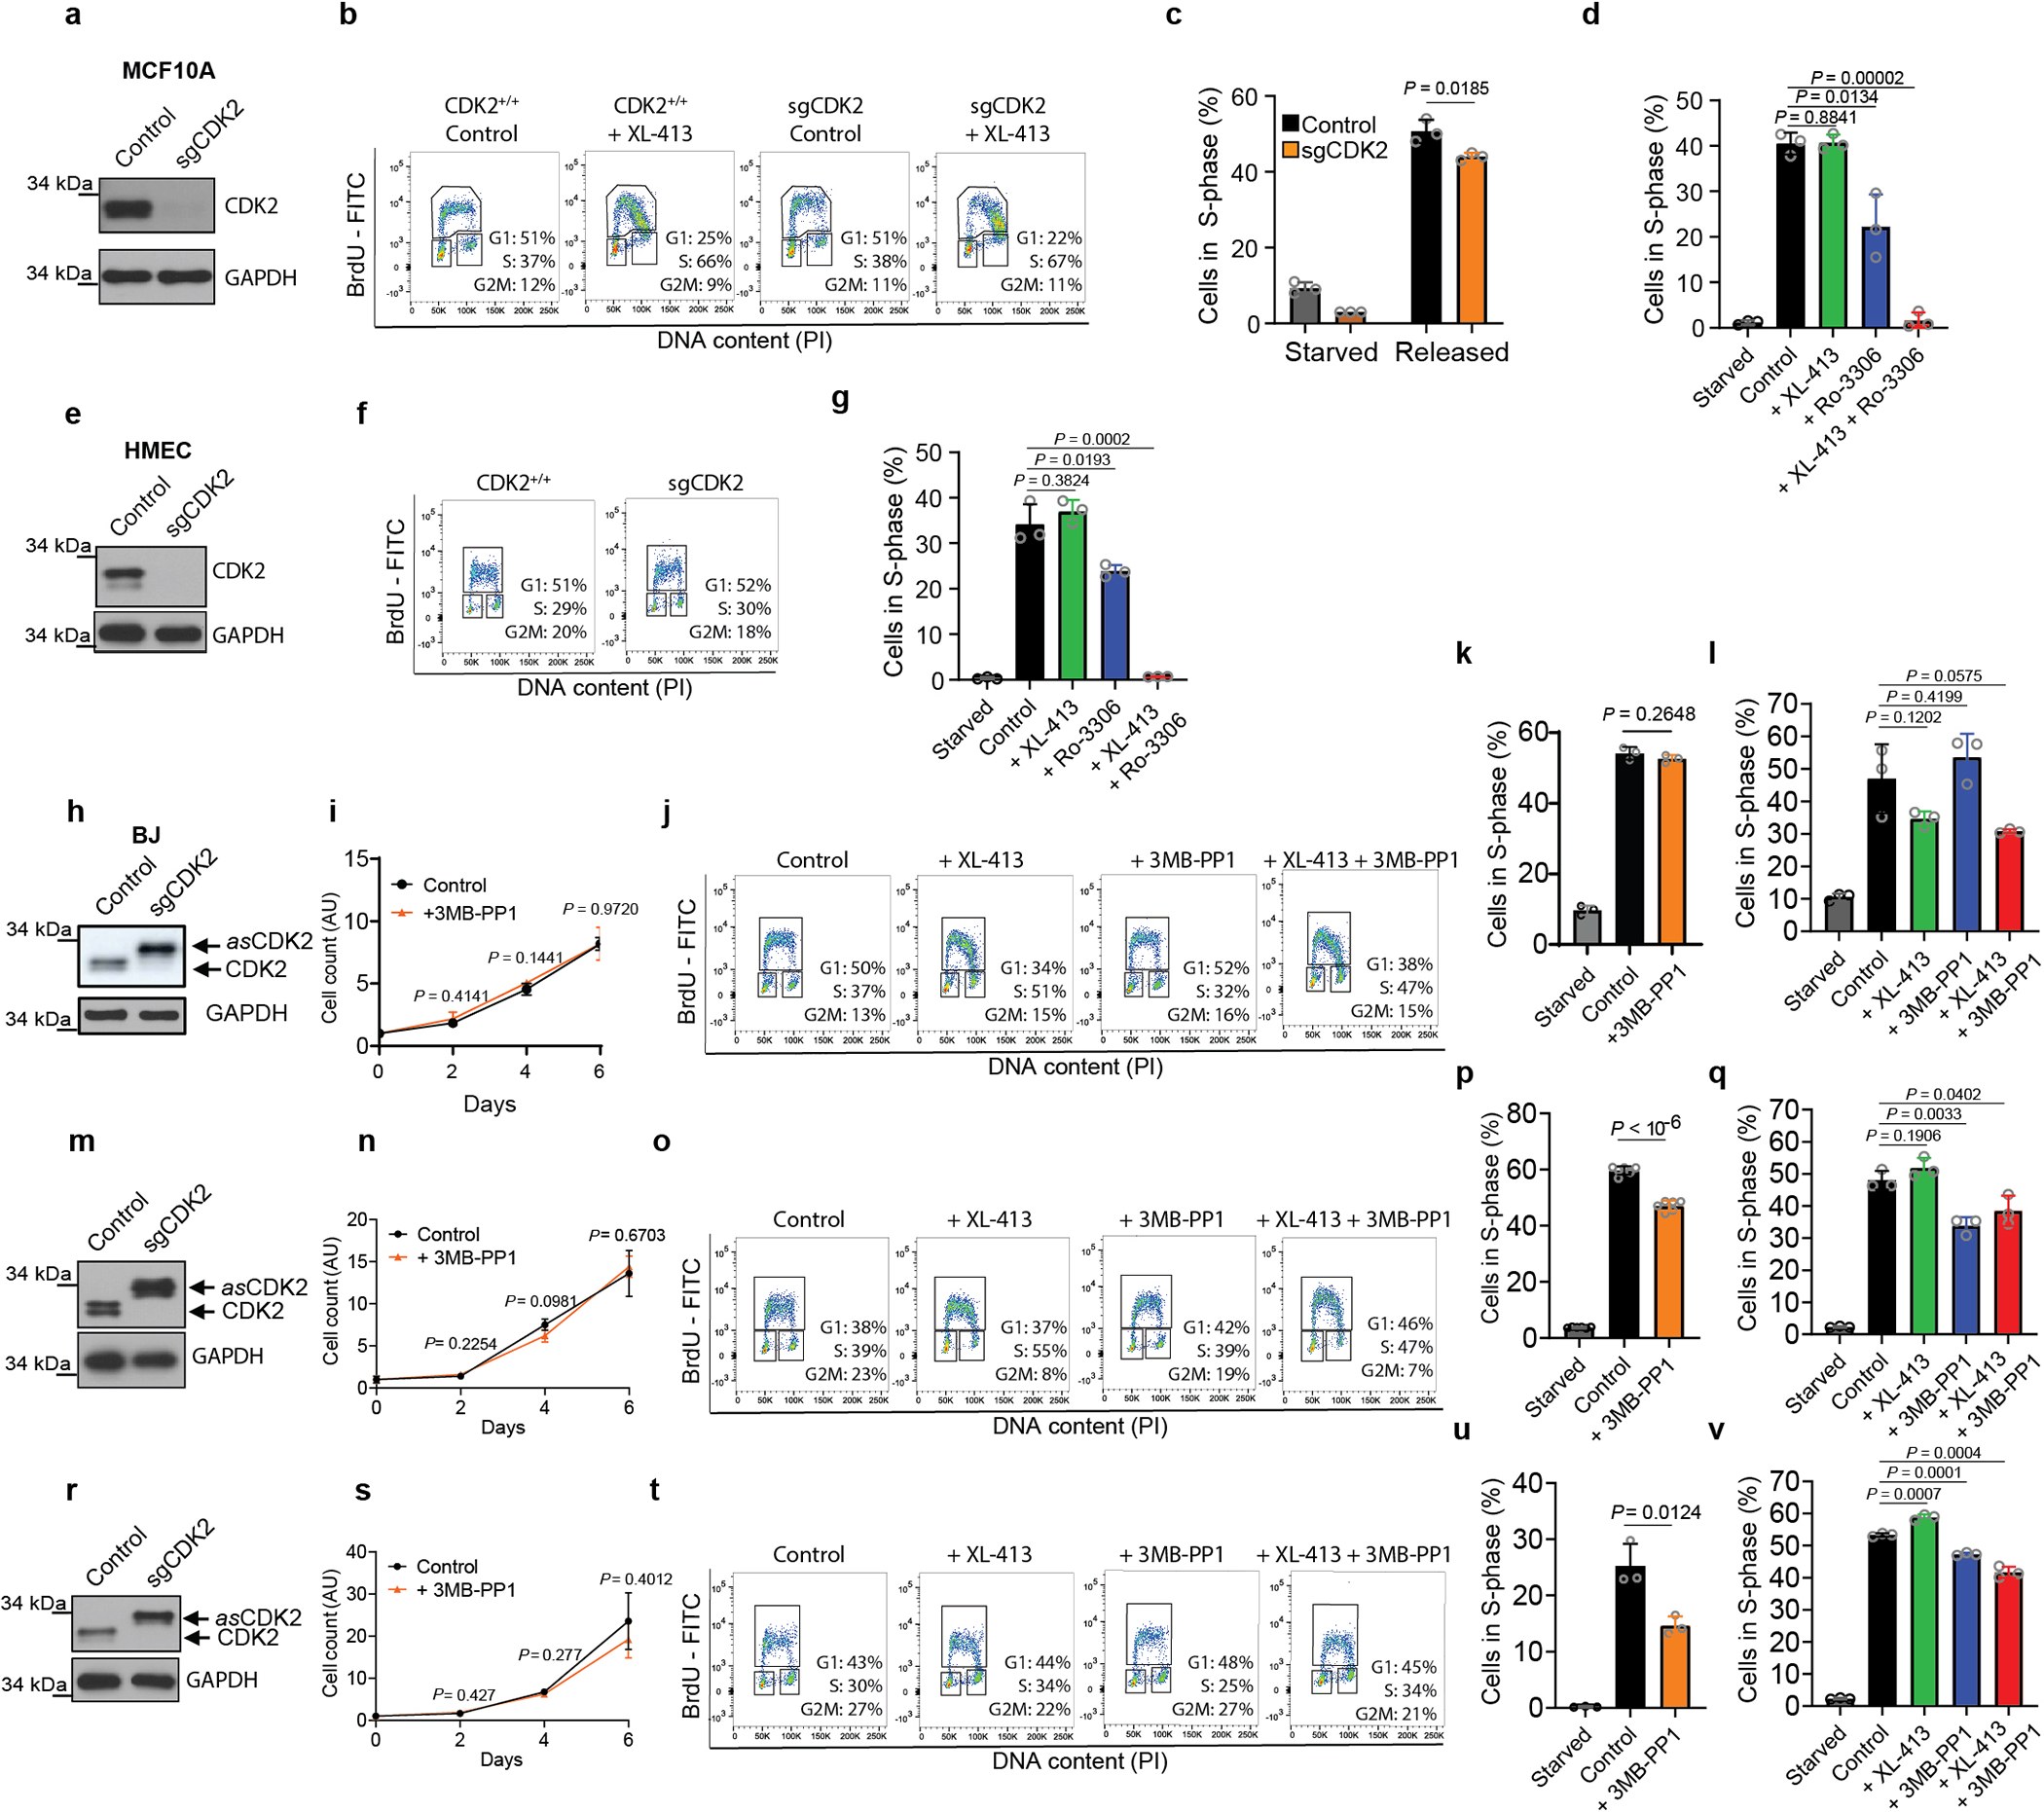
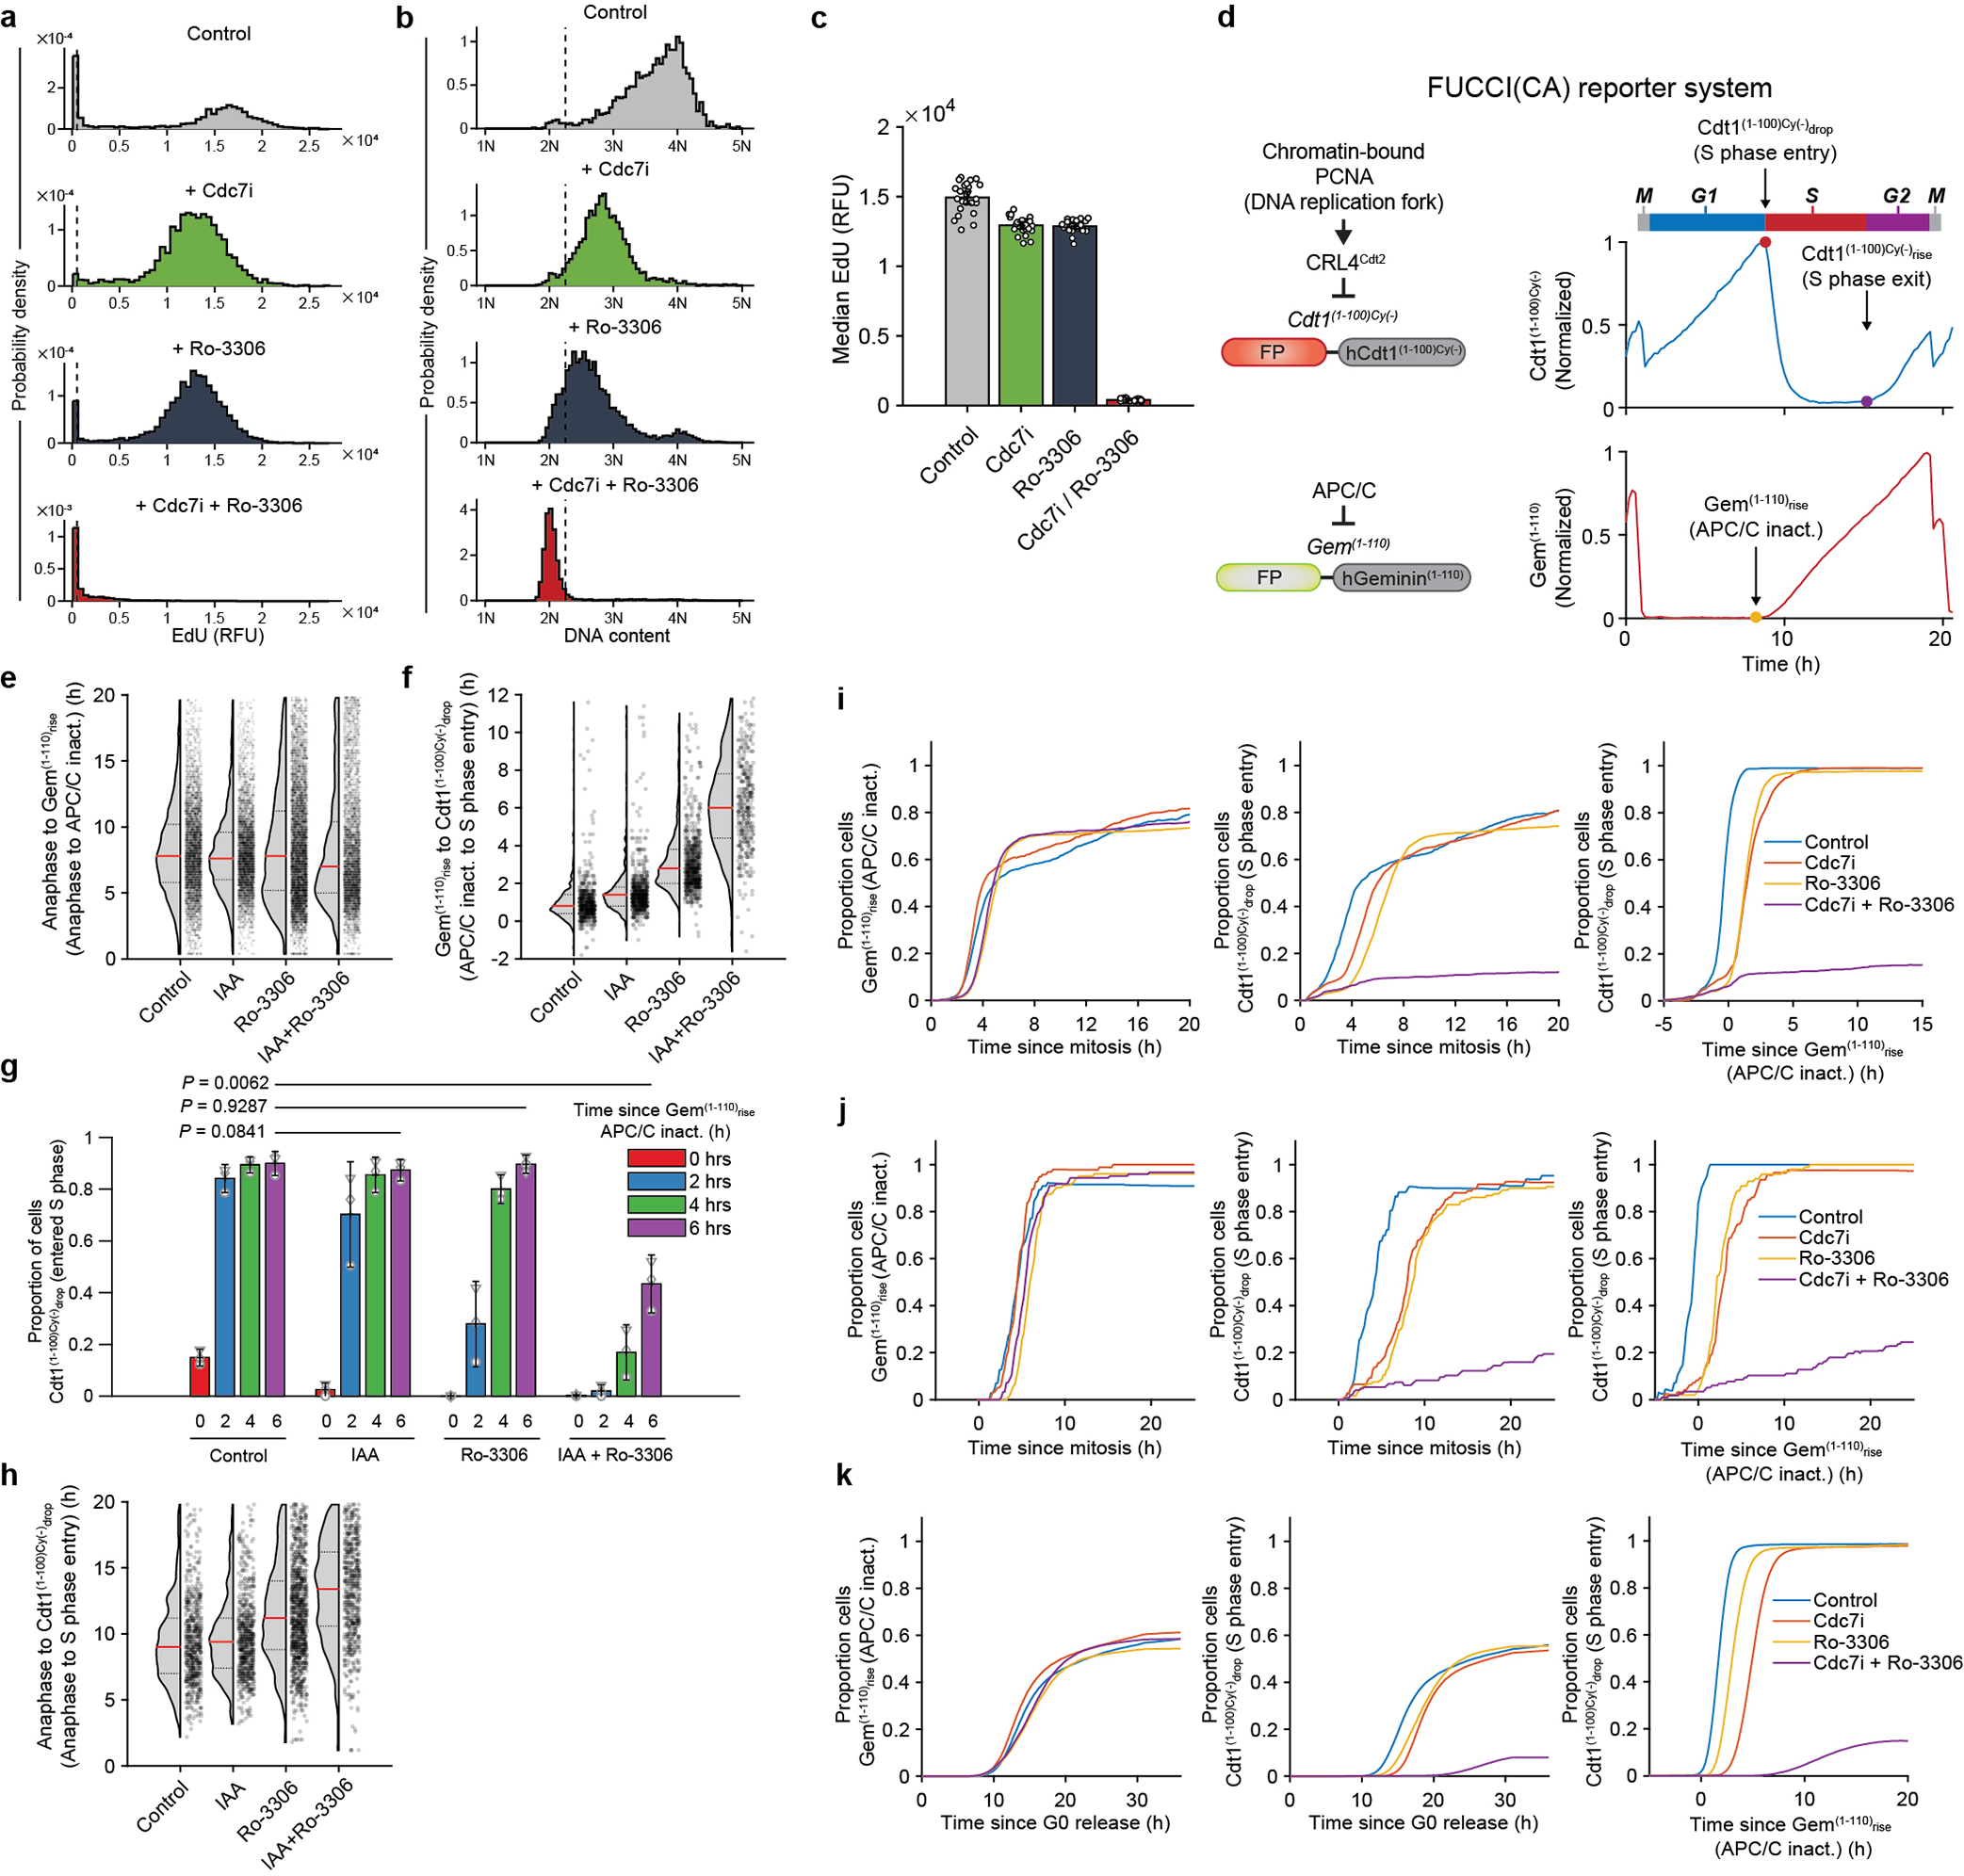
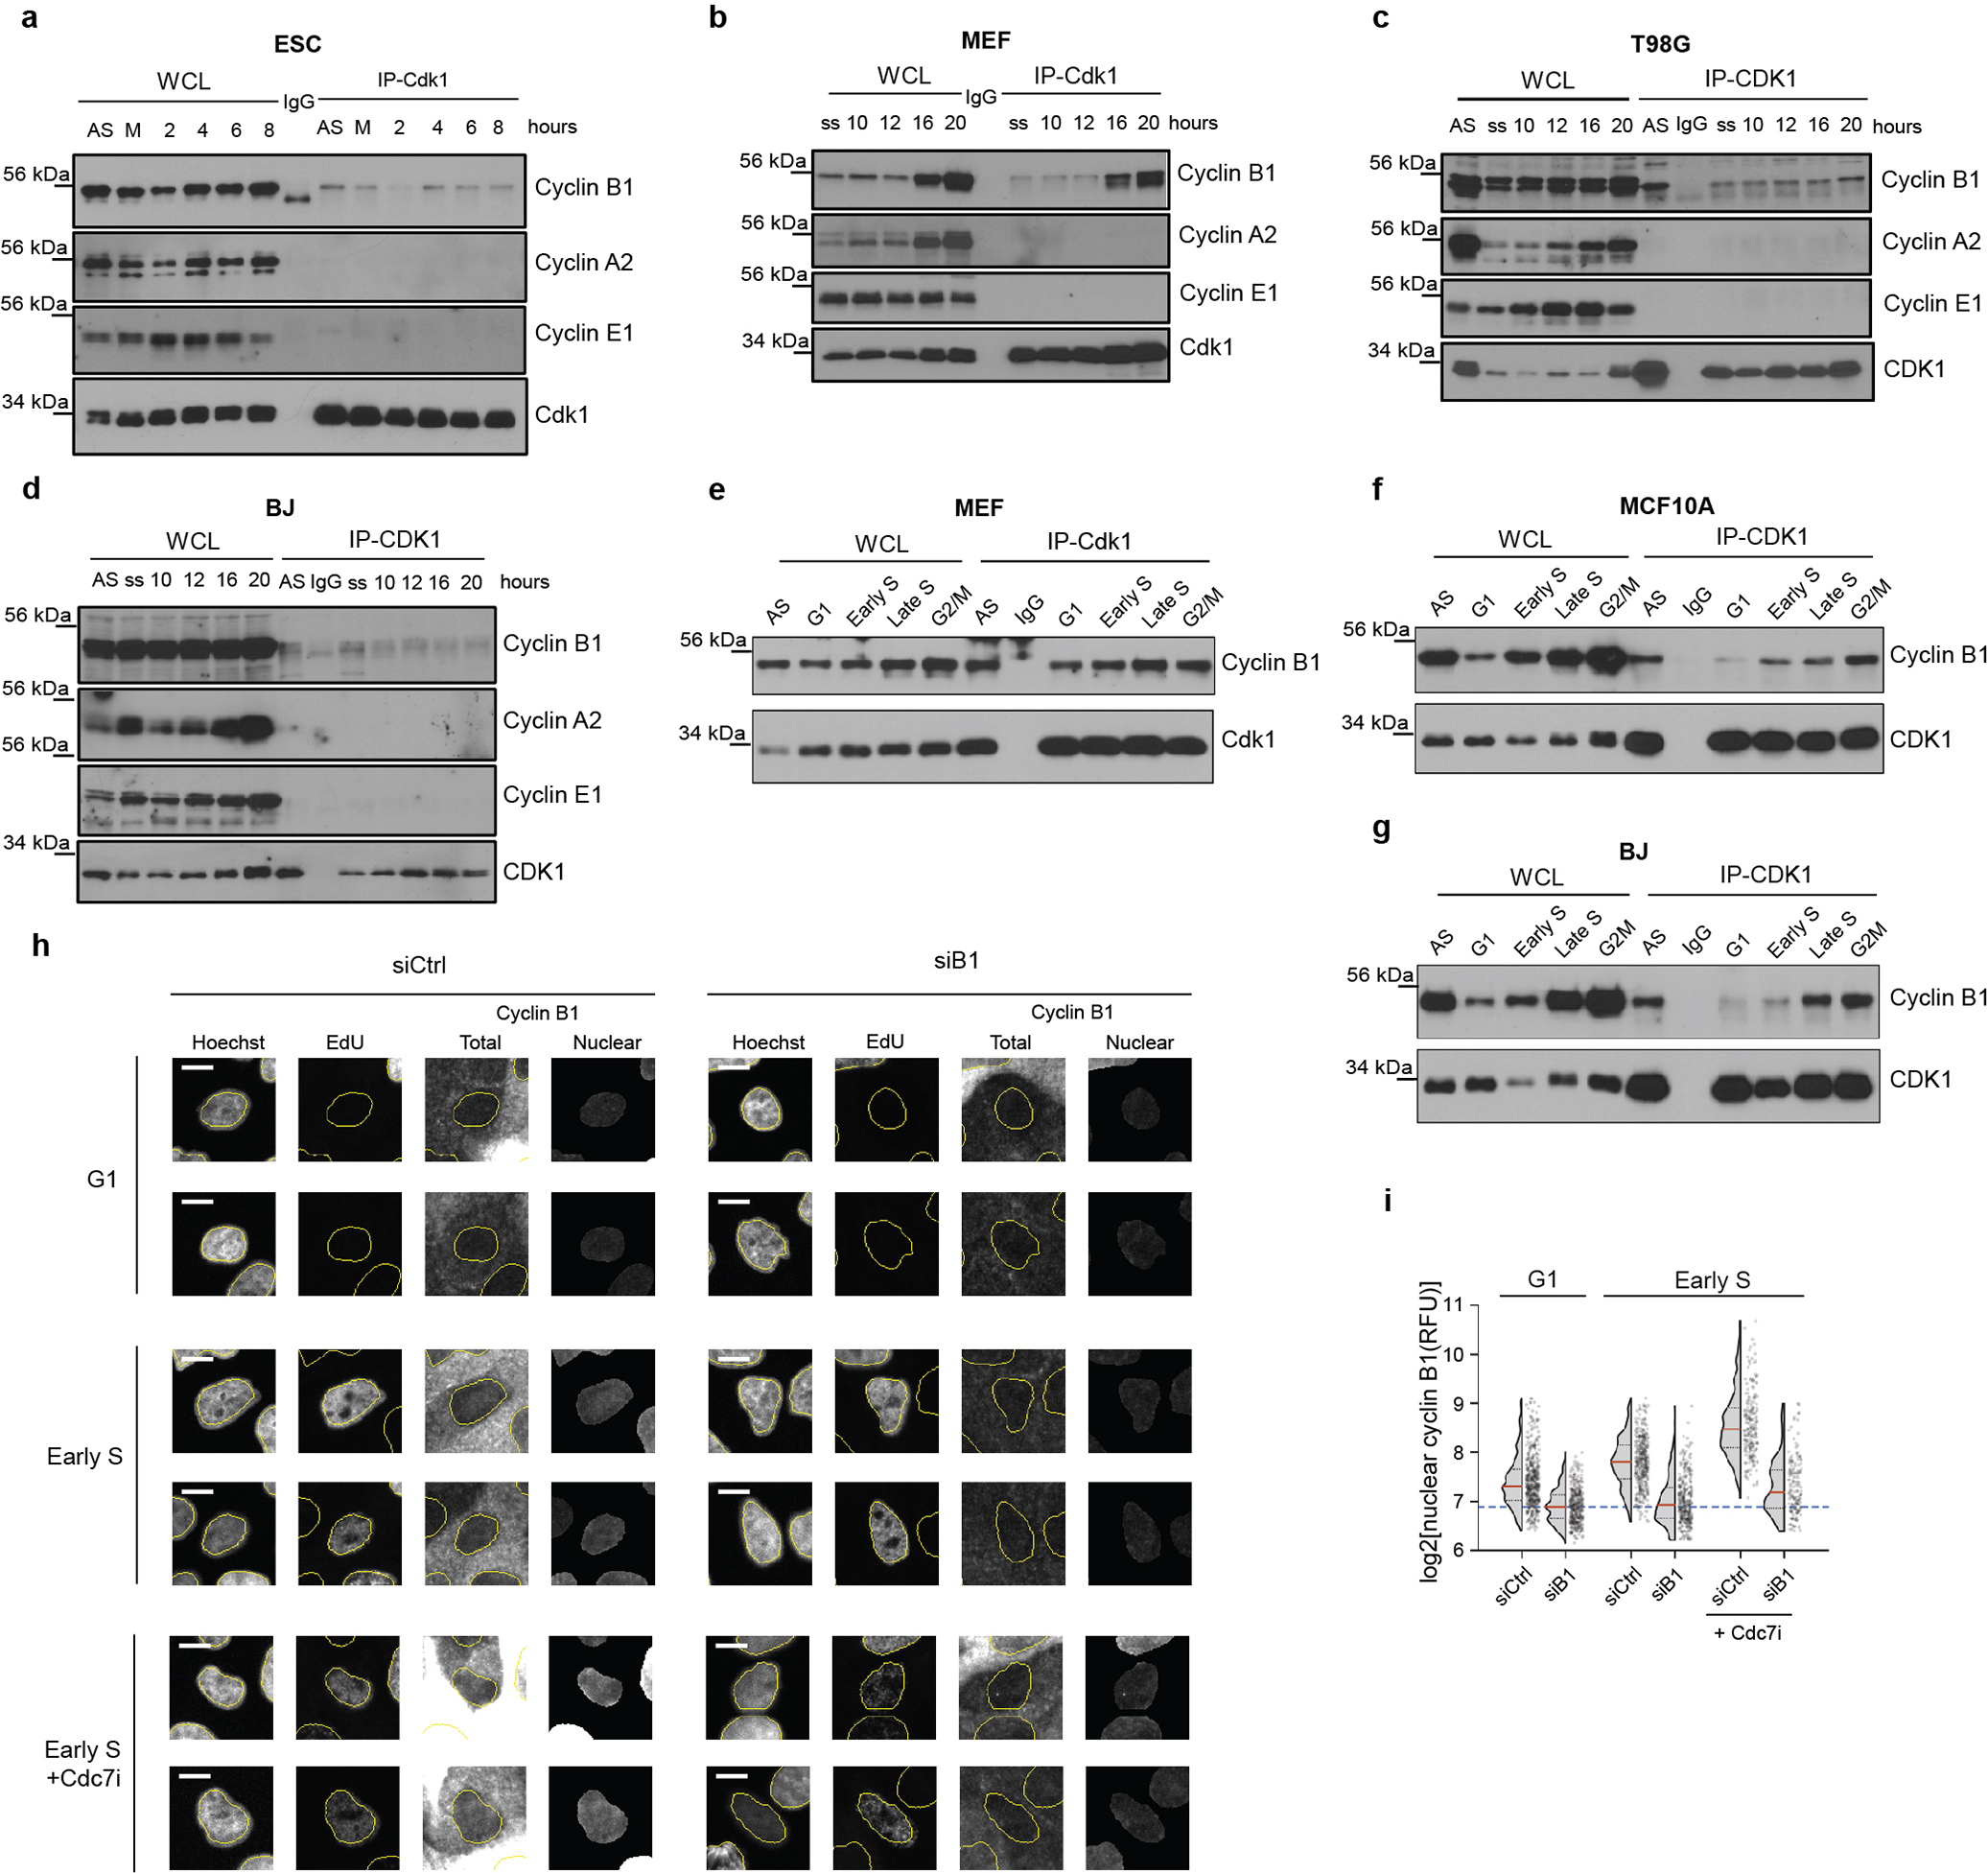
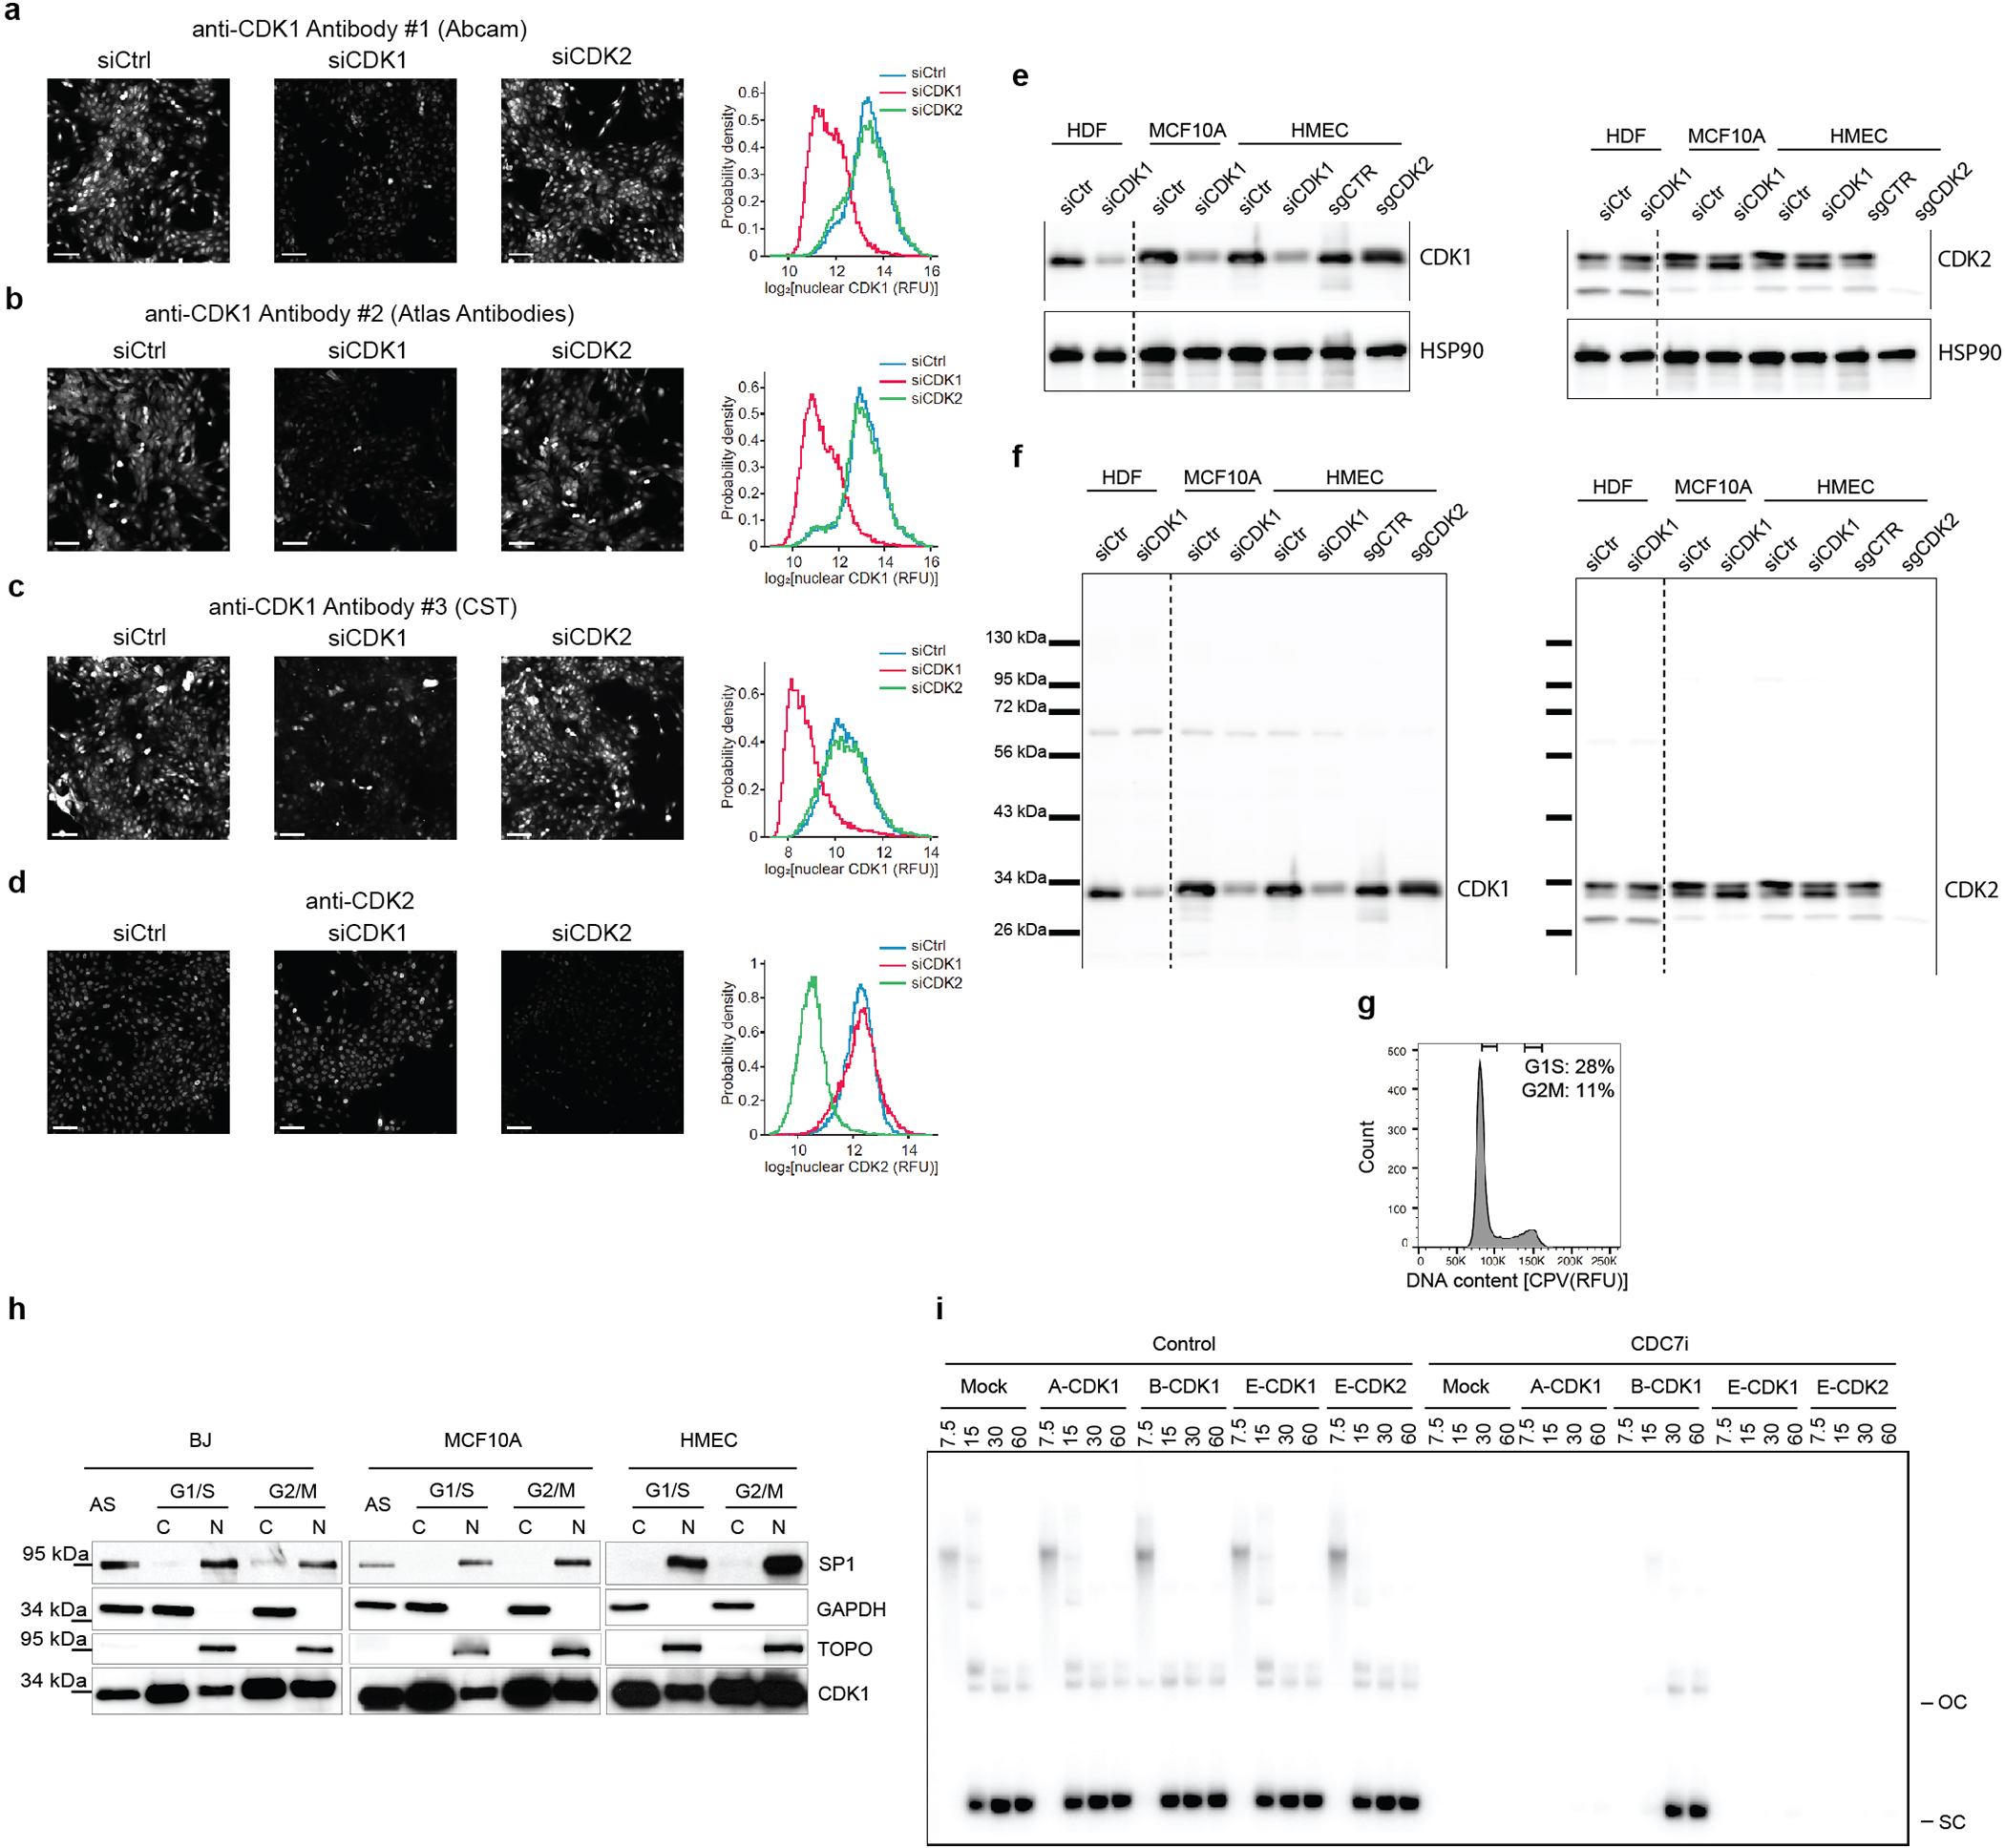
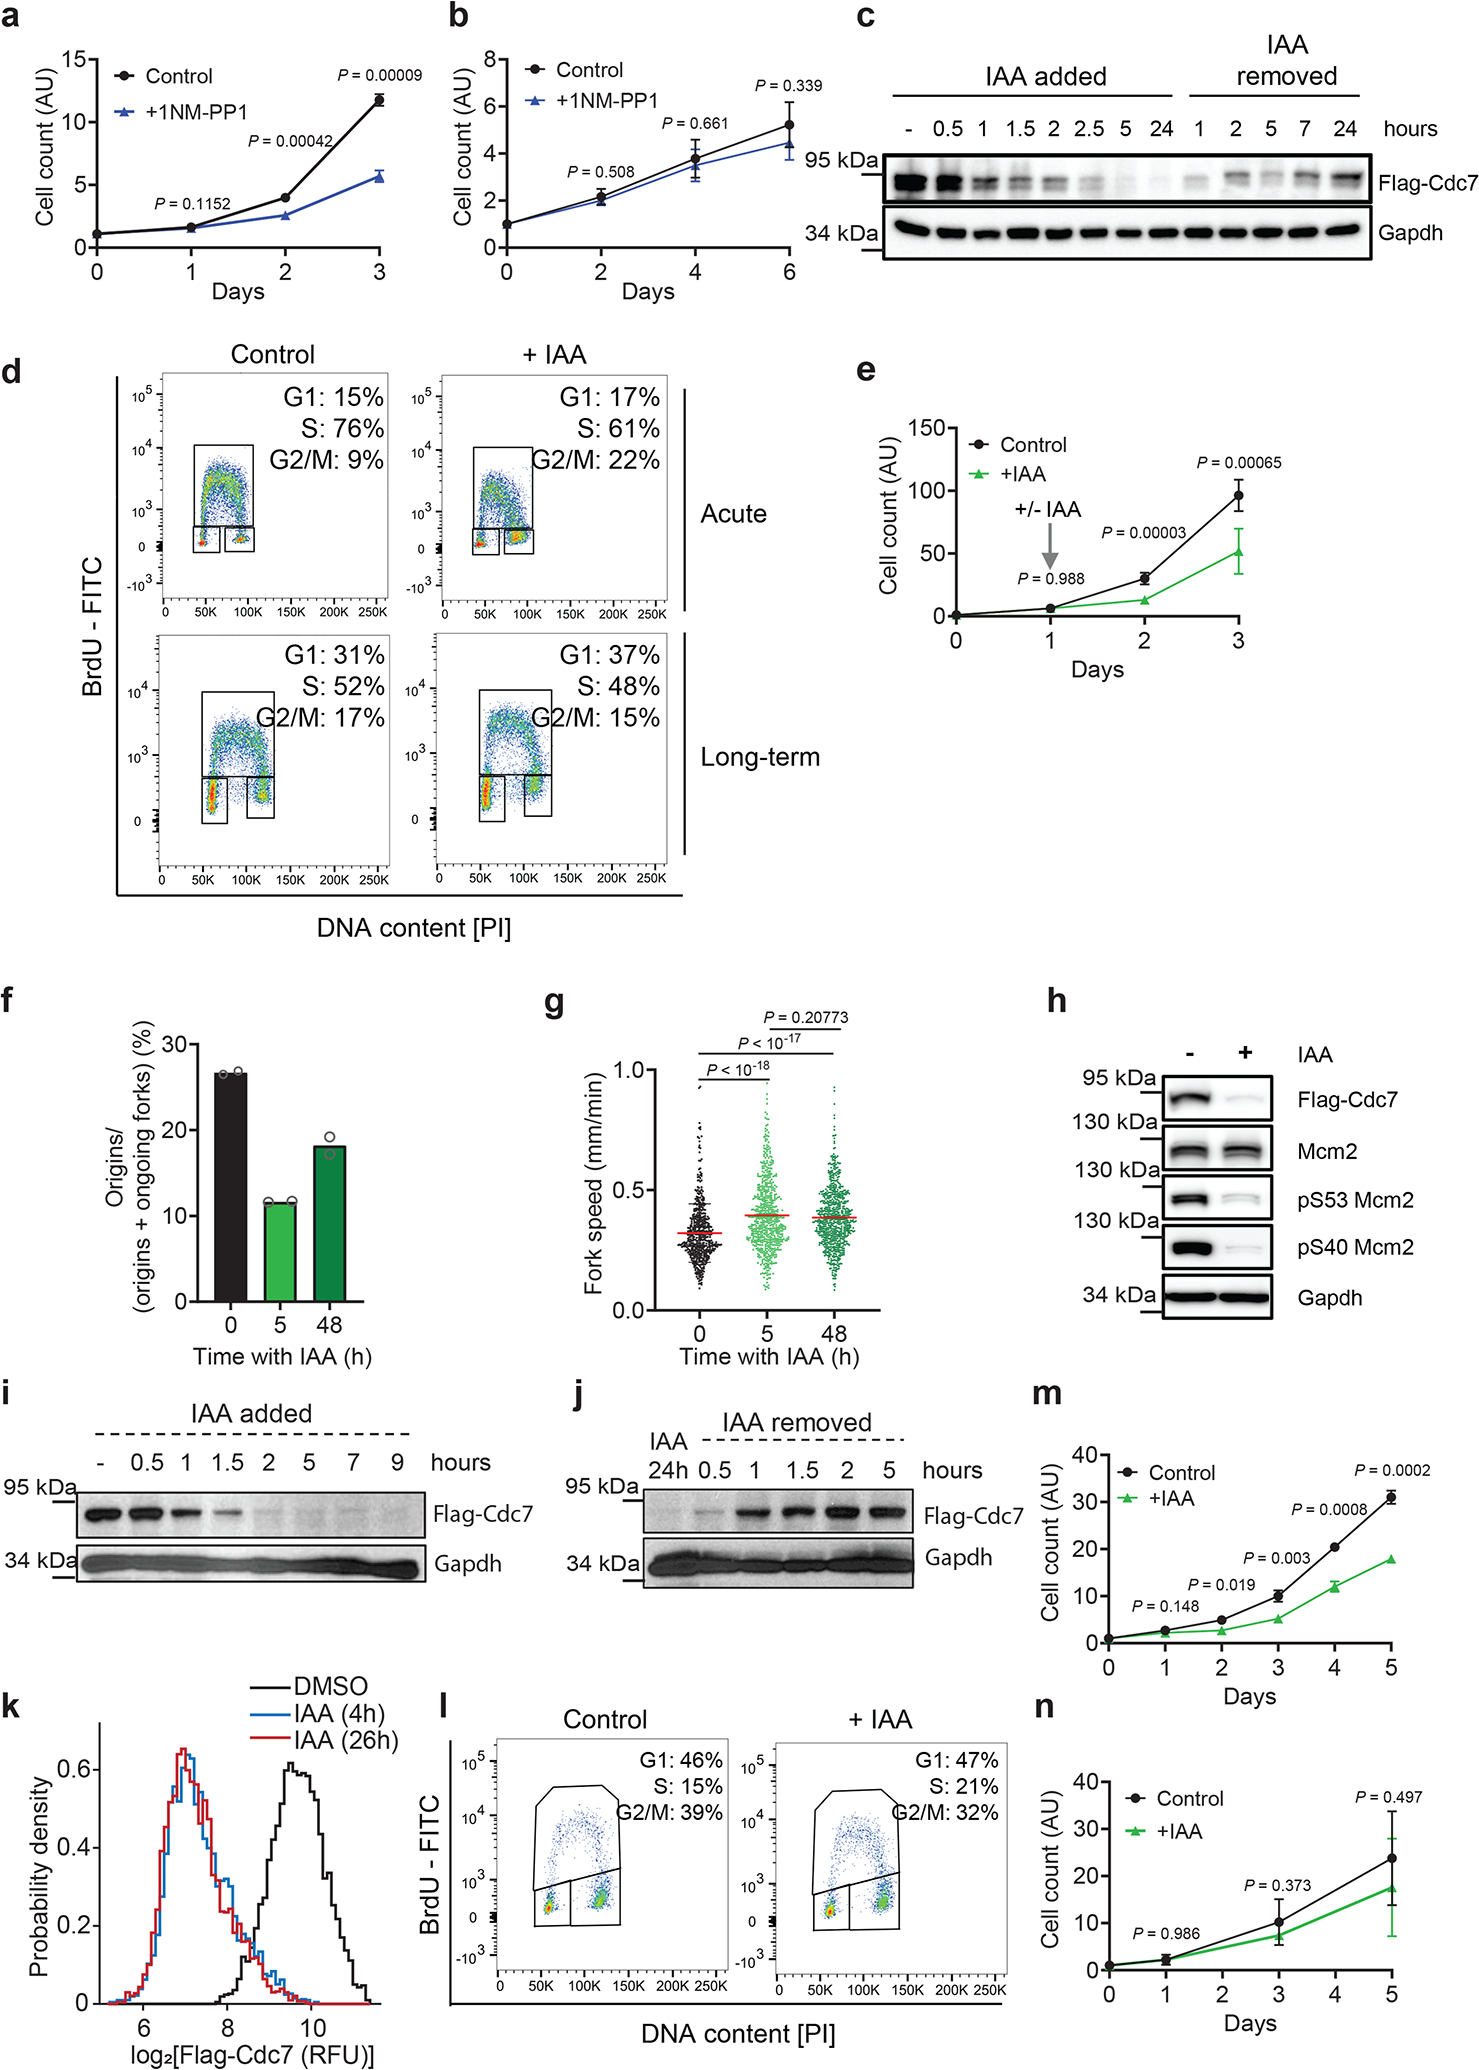
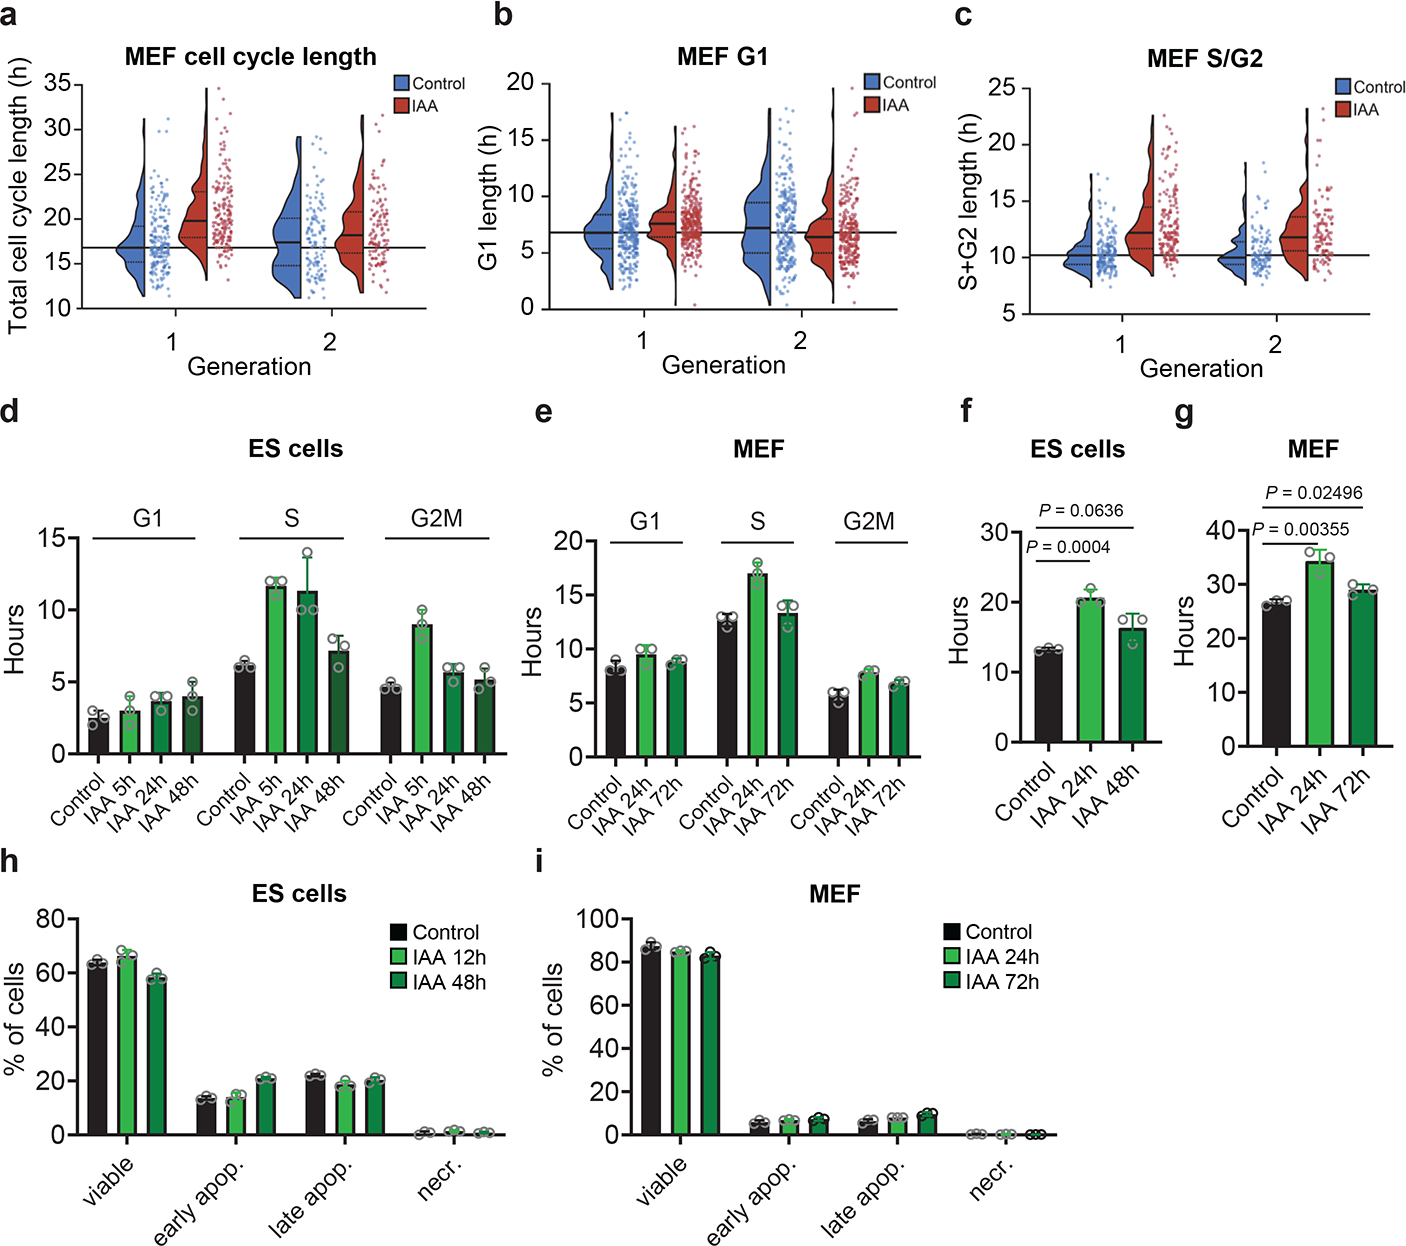
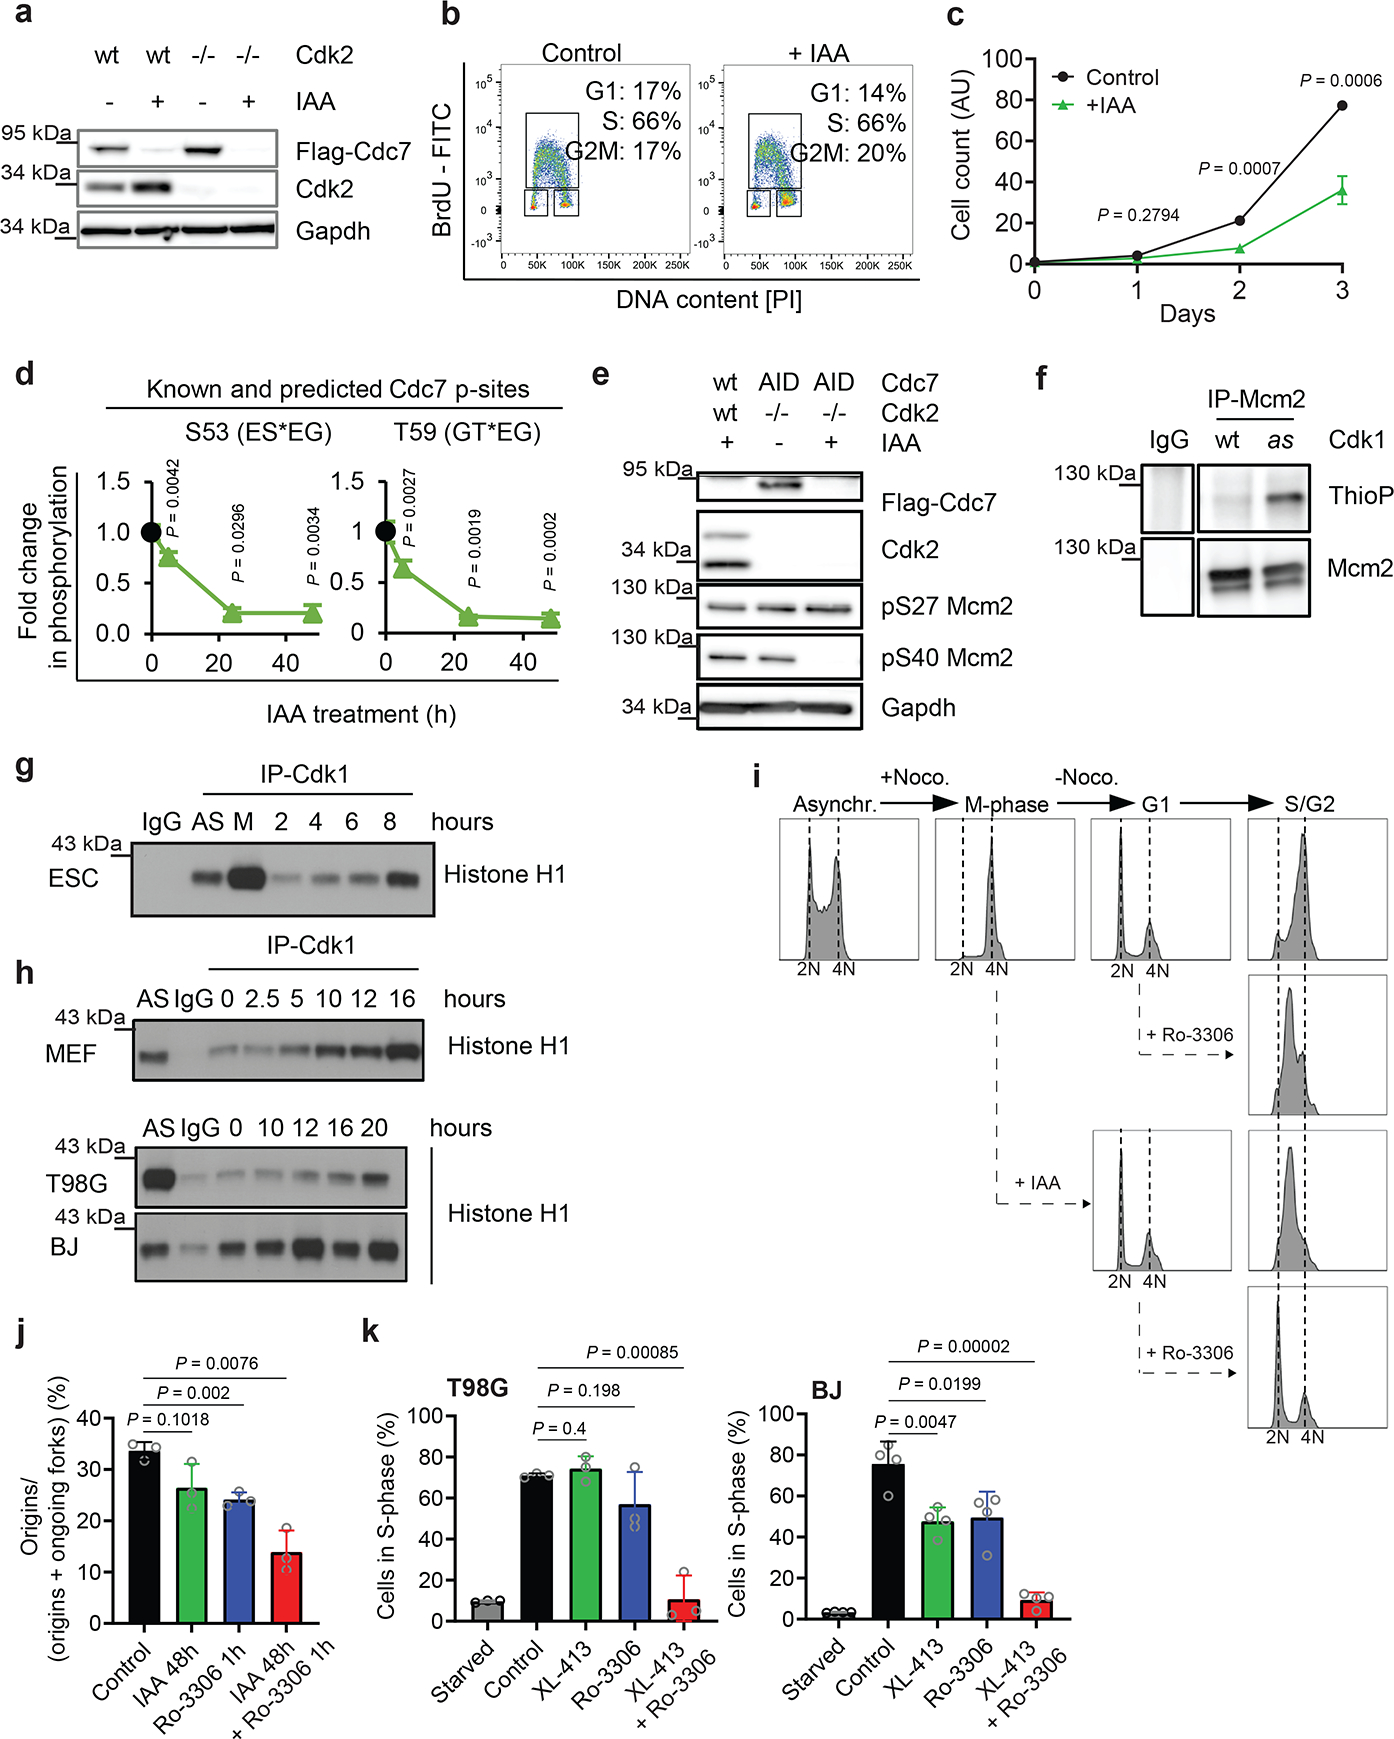
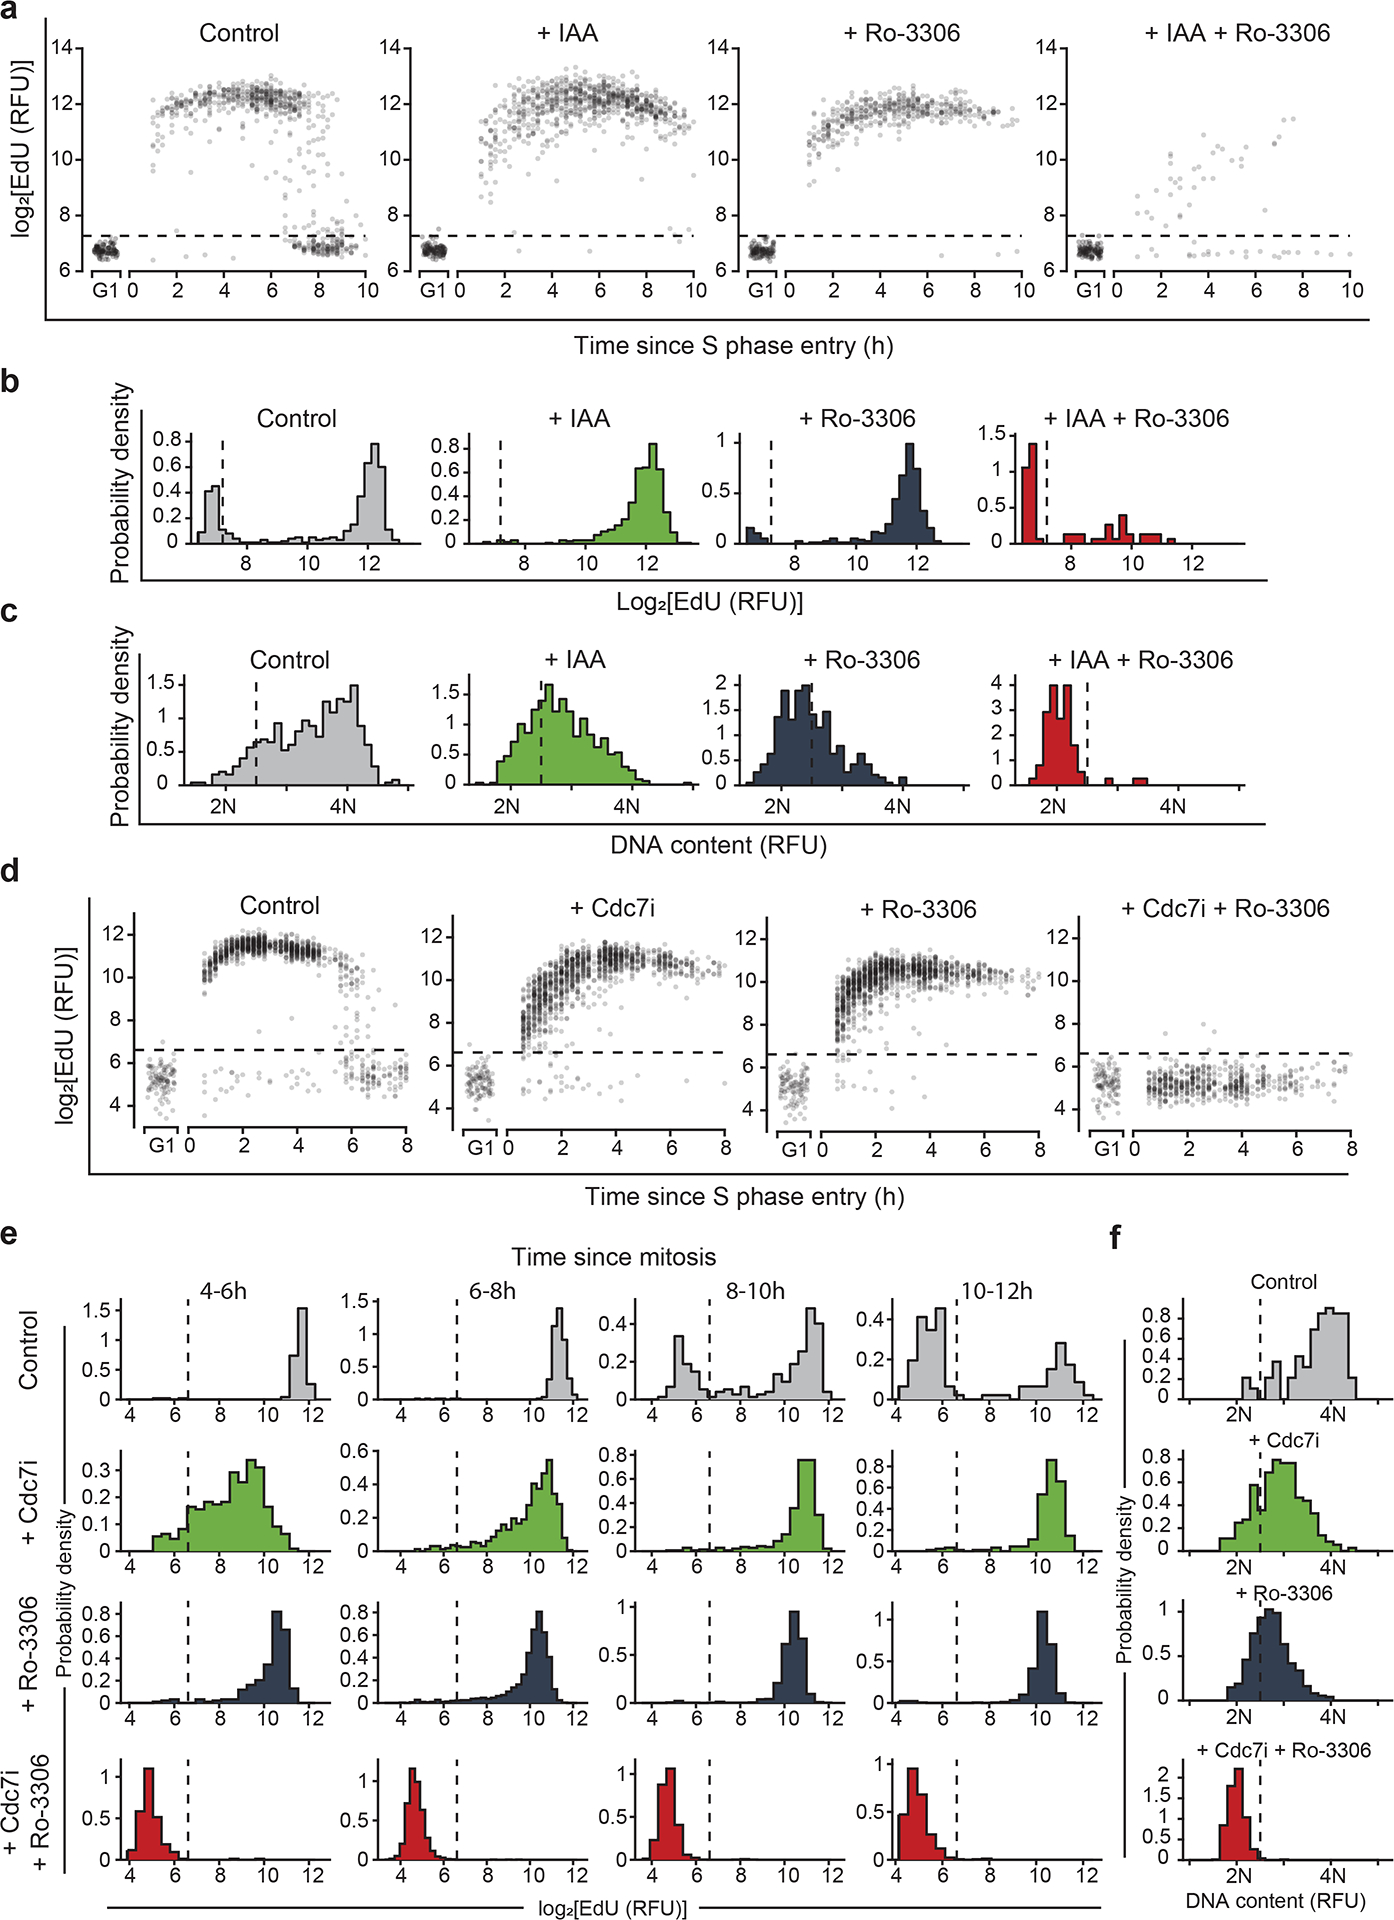
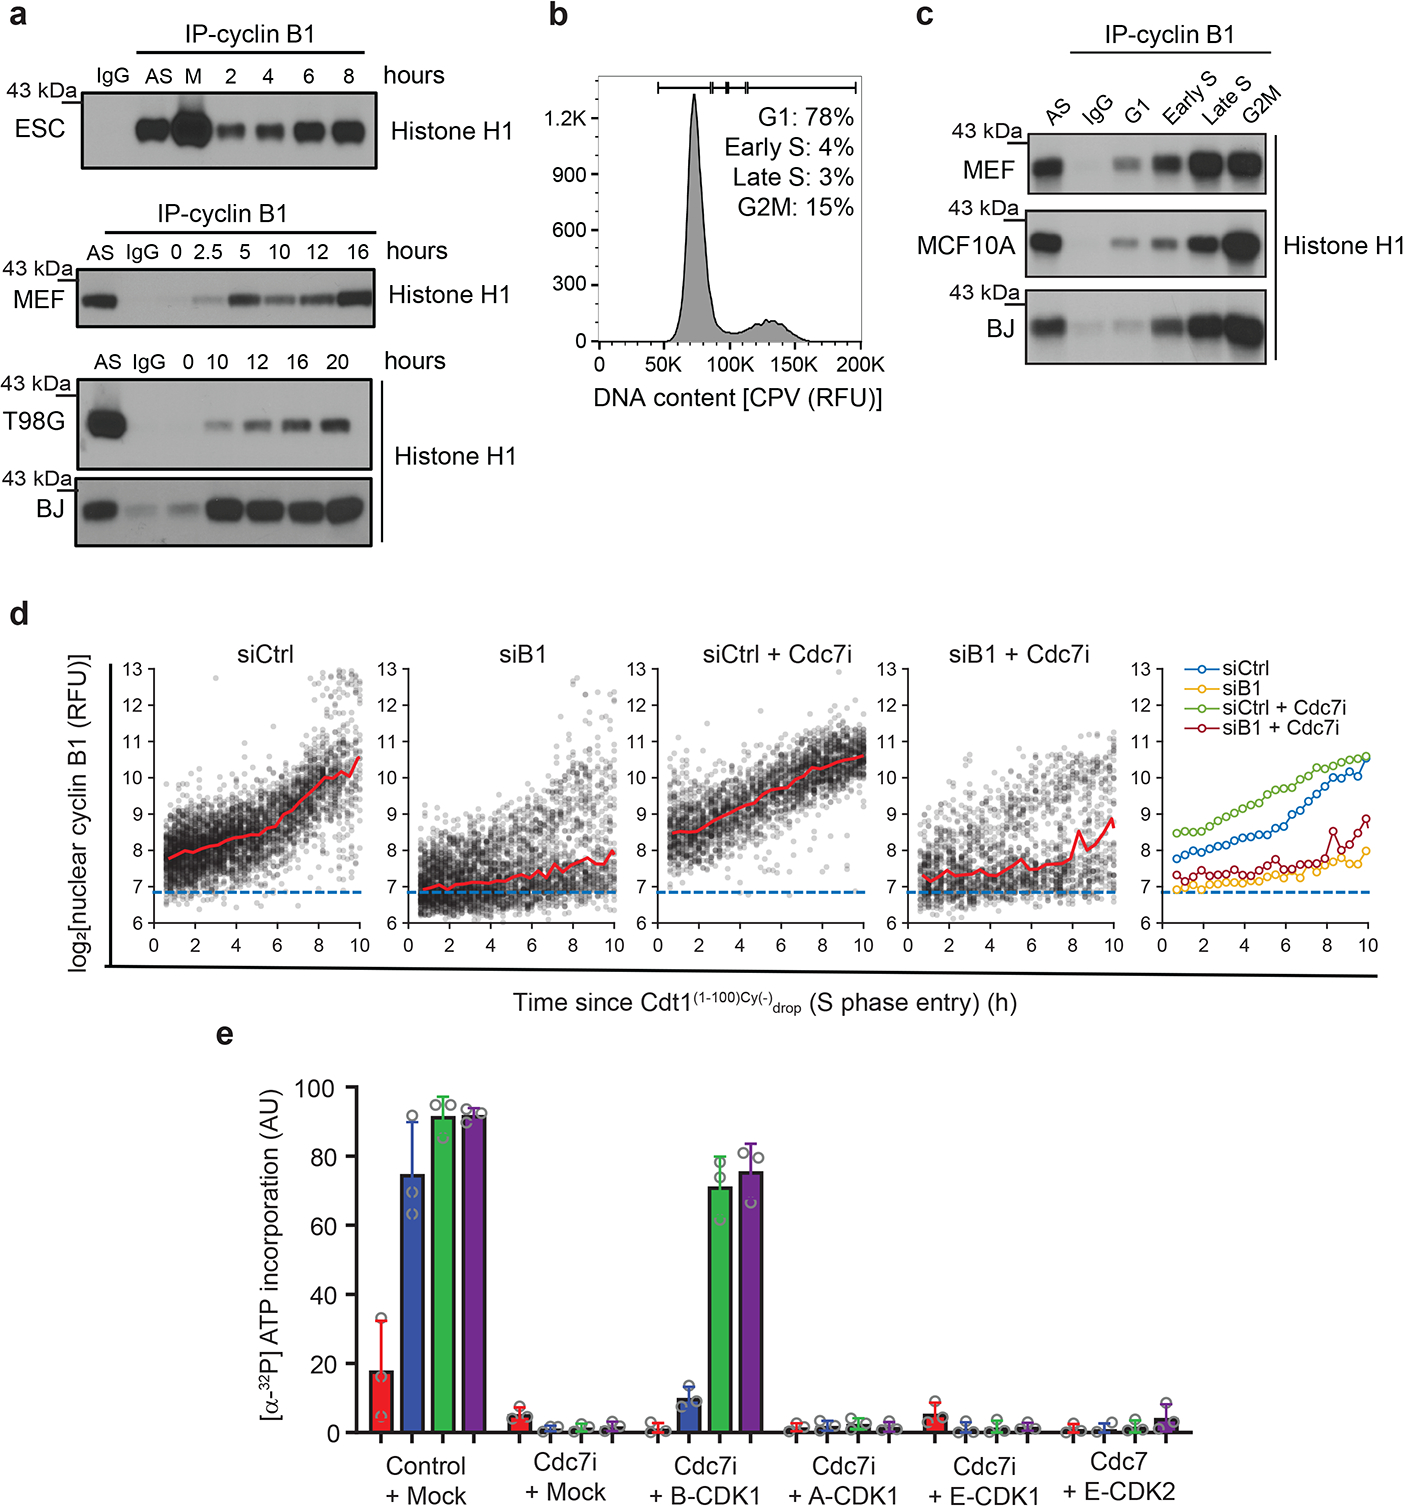
The entry of mammalian cells into the DNA synthesis phase (S phase) represents a key event in cell division1. According to current models of the cell cycle, the kinase CDC7 constitutes an essential and rate-limiting trigger of DNA replication, acting together with the cyclin-dependent kinase CDK2. Here we show that CDC7 is dispensable for cell division of many different cell types, as determined using chemical genetic systems that enable acute shutdown of CDC7 in cultured cells and in live mice. We demonstrate that another cell cycle kinase, CDK1, is also active during G1/S transition both in cycling cells and in cells exiting quiescence. We show that CDC7 and CDK1 perform functionally redundant roles during G1/S transition, and at least one of these kinases must be present to allow S-phase entry. These observations revise our understanding of cell cycle progression by demonstrating that CDK1 physiologically regulates two distinct transitions during cell division cycle, whereas CDC7 has a redundant function in DNA replication.


Conflict of interest statement

Competing interests statement. PS has been a consultant at Novartis, Genovis, Guidepoint, The Planning Shop, ORIC Pharmaceuticals, Cedilla Therapeutics, Syros Pharmaceuticals and Exo Therapeutics; his laboratory receives research funding from Novartis. JMS is currently an employee of AstraZeneca, WM of Cedilla Therapeutics.

Figures

Extended Data Fig. 1.
Extended Data Fig. 1.. Gene-targeting to generate mutant Cdc7 alleles.
a, Verification that analog-sensitive (as) Cdc7, but not wild-type Cdc7 can be potently inhibited by 1NM-PP1. 293T cells were transfected with constructs encoding Flag-tagged wild-type (wt) or as Cdc7. Cells were treated with DMSO (Vehicle) or 1NM-PP1, Cdc7 immunoprecipitated using an anti-Flag antibody and subjected to kinase reactions with [γ32P]-ATP and Mcm2 as a substrate. Immunoprecipitates were also immunoblotted with an anti-Flag antibody. b, Gene-targeting strategy to generate the Cdc7AS allele. Cdc7 exons are numbered, coding exons are in grey. M128G, as substitution; Puro, puromycin resistance cassette; 4x polyA, polyadenylation signal; red triangles, LoxP sites. c, Growth curves of Cdk1AS/AS ESC cultured in the presence of vehicle (Control) or 3MB-PP1. d, Cdk1AS/AS ESC treated as in c for 24h were stained with propidium iodide and analyzed by flow cytometry. Note that Cdk1-inhibited cells arrested in G2-phase, as expected. e, The principle of auxin-inducible degradation system. A plant hormone auxin recruits proteins containing the auxin-inducible degron (AID) domain to E3 ubiquitin ligase Cul1–Rbx1–Skp1–Tir1 (SCFTir1) for polyubiquitination and subsequent degradation by the proteasome. f, Gene-targeting strategy to knock-in the AID domain and 3xFlag-tag into the Cdc7 gene in ESC. g, Immunoblot analysis of wild-type (wt) and Cdc7AID/AID/Tir1 (AID) ESC for expression of Flag-tagged Cdc7. h, Gene-targeting strategy to knock-in the Myc-tagged Tir1 gene into Rosa 26 locus. i, Immunoblot analysis of wild-type (wt) and Tir1 knock-in ESC for expression of Myc-tagged Tir1. Gapdh was used as loading control. j, To verify the absence of truncated, untagged Cdc7 species in Cdc7AID/AID/Tir1 ESC, we prepared whole cell lysates (WCL) from these cells (lane 2), and probed immunoblots with an anti-Cdc7 antibody. In addition, we immunodepleted tagged Cdc7 from WCL using an anti-Flag antibody (IP-Flag) and probed immunoprecipitates (IP, lane 3) and supernatants (Sup, lane 4) with an anti-Cdc7 antibody. WCL from wild-type ESC were also immunoblotted (lane 1). We did not detect the presence of truncated Cdc7. k, To further exclude the presence of truncated Cdc7, we resolved WCL from Cdc7AID/AID /Tir1 ESC on an SDS-PAGE gel, cut the gel into smaller fragments corresponding to different protein sizes and evaluated the presence of Cdc7 peptides in these fractions by mass spectrometry. We detected the presence of Cdc7 only in the fraction corresponding to the full-length protein. l, Gene-targeting strategy to generate Cdc7Flox allele in ESC. Red triangles, LoxP sites. c, n=3 independent replicates; a, d, g, i, j show representative results (out of 2); c, p-values determined by two-sided t-test; error bars, SD.
Extended Data Fig. 2.
Extended Data Fig. 2.. Analyses of Cdc7AID/AID cells.
a, wild-type (Cdc7+/+) and Cdc7AID/AID/Tir1 ESC were cultured without auxin. Cells were pulsed with BrdU, stained with an anti-BrdU antibody and propidium iodide and analyzed by flow cytometry. Note normal cell cycle profile of Cdc7AID/AID/Tir1 ESC in the absence of auxin, as expected. b, Immunoblot analysis to demonstrate expression of the retinoblastoma protein, Rb1, in wild-type ESC. Whole cell lysates from MEFs and mouse breast cancer cell lines (4TD8, EMT6, 4T1) were immunoblotted for control. c, Cdc7+/+ and Cdc7AID/AID/Tir1 ESC were cultured on feeders with auxin (IAA) or vehicle (Control) for 72 h and stained for alkaline phosphatase, a marker of undifferentiated pluripotent stem cells. Scale bar, 500 μm. Inserts, higher magnification of colonies. Inhibition of Cdc7 did not decrease alkaline phosphatase staining, suggesting that Cdc7 is not required to maintain pluripotency. d, Cdc7 protein levels in Cdc7AID/AID/Tir1 ESC cultured with auxin for the indicated times. Immunoblots of whole cell lysates were probed with an anti-Flag antibody to detect Flag-tagged endogenous Cdc7. Efficient degradation of Cdc7 was maintained after 1 month of continuous culture with auxin. e, Immunostaining of Cdc7AID/AID/Tir1 MEFs for expression of Cdc7. Cells were cultured with vehicle or auxin for 4 h, and stained with an anti-Flag antibody. Nuclei were counterstained with Hoechst. Note the loss Cdc7 staining after addition of auxin. See Fig. 1k for quantification. a-e, representative results (out of 2).
Extended Data Fig. 3.
Extended Data Fig. 3.. Analyses of CDC7-inhibited cells.
a-f, Long-term live-cell imaging. MCF10A cells expressing Gem(1–110)-mVenus and Cdt1(1–100)Cy(−)-mCherry FUCCI(CA) reporters were cultured and imaged for a total of 77 h. 8 h after imaging start, CDC7 inhibitor, TAK-931, was added to the culture medium, and cells were imaged for an additional 69 h. Shown are parameters for the first three cell cycles after addition of TAK-931 (generations 1–3, selecting cells which received TAK-931 0–2 h after mitosis). a, Total cell cycle length (time between two mitoses). b, G1 length (time between mitosis and Cdt1(1–100)Cy(−)drop [S phase start]). c, Shown is the subset of G1 cells from b, with G1 phase lasting less than 16 h. d, S/G2 length (time from Cdt1(1–100)Cy(−)drop [S phase start]) to subsequent mitosis. e, S phase length (time from Cdt1(1–100)Cy(−)drop [S phase start] to Cdt1(1–100)Cy(−)rise [S phase end]). f, G2 length (time from Cdt1(1–100)Cy(−)rise [S phase end]) to subsequent mitosis). In a-f, dots show values for individual cells; thin horizonal lines, median values; dotted lines above and below median, inter-quartile range; long horizonal lines, median values from control cells in generation 1. g, h, The length of G1, S and G2/M as determined by pulse-chase analysis in MCF10A (g) and HMEC human mammary epithelial cells (h) treated for the indicated times with CDC7 inhibitor, XL-413. Control, the length of cell cycle phases in untreated cells. i, j, Doubling times of MCF10A (i) and HMEC cells (j) treated for the indicated times with XL-413, determined by pulse-chase analysis. Control, untreated cells. k-n, human BJ foreskin fibroblasts (k), HMEC (l), human primary dermal fibroblasts (m), and MCF10A cells (n) were treated for the indicated times with XL-413, stained with Annexin V and propidium iodide (PI) and analyzed by flow cytometry. Shown are percentages of viable (Annexin V/PI), early apoptotic (Annexin V+/PI), late apoptotic (Annexin V+/PI+) and necrotic (Annexin V/PI+) cells. Control, untreated cells. o, p, mean numbers of γH2AX foci/cell in Cdc7AID/AID/Tir1 ESC (o) and MEFs (p) cultured for the indicates times with auxin. Control, untreated cells. q, similar analysis for Cdc7AID/AID/Tir1 ESC cultured with auxin for 7 weeks. r, Cdc7AID/AID/Tir1 MEFs were treated with vehicle (−) or auxin for the indicated times. Lysates were immunoblotted with antibodies recognizing Chk1, p53, Kap1 (Trim28), phospho-Kap1 (serine 824), phospho-Chk1 (serine 317) and phospho-Chk1 (serine 345). Gapdh was used as loading control. g-q, show mean values; i, j, o-q, p-values determined by two-sided t-test; error bars, SD. g-n, n=3 independent replicates; a-f, n=2 independent replicates, o-q, data of n > 60 cells from at least 5 independent fields per experimental condition, r, representative results (out of 2).
Extended Data Fig. 4.
Extended Data Fig. 4.. Knockout of Cdc7.
a-c, CRISPR/Cas9-mediated knockout of Cdc7 in primary mouse fibroblasts (MEFs). Cdc7AID/AID/Tir1 MEFs were transduced with viruses encoding control sgRNA (sgCTR) or anti-Cdc7 sgRNA (sgCdc7). a, Whole cell lysates were immunoblotted and probed with an anti-Flag antibody to detect Flag-tagged endogenous Cdc7. Day 0, cells at the end of selection; Day 5, cells after 5 days of culture. b, Cell cycle analysis of cells from a. Cells were pulsed with BrdU, stained with an anti-BrdU antibody and propidium iodide and analyzed by flow cytometry. c, Doubling times. d-f, CRISPR/Cas9-mediated knockout of Cdc7 in MEFs immortalized by dominant-negative p53. d, Immunoblotting as in a. Polyclonal, total polyclonal cell population after transduction with sgRNAs; selected, further purified population containing over 90% of Cdc7 frame-shift alleles. e, cell cycle analysis (polyclonal population), f, doubling times (polyclonal population). g, h CRISPR/Cas9-mediated knockout of Cdc7 in keratinocytes; g, immunoblotting, h, doubling time. i-j, CRISPR/Cas9-mediated knockout of CDC7 in human BJ foreskin fibroblasts. i, Immunoblotting with anti-CDC7 antibody, j, Cell cycle analysis. k-p, Acute ablation of Cdc7 in ESC. Cdc7Flox/Flox (Cdc7F/F) and Cdc7+/+ ESC were engineered to stably express dominant-negative p53 (to prevent p53-dependent cell death upon shutdown of Cdc733). Cells were transduced with lentiviruses encoding Cre-recombinase, or mock transduced. k, Cells were harvested at days 2 and 3, and extracts immunoblotted with an anti-Cdc7 antibody. l, m, at day 3, cells were stained with propidium iodide (l), or pulsed with BrdU and stained with propidium iodide and an anti-BrdU antibody (m) and analyzed by flow cytometry. n, Cells were cultured in the presence of BrdU for 15 h, stained with an anti-BrdU antibody and the percentage of BrdU+ cells was evaluated by flow cytometry. Note that 98% of Cdc7-deleted cells (and the same fraction of Cdc7+/+ cells) incorporated BrdU, indicating active DNA synthesis. FSC, forward scatter. o, Cells were stained with Annexin V and propidium iodide (PI) and analyzed by flow cytometry. Shown are percentages of viable (Annexin V/PI), early apoptotic (Annexin V+/PI), late apoptotic (Annexin V+/PI+) and necrotic (Annexin V/PI+) cells. p, Cdk1 was immunoprecipitated (IP-Cdk1) from cells and used for kinase reactions with [γ32P]-ATP and histone H1 as a substrate. IgG, control immunoprecipitation with IgG. Note that ablation of Cdc7 resulted in modestly elevated levels of Cdk1 kinase - like an acute degradation of Cdc7 in Cdc7AID/AID/Tir1 ESC (Extended Data Fig. 7b). a, g, i, k, Gapdh was used as loading control. c, f, o, show means; p-values by two-sided t-test; error bars, SD; n=3 independent replicates; other panels show representative results (out of 2).
Extended Data Fig. 5.
Extended Data Fig. 5.. Studies of Cdc7-Dbf4 in cells, and in vivo analyses using Cdc7AID/AID/Tir1 mice.
a, Analysis of cultured cardiomyocytes isolated from two independent litters of Cdc7AID/AID/Tir1 embryos (Cardio. #1 and #2) for expression of Cdc7. Whole cell lysates were immunoblotted and probed with an anti-Flag antibody to detect Flag-tagged endogenous Cdc7. MEFs served as a positive control. Note that cardiomyocytes do not express appreciable levels of Cdc7, despite active proliferation. b, Cell cycle analysis. Cells were pulsed with BrdU, stained with an anti-BrdU antibody and propidium iodide and analyzed by flow cytometry. c-g, CRISPR/Cas9-mediated knockout of Dbf4 in MEFs immortalized by dominant-negative p53. c, Results of DNA sequencing of the Dbf4 alleles in cells transduced with viruses encoding control sgRNA (sgCTR) or anti-Dbf4 sgRNA (sgDbf4). Shown is percentage of wild-type Dbf4 alleles in cell populations. d, Cell cycle analysis as in b. e, Distribution of cell cycle phases (from d). f, Doubling times; g, growth curves. h-o, In vivo analyses using Cdc7AID/AID/Tir1 mice. h, i, Analysis of Cdc7 protein levels in the indicated organs of Cdc7AID/AID/Tir1 mice. Lysates were immunoblotted and probed with an anti-Flag antibody to detect Flag-tagged endogenous Cdc7. In i, the immunoblot was overexposed to illustrate undetectable levels of Cdc7 in bone marrow. Note that except for testes and thymi, Cdc7 is expressed at very low levels. j, A similar analysis as in h, using organs from Cdc7AID/AID Tir1-negative mice. k, The levels of Cdc7 protein in the indicated mouse organs after treatment of the animals with auxin for 12 h. l, This panel illustrates the efficiency of two routes of auxin administration: a single intraperitoneal injection (IP inj.) or a single oral gavage (Gavage). Mice received auxin via the indicated routes and thymi collected at the indicated time-points for immunoblot analysis. Each of these routes resulted in an efficient Cdc7 degradation that lasted approximately 12 h. m, The levels of Cdc7 protein in thymi and testes of four Cdc7AID/AID/Tir1 mice (#1 to #4) treated with auxin for 8 days. Control, a mouse treated with vehicle for 8 days. n, After 8 days of auxin treatment, Cdc7AID/AID/Tir1 mice were injected with BrdU and sections stained with an anti-BrdU antibody. Control, a mouse treated for 8 days with vehicle, –BrdU, staining of sections from a mouse not injected with BrdU. Scale bars, 100 μm. o, Sections of organs from Cdc7AID/AID/Tir1 mice treated with auxin for 4 days were stained with an anti-Ki67 antibody (to detect proliferating cells). Scale bars, 100 μm. Gapdh and β-actin were used as loading controls; i, j, show Ponceau S-stained membrane. e-g show means; p-values by two-sided t-test; error bars, SD. e, n=3; f, g, n=6, a-d, h-l representative results (out of 2); m, n=4 n, o, representative images (of at least 5 independent fields).
Extended Data Fig. 6.
Extended Data Fig. 6.. Analyses of human CDK2-deficient cells.
a-d, Analyses of CDK2-knockout human mammary epithelial MCF10A cells. a, Whole cell lysates from parental (Control) and CDK2-knockout (sgCDK2) MCF10A cells were immunoblotted and probed with an anti-CDK2 antibody. b, CDK2+/+ and CDK2-knockout (sgCDK2) MCF10A cells were cultured in the absence (Control) or presence of CDC7 inhibitor (XL-413) for 12 h. Cells were pulsed with BrdU, stained with an anti-BrdU antibody and propidium iodide and analyzed by flow cytometry. c, Parental and CDK2-knockout (sgCDK2) MCF10A cells were arrested in G0 by growth factor deprivation (Starved) and stimulated to re-enter the cell cycle by addition of growth factors (Released). Cells were pulsed with BrdU after 19 h, stained with propidium iodide and anti-BrdU antibody and analyzed by flow cytometry. d, CDK2-knockout MCF10A cells were arrested in G0 (Starved) and stimulated (as in c), in the presence of vehicle (Control), XL-413, CDK1 inhibitor (Ro-3306), or both inhibitors and analyzed as in c. e-g, CDK2-knockout human mammary epithelial HMEC cells. e, Whole cell lysates from parental and CDK2-knockout (sgCDK2) HMEC cells were immunoblotted as in a. f, Asynchronously growing CDK2+/+ and CDK2-knockout HMEC cells were analyzed as in b. g, CDK2-knockout HMEC cells were arrested in G0 (Starved), stimulated to re-enter cell cycle in the presence of inhibitors and analyzed as in d. h-l, Analyses of human BJ foreskin fibroblasts expressing analog-sensitive (as) CDK2 in place of the endogenous CDK2. h, Immunoblots of whole cell lysates of parental and CDK2-knockout cells expressing asCDK2 (asCDK2) probed with an anti-CDK2 antibody. asCDK2 migrates slower due to the presence of 3xFlag-tag. i, Growth curves of asCDK2 cells treated with vehicle (Control) or 3MB-PP1 (to inhibit asCDK2). j, asCDK2 BJ fibroblasts were cultured with XL-413, 3MB-PP1, or both and analyzed as in b. k, l, asCDK2 cells were arrested in G0 (Starved) and stimulated with serum in the presence of vehicle, 3MB-PP1, XL-413, or both inhibitors. Cells were analyzed as in d. m-q, Analyses of human mammary epithelial MCF10A cells expressing analog-sensitive CDK2 (asCDK2). m, Immunoblotting as in h. n, Growth curves as in i. o, Analyses of asynchronously growing cells, as in j. p, q, analyses of cell cycle re-entry as in k, l. r-v, Analyses of human mammary epithelial HMEC cells expressing analog-sensitive CDK2 (asCDK2). r, Immunoblotting; s, growth curves (as in i); t, analyses of asynchronous cells (as in j); u, v, analyses of cell cycle re-entry (as in k, l). GAPDH was used as loading control. c, d, g, i, k, l, n, p, q, s, u, v show mean values; p-values by two-sided t-test; error bars, SD. c, d, g, i, k, l, n, p, q, s, u, v, n=3 independent replicates; panels a, b, e, f, h, j, m, o, p, r, t, show representative results (out of 2).
Extended Data Fig. 7.
Extended Data Fig. 7.. Analyses of Cdc7-deficient cells.
a, Quantification of Cdk1 phosphorylation on threonine-161 (T161) and threonine-15 (T15), using mass spectrometry. Cdc7AID/AID/Tir1 ESC were treated with auxin and analyzed after 5, 24 and 48 h. Black dots, phosphorylation levels at time 0. b, Cdk1 was immunoprecipitated (IP-Cdk1) from Cdc7AID/AID/Tir1 ESC treated with auxin or vehicle (−) for 24 h, and used for kinase reactions with [γ32P]-ATP and histone H1 as a substrate. IgG, control immunoprecipitation. c, Recombinant Mcm2 was phosphorylated in vitro with recombinant CDK1-cyclin B1 or CDC7-DBF4 and incorporation of phosphate into serine-27 quantified by mass spectrometry. d, Cdk1AS/AS ESC were treated with 3MB-PP1 for 24 h and phosphorylation of the endogenous Mcm2 on serine-27 quantified by mass spectrometry. e, Wild-type ESC were arrested in mitosis by nocodazole, and released. At the indicated time-points after the release, cells were stained with propidium iodide and analyzed by flow cytometry. Asynchronous, asynchronously growing cells; M-phase, cells arrested in mitosis. f, In-cell phosphorylation of Mcm2 by Cdk1 during early S phase. Cdk1AS/AS (as) and wild-type (wt) ESC were synchronized in mitosis with nocodazole and released. 4 h after the release, cells were provided for 20 min with bulky ATPγS-analog, N6-furfuryl-ATPγS, to label Cdk1 substrates. Mcm2 was immunoprecipitated (IP-Mcm2) and immunoblots probed with an anti-thiophosphate ester antibody (ThioP) to detect thio-phosphorylation of Mcm2, and with anti-Mcm2 antibody. IgG, control, immunoprecipitation from Cdk1AS/AS cells. Note the absence of signal for thio-phosphorylated Mcm2 in wild-type ESC cells, as expected. Shown is analysis of two independent cultures. g, MEFs, human glioblastoma T98G cells and BJ foreskin fibroblasts were arrested in G0 by serum starvation, and stimulated to enter the cell cycle by serum addition. At the indicated time-points after stimulation, cells were stained with propidium iodide and analyzed by flow cytometry. SS, serum starved cells. h, Asynchronously growing Cdk2-knockout/Cdc7AID/AID/Tir1 ESC (Asynchr.) were synchronized in mitosis by nocodazole (M-phase) and released (−Noco). Upon release, Cdc7 degradation was induced by auxin (IAA) addition to account for degradation time. Two h later, when cells reached G1 phase (G1), they were treated with Cdk1 inhibitor (Ro-3306). Cells were cultured in the presence of inhibitor(s), collected after 15 h (S/G2), stained with propidium iodide and analyzed by flow cytometry along with asynchronous, M phase and G1 phase cells. Upper row, vehicle-treated cells; second, cells treated with Ro-3306; third, auxin treatment; fourth row, treatment with auxin plus Ro-3306. i, Asynchronously growing Cdk1AS/AS ESC (Asynchr.) were synchronized in mitosis by nocodazole (M-phase) and released (−Noco). Two h later, when cells reached G1 phase (G1), they were treated with 3MB-PP1 (to inhibit Cdk1) and/or with XL-413 (Cdc7 inhibitor). Cells were cultured in the presence of inhibitor(s), collected after 12 h (S/G2) and analyzed as in h. Upper row, cells treated with vehicle; second, cells treated with 3MB-PP1; third, XL-413 treatment; fourth, treatment with 3MB-PP1 plus XL-413. j, Asynchronously growing Cdk1AS/AS ESC were treated with XL413 for 48 h and/or with 3MB-PP1 for the last 1 h, or with vehicle (Control), and subjected to DNA fiber analysis. Shown is the percentage of new replication origins, over the total number of forks analyzed. k, l, T98G cells were synchronized in M phase by nocodazole, released and treated in G1 phase with vehicle, XL-413, Ro-3306, or with both inhibitors, as in panels h, i. After 9 h of culture with inhibitor(s), cells were pulsed with BrdU, stained with an anti-BrdU antibody and propidium iodide and analyzed by flow cytometry (k). l, Mean percentage of S phase cells (from k). m-o, Human mammary epithelial MCF10A cells (m), mammary epithelial HMEC cells (n), and primary dermal fibroblasts (o) were arrested in G0 by growth factor deprivation and stimulated to re-enter the cell cycle by addition of growth factors in the presence of vehicle, XL-413, Ro-3306, or both inhibitors. Cells were pulsed with BrdU after 19 h, stained with propidium iodide and an anti-BrdU antibody and analyzed by flow cytometry along with serum-starved, G0 cells. a, d, j, l-o show mean values; p-values using two-sided t-test; Error bars, SD. a, d, j, l-o, n=3 independent replicates, b, e, g, h, i, k, representative results (out of 2).
Extended Data Fig. 8.
a, Cdc7AID/AID/Tir1 ESC (upper panel) or Cdk1AS/AS ESC (lower panel) were synchronized in mitosis by nocodazole and released as in Fig. 3i and Extended Data Fig. 7h, i. Two hours after the release, Cdc7AID/AID/Tir1 ESC were treated for 2 h with vehicle (Control), auxin (IAA), Cdk1 inhibitor Ro-3306, or with both compounds. Cdk1AS/AS ESC were treated for 2 h with vehicle, Cdc7 inhibitor XL-413, 3MB-PP1 (to inhibit Cdk1), or with both compounds. b, Upper panel: asynchronously growing Cdc7AID/AID/Tir1 ESC were treated for 2 h with vehicle, auxin, Ro-3306 or with both compounds. Lower panel: Cdk1AS/AS ESC were treated for 2 h with vehicle, XL-413, 3MB-PP1, or with both compounds. c, Cdc7AID/AID/Tir1 MEFs were treated for 2 h with vehicle, auxin, Ro-3306 or with both compounds. d, MCF10A, HMEC, BJ fibroblasts and primary human dermal fibroblasts (HDF) were treated for 2 h with vehicle, XL-413, Ro-3306 or with both compounds. a-d, The endogenous Cdk2 was immunoprecipitated (IP-Cdk2) from treated cells and used for kinase reactions with [γ32P]-ATP and histone H1 as a substrate. IgG, control immunoprecipitation with IgG. Note that treatment of cells with any of these inhibitors (either singly, or in combination) did not decrease the activity of the endogenous Cdk2. a-d, representative results (out of 2).
Extended Data Fig. 9.
Extended Data Fig. 9.. Live-cell imaging.
a-c, Primary human dermal fibroblasts were live-imaged and treated with vehicle (Control), CDC7 inhibitor TAK-931 (Cdc7i), CDK1 inhibitor Ro-3306, or with both inhibitors. Cells which received the inhibitor(s) starting 0–2 h after the exit of mitosis were selected for analysis. Cells were pulsed with EdU and analyzed for EdU incorporation intensity (a), and DNA content from Hoechst staining (b) 12–14 h after mitosis. Dashed vertical lines in a represent cutoff values for EdU-positive signal, in b for signal corresponding to >2N DNA significantly above 2N noise. c, Median EdU incorporation (from a). Each circle corresponds to a replicate well. d, FUCCI(CA) cell cycle reporter system used in the study. The system consists of fluorescent protein (FP)-tagged fragments of human Cdt1 (Cdt1(1–100)Cy(−)) and human Geminin (Gem(1–110)). Cdt1(1–100)Cy(−) is present during G1, and is rapidly degraded in response to origin firing at the start of S phase (Cdt1(1–100)Cy(−)drop). After the S phase ends, the reporter reaccumulates (Cdt1(1–100)Cy(−)rise). Gem(1–110) is degraded by the anaphase-promoting complex/cyclosome (APC/C) starting at anaphase and throughout G1 phase, until APC/C inactivation takes place at the end of G1 (Gem(1–110)rise). e-h, Asynchronously growing Cdc7AID/AID/Tir1 MEFs expressing FUCCI(CA) reporters were live-imaged in the presence of auxin or vehicle for 4 h and then Ro-3306 was added to cells. Cells which received Ro-3306 0–2 h after the exit from mitosis were selected for analysis. e, Time from the end of mitosis to Gem(1–110)rise (APC/C inactivation), in cells treated as indicated. Shown are cells with Gem(1–110)rise by 20 h after mitosis. f, g, Timing of Cdt1(1–100)Cy(−)drop (S phase entry) relative to Gem(1–110)rise (APC/C inactivation), in cells treated as above. f, Values for cells with Cdt1(1–100)Cy(−)drop within 12 h of Gem(1–110)rise. g, Fraction of cells which had Cdt1(1–100)Cy(−)drop (S phase start) at given times following Gem(1–110)rise (APC/C inactivation). h, Time from the end of mitosis to Cdt1(1–100)Cy(−)drop (S phase entry), in cells treated as indicated. In e, f, h, dots represent values for individual cells, pooled from independent experiments. Red horizontal lines, median values; dotted lines above and below the median, inter-quartile range. Control, vehicle-treated cells. i, j, Analysis of human mammary epithelial MCF10A (i) and osteosarcoma U2OS cells (j) expressing FUCCI(CA) system. Cells were live-imaged and treated with TAK-931 (CDC7i) and/or Ro-3306, or with vehicle (Control). Cells which were treated 0–2 h after the exit from mitosis were selected for analysis. Left panel: proportion of cells which underwent Gem(1–110)rise (APC/C inactivation) over time following the end of mitosis; middle: proportion of cells which underwent Cdt1(1–100)Cy(−)drop (S phase entry) over time following the end of mitosis; right: proportion of cells which underwent S phase entry (Cdt1(1–100)Cy(−)drop) over time following APC/C inactivation (Gem(1–110)rise). k, Analyses of MCF10A cells engineered as in i. Cells were arrested in G0, then induced to re-enter the cell cycle by re-addition of growth factors in the presence of TAK-931 and/or Ro-3306, or with vehicle, and analyzed as in i. c, g, Show mean values; error bars 2×SEM; p-values using two-sided t-test. e-h, n=3 independent replicates.
Extended Data Fig. 10.
Extended Data Fig. 10.. Analyses of Cdk1-cyclin B in mouse and human cells.
a-d, ESC (a) were synchronized in M phase with nocodazole, released, and cell cycle progression monitored (Extended Data Fig. 7e). MEFs (b), human glioblastoma T98G cells (c), and BJ foreskin fibroblasts (d) were serum-starved, stimulated to re-enter the cell cycle by serum addition, and progression through the cell cycle was monitored (Extended Data Fig. 7g). Cdk1 was immunoprecipitated (IP-Cdk1) from cells at the indicated times after the release/stimulation and immunoblots probed for cyclins B1, A2 and E1, and for Cdk1. Whole cell lysates (WCL) were also immunoblotted. AS, asynchronously growing cells; M, M phase-arrested cells; ss, serum-starved cells; IgG, control immunoprecipitation. e-g, Asynchronously growing MEFs (e), human mammary epithelial MCF10A cells (f), and BJ fibroblasts (g) were stained with cell-permeant DNA-binding dyes Hoechst 33342 (MEFs) or CytoPhase Violet (MCF10A and BJ cells). Cells were sorted using FACS based on DNA content into G1, early S, late S and G2/M fractions as in Fig. 5b. Cdk1 was immunoprecipitated from flow-sorted cells and immunoblots probed with antibodies against cyclin B1 or Cdk1. Whole cell lysates (WCL) prepared from sorted cells were also immunoblotted. AS, asynchronously growing cells; IgG, control immunoprecipitation. h, MCF10A cells expressing Cdt1(1–100)Cy(−)-mCherry reporter were used for combined live and fixed-cell imaging. Cells were stained with an anti-cyclin B1 antibody, and nuclear cyclin B1 staining assessed 1–2 h after mitosis in cells which had not entered S phase (G1 cells) or in cells 0.5 to 1 h after Cdt1(1–100)Cy(−)drop (early S phase). For control of antibody specificity, cells were transfected with anti-cyclin B1 siRNA (siB1), or control siRNA (siCtrl) 24 h before fixation (cells retained sufficient cyclin B1 to progress through mitosis). Cdc7i, cells treated with a Cdc7 inhibitor, TAK-931. Total, images of cells stained for cyclin B1; nuclear, cyclin B1 nuclear signal. Cells were also stained for EdU incorporation (to confirm DNA synthesis in S not in G1 phase nuclei) and with Hoechst (DNA stain). Scale bar, 10 μm. i, log2 intensity of nuclear cyclin B1 staining in different treatment groups (data from Fig. 5d; G1 and early S phase cells were defined as above in h). Dots represent values for individual cells; red horizontal lines, median values; dotted lines above and below the median, inter-quartile range. Long dashed line denotes median nuclear cyclin B1 signal in cells treated with anti-cyclin B1 siRNA, which we consider background level. Note that anti-cyclin B1 siRNA decreased nuclear cyclin B1 staining in G1 and in early S phase cells (h, i), confirming the specificity of the antibody used. a-g, representative results (out of 2).
Extended Data Fig. 11.
Extended Data Fig. 11.. Analyses of nuclear CDK1 during cell cycle progression.
a, Immunostaining of human mammary epithelial MCF10A cells treated with control siRNA (siCtrl) or anti-CDK1 siRNA (siCDK1) for 26 h, stained with anti-CDK1 antibody #1 (Abcam). b-d, MCF10A cells expressing Gem(1–110)-mVenus and Cdt1(1–100)Cy(−)-mCherry FUCCI(CA) reporters were live-imaged and then fixed. Cells were stained with three different anti-CDK1 antibodies: (b) #1 from Abcam, (c) #2 from Atlas Antibodies, (d) #3 from Cell Signaling Technology (CST), and nuclear CDK1 staining was assessed. Upper rows, log2 intensity of nuclear CDK1 staining at the indicated times after Cdt1(1–100)Cy(−)drop (S phase start); lower panels, CDK1 nuclear intensity after the end of last mitosis. For control of antibody specificity, cells were transfected with anti-CDK1 siRNA (siCDK1), or control siRNA (siCtrl) for 6 h and then immediately imaged for 16 h. Cells depleted of CDK1 for this time retained sufficient amounts of CDK1 to progress through mitosis. Red lines represent median values within bins every 3 time-points (36 min, 12 min interval). Third panels from left show median log2 intensity of nuclear CDK1 staining in control cells (blue) and cells treated with anti-CDK1 siRNA (red). Note decreased nuclear CDK1 staining (using all three antibodies) in cells transfected with anti-CDK1 siRNA, which confirms the specificity of the antibodies. Right panels (images of cells) depict examples of nuclear CDK1 staining used for quantification in the previous panels. Upper panels (set of 4 pictures labelled ‘early S phase’), Hoechst (DNA) and CDK1 staining for cells fixed 48 min (4 time-points) after Cdt1(1–100)Cy(−)drop (S phase start); lower panels labelled ‘G1phase’, cells fixed 3 h after the end of last mitosis in G1. Cells were transfected with control siRNA or anti-CDK1 siRNA. CDK1 depletion (siCDK1) decreased nuclear CDK1 staining in G1 and early S phase cells. e-g, Another representation of values from b-d, for cells in G1 (3–4 h after mitosis) and early S phase (0–1 h after Cdt1(1–100)Cy(−)drop), transfected with control siRNA (siCDK1 −) or with anti-CDK1 siRNA (siCDK1 +) and stained with anti-CDK1 antibody #1 (e), #2 (f) or #3 (g). Dots show values for individual cells, horizonal lines median values, dotted lines above and below the median represent inter-quartile range. h-i, Live and fixed-cell analysis of primary human dermal fibroblasts, similar to b-d. h, Since cells did not express FUCCI reporters, we analyzed nuclear CDK1 staining relative to the end of last mitosis (left panel). Right panels (cell images) show nuclear CDK1 staining in cells stained 3 h after the end of last mitosis (labelled G1 phase). Nuclei were stained with Hoechst. i, log2 of EdU incorporation in cells from the left panel (to illustrate their cell cycle progression), pulsed with EdU for 8 min prior to fixation; EdU-high cells correspond to S phase cells, EdU-low to G1 or G2 cells. h-i, Red lines represent median values within bins every 6 time-points (60 min, 10 min interval). Scale bars, 100 μm (a); 10 μm (b-d, h).
Extended Data Fig. 12.
Extended Data Fig. 12.. Analyses of anti-CDK1 antibody specificity and subcellular fractionation.
a-d, Immunostaining of MCF10A cells transfected with control siRNA (siCtrl), anti-CDK1 siRNA (siCDK1), or anti-CDK2 siRNA (siCDK2) for 24 h, stained with (a) anti-CDK1 antibody #1 (Abcam), (b) anti-CDK1 antibody #2 (Atlas Antibodies), (c) anti-CDK1 antibody #3 (Cell Signaling Technology, CST) or (d) anti-CDK2 antibody. Scale bars, 100 μm. Quantification of fluorescence intensity within the nuclei is shown on the right of each panel. Note that the anti-CDK1 immunofluorescence signal decreases upon depletion of CDK1 (siCDK1), but not following depletion of CDK2 (siCDK2). The anti-CDK2 signal decreases after depletion of CDK2 (siCDK2) but not of CDK1 (siCDK1). e, f, primary human dermal fibroblasts (HDF), MCF10A and HMEC cells and were transfected with control siRNA (siCtrl) or anti-CDK1 siRNA (siCDK1) for 48 h. Protein lysates were immunoblotted with anti-CDK1 antibody #1 (Abcam, left panel) or anti-CDK2 antibody (right panel). Lysates from CDK2-knockout (sgCDK2) and control (sgCTR) HMEC cells were immunoblotted in parallel. HSP90 was used as a loading control. The CDK1 signal decreased following depletion of CDK1, while the CDK2 signal remained unaffected. Knockout of CDK2 abrogated the CDK2 signal, but not the CDK1 signal. Panel e shows bands corresponding to CDK1, CDK2 and HSP90, panel f full-length blots probed with anti-CDK1 and anti-CDK2 antibodies. Dashed vertical lines indicate that the middle portions of the blots were spliced out; first two left lanes (HDF cells) were exposed for a longer time than the rest of the blot. g, h, Asynchronously growing human BJ foreskin fibroblasts and human mammary epithelial MCF10A and HMEC cells were stained with cell-permeant DNA-binding dye CytoPhase Violet. Cells were sorted using FACS, based on DNA content, into G1/S and G/M fractions. Cytoplasmic and nuclear fractions were prepared from cells, resolved on gels (10 μg of cytoplasmic, 20 μg of nuclear) and immunoblots probed for CDK1 (antibody #1, Abcam), GAPDH (a cytoplasmic marker), SP1 and topoisomerase I (TOPO) (both markers of the nuclear fraction; in BJ cells TOPO band migrated at ~75 kD). g, example of gating strategy for flow-sorting (BJ cells), h, immunoblot analysis; C, cytoplasmic fraction; N, nuclear fraction; AS, whole cell lysates from asynchronously growing non-sorted cells. In agreement with immunostaining (Extended Data Fig. 11), we detected nuclear Cdk1 in G1/S cells. i, DNA replication assays in nucleus-free Xenopus egg extracts (see Fig. 5e for quantification). Extracts were treated with Cdc7 inhibitor PHA-767491 (CDC7i) or with DMSO (Control). The indicated recombinant cyclin-CDK complexes were added, and nascent strand DNA synthesis assessed by incorporation of [α-32P]-dATP at 7.5, 15, 30 and 60 min following replication initiation. OC, open circular plasmid; SC, supercoiled plasmid. a-h Show representative results (out of 2), i out of 3.
Fig. 1.
Fig. 1.. Shutdown of Cdc7 in in vitro cultured cells.
a, b, Growth curves of Cdc7AS/AS ESC (a) and MEFs (b) cultured with 1NM-PP1 (to inhibit Cdc7) or with vehicle (Control). c, Western blot analysis of Cdc7 protein levels in Cdc7AID/AID ESC treated with auxin (IAA). d, Flow cytometry of Cdc7AID/AID/Tir1 ESC treated with auxin for 12h (Acute) or 48 h (Long-term). e, Growth curves of Cdc7AID/AID/Tir1 ESC. Starting at day 1, cells were treated with auxin or vehicle. f, g, DNA fiber analysis: mean fraction of new replication origins (f), and fork speed (g) in Cdc7AID/AID/Tir1 ESC treated with auxin for the indicated times. h, Western blot analysis of phospho-Mcm2 residues in Cdc7AID/AID/Tir1 ESC treated with auxin for 2 days. i, j, Western blot analysis of Cdc7 protein levels in Cdc7AID/AID/Tir1 MEFs treated with auxin (i), or after auxin removal (j). k, Immunofluorescence analysis of Cdc7AID/AID/Tir1 MEFs treated for 4 or 26 h with auxin or vehicle (DMSO) and stained for Flag-Cdc7. l, Flow cytometry of Cdc7AID/AID/Tir1 MEFs treated with auxin or vehicle for 2 days.. m, Growth curves of Cdc7AID/AID/Tir1 MEFs cultured in the presence of auxin or vehicle n, Growth curves of Cdc7AID/AID/Tir1 MEFs immortalized by dominant-negative p53, cultured with auxin or with vehicle. a, b, e, f, g, m, n, shown are mean values; p-values were determined by two-sided t-test; error bars, SD. In a, b, e, m, n, n=3 independent replicates; f, n=2; g, n > 500 cells, c, d, h-k representative results (out of 2).
Fig. 2.
Fig. 2.. Analyses of cells following Cdc7 degradation.
a-c, Long-term live-cell imaging. Immortalized CDC7AID/AID/Tir1 MEFs expressing Gem(1–110)-mCherry and Cdt1(1–100)Cy(−)-mVenus FUCCI(CA) cell-cycle reporters were cultured and imaged for a total of 77 h. Seven h after imaging start, cells were treated with auxin (IAA), or vehicle (Control) and imaged for additional 70 h. Shown are parameters for first two cell-cycles (generation 1 and 2) after addition of auxin (selecting cells which received IAA 0–4 h before mitosis). a, Total cell-cycle length (time between mitoses); b, G1 length (time between mitosis and Cdt1(1–100)Cy(−)drop, i.e., S-phase start). c, S/G2 length (time from Cdt1(1–100)Cy(−)drop to subsequent mitosis). Dots show values for individual cells, horizonal lines median values, dotted lines inter-quartile range, long horizonal line median value from control cells in generation 1. d-e, Length of cell-cycle phases determined by pulse-chase in Cdc7AID/AID/Tir1 ESC (d) and MEFs (e) treated for the indicated times with auxin. Control, length of cell-cycle phases in untreated cells. f, g, Doubling times of Cdc7AID/AID/Tir1 ESC (f) and MEFs (g) treated for the indicated times with auxin, determined by pulse-chase. Control, doubling time of untreated cells. h, i, Percentages of viable (Annexin V/PI), early apoptotic (Annexin V+/PI), late apoptotic (Annexin V+/PI+) and necrotic (Annexin V/PI+) Cdc7AID/AID/Tir1 ESC (h) and MEFs (i) treated with auxin for indicated times. Control, untreated cells. In d-i, bars denote mean values, p-values two-sided t-test; error bars, SD, n=3 independent replicates.
Fig. 3.
Fig. 3.. Analyses of Cdk1 in S-phase entry.
a, Immunoblotting of Cdk2+/+ (wt) and Cdk2-knockout (Cdk2−/−) Cdc7AID/AID/Tir1 ESC treated with auxin (IAA). b, Flow cytometry of Cdk2-knockout/Cdc7AID/AID/Tir1 ESC treated with auxin or vehicle (Control). c, Growth curves of Cdk2-knockout/Cdc7AID/AID/Tir1 ESC treated with auxin or vehicle. d, Quantification of Mcm2-phosphorylation in Cdc7AID/AID/Tir1 ESC treated with auxin for 5, 24, 48h. Black dots, phosphorylation levels at time 0. e, Immunoblotting of Cdk2+/+ (wt) and Cdk2−/−, Cdc7AID/AID/Tir1 (AID) ESC for Cdc7-dependent (S40) and -independent (S27) Mcm2 phosphoresidues; cells were treated with auxin for 24h. f, In-cell phosphorylation of Mcm2 by Cdk1. IgG, control immunoprecipitation from Cdk1AS/AS cells. g, h, ESC were released from mitosis (g), MEFs, glioblastoma T98G and BJ foreskin fibroblasts were released from G0 (h). Cdk1 was immunoprecipitated at the indicated time-points and used for kinase reactions with histone H1 as substrate. AS, asynchronous cells; M, mitosis-arrested cells. IgG, control immunoprecipitation. i, Asynchronously growing Cdc7AID/AID/Tir1 ESC (Asynchr.) were synchronized in mitosis by nocodazole (M-phase) and released (−Noco). Upon release, Cdc7 degradation was induced by auxin addition to account for degradation time. Two hours later, when cells reached G1, they were treated with Cdk1 inhibitor Ro-3306. Cells were cultured in the presence of inhibitor(s), collected after 12h (S/G2), stained with propidium iodide and analyzed by flow cytometry. j, Fraction of new replication origins in Cdc7AID/AID/Tir1 ESC treated with auxin for 48 h and/or Ro-3306 for the last 1h, or with vehicle. k, T98G and BJ cells were arrested in G0 and released in the presence of CDC7 inhibitor XL-413 and/or Ro-3306 or vehicle. Cells were pulsed with BrdU after 19h and analyzed by flow cytometry. c, d, j,k, mean values; p-values two-sided t-test; error bars, SD. c, d, j, k, n=3 independent replicates; a, b, e-i representative results (out of 2).
Fig. 4.
Fig. 4.. Live-cell imaging of Cdc7-depleted cells.
a-c, Asynchronously growing immortalized Cdc7AID/AID/Tir1 MEFs expressing FUCCI(CA)-reporters were live-imaged in the presence of auxin (IAA) or vehicle for 4 h, and then Cdk1 inhibitor Ro-3306 was added. Cells treated with Ro-3306 starting at 0–2 h after the mitotic exit (in G1-phase) were selected for analysis. a, EdU intensity at the indicated times after S-phase entry (recorded as Cdt1(1–100)Cy(−)drop), in cells treated as indicated. b, c, EdU (b) and Hoechst intensity (DNA-content) (c) in cells 16–18 h after mitosis, treated as indicated. d-f, MCF10A cells expressing FUCCI(CA)-reporters were live-imaged as in a-c. Cells were treated with vehicle, CDC7-inhibitor TAK-931 (Cdc7i), Ro-3306, or with both inhibitors. Cells treated with drug(s) starting at 0–2 h after mitotic exit were selected for analysis. d, EdU intensity at the indicated times after S-phase start (Cdt1(1–100)Cy(−)drop) in cells treated as indicated. e, Intensity of EdU incorporation at the indicated times after completion of mitosis. f, Hoechst intensity (DNA-content) in cells treated as above, 10–12h after mitotic exit. Dashed horizontal lines (a, d), cutoff values for EdU-positive signal. Dashed vertical lines: b, e, cutoff values for EdU-positive signal; c, f, signal corresponding to >2N DNA significantly above 2N noise.
Fig. 5.
Fig. 5.. Analyses of Cdk1-cyclin B at G1/S.
a, ESC were synchronized in M-phase with nocodazole; MEFs, T98G and BJ cells were arrested in G0. Cells were released and collected at indicated time-points for cyclin B1 immunoprecipitation (IP) followed by kinase reactions with [γ32P]-ATP and histone H1 as substrate. AS, asynchronous cells; M, M-phase cells; IgG, control immunoprecipitation. b, Example of gating strategy for flow-sorting. BJ foreskin fibroblasts were stained with CytoPhase Violet (CPV) and sorted using gates indicated at the top. c, Cyclin B1 was immunoprecipitated from flow-sorted cells and subjected to kinase reactions as in a. d, MCF10A cells expressing Cdt1(1–100)Cy(−)-mCherry reporter were stained with anti-cyclin B1 antibody. For antibody control, cells were transfected with anti-cyclin B1 (siB1) or control siRNA (siCtrl) 24h before fixation. Shown is intensity of nuclear cyclin B1 at the indicated time-points after Cdt1(1–100)Cy(−)drop (S-phase entry). Red lines, median values within bins every two time-points (24 min, 12 min interval), blue dashed lines, mean nuclear cyclin B1 signal in cells treated with siB1 (background level). Right, median intensity of nuclear cyclin B1 at indicated time-points after S-phase entry in different treatment groups. Cdc7i, cells treated with Cdc7-inhibitor, TAK-931. e, Quantification of DNA-replication assays in Xenopus egg extracts (from Extended Data Fig. 12i). Extracts were treated with PHA-767491 (CDC7i) or DMSO (Control), cyclin-CDK complexes added, and nascent strand DNA-synthesis assessed at indicated time-points. Bars, mean values, error bars, SD, n=3 independent replicates. a, b, c, representative results (out of 2).

References

    1. Asghar U, Witkiewicz AK, Turner NC & Knudsen ES The history and future of targeting cyclin-dependent kinases in cancer therapy. Nat Rev Drug Discov 14, 130–146, doi:10.1038/nrd4504 (2015). - DOI - PMC - PubMed
    1. Chuang LC et al. Phosphorylation of Mcm2 by Cdc7 promotes pre-replication complex assembly during cell-cycle re-entry. Mol Cell 35, 206–216, doi:10.1016/j.molcel.2009.06.014 (2009). - DOI - PMC - PubMed
    1. Heller RC et al. Eukaryotic origin-dependent DNA replication in vitro reveals sequential action of DDK and S-CDK kinases. Cell 146, 80–91, doi:10.1016/j.cell.2011.06.012 (2011). - DOI - PMC - PubMed
    1. Lei M et al. Mcm2 is a target of regulation by Cdc7-Dbf4 during the initiation of DNA synthesis. Genes Dev 11, 3365–3374, doi:10.1101/gad.11.24.3365 (1997). - DOI - PMC - PubMed
    1. Sheu YJ & Stillman B Cdc7-Dbf4 phosphorylates MCM proteins via a docking site-mediated mechanism to promote S phase progression. Mol Cell 24, 101–113, doi:10.1016/j.molcel.2006.07.033 (2006). - DOI - PMC - PubMed

Substances