. 2022 May;605(7910):532-538.
doi: 10.1038/s41586-022-04682-5. Epub 2022 May 4.

Landscape of helper and regulatory antitumour CD4+ T cells in melanoma

Affiliations

Landscape of helper and regulatory antitumour CD4+ T cells in melanoma

Giacomo Oliveira et al. Nature. 2022 May.

Abstract

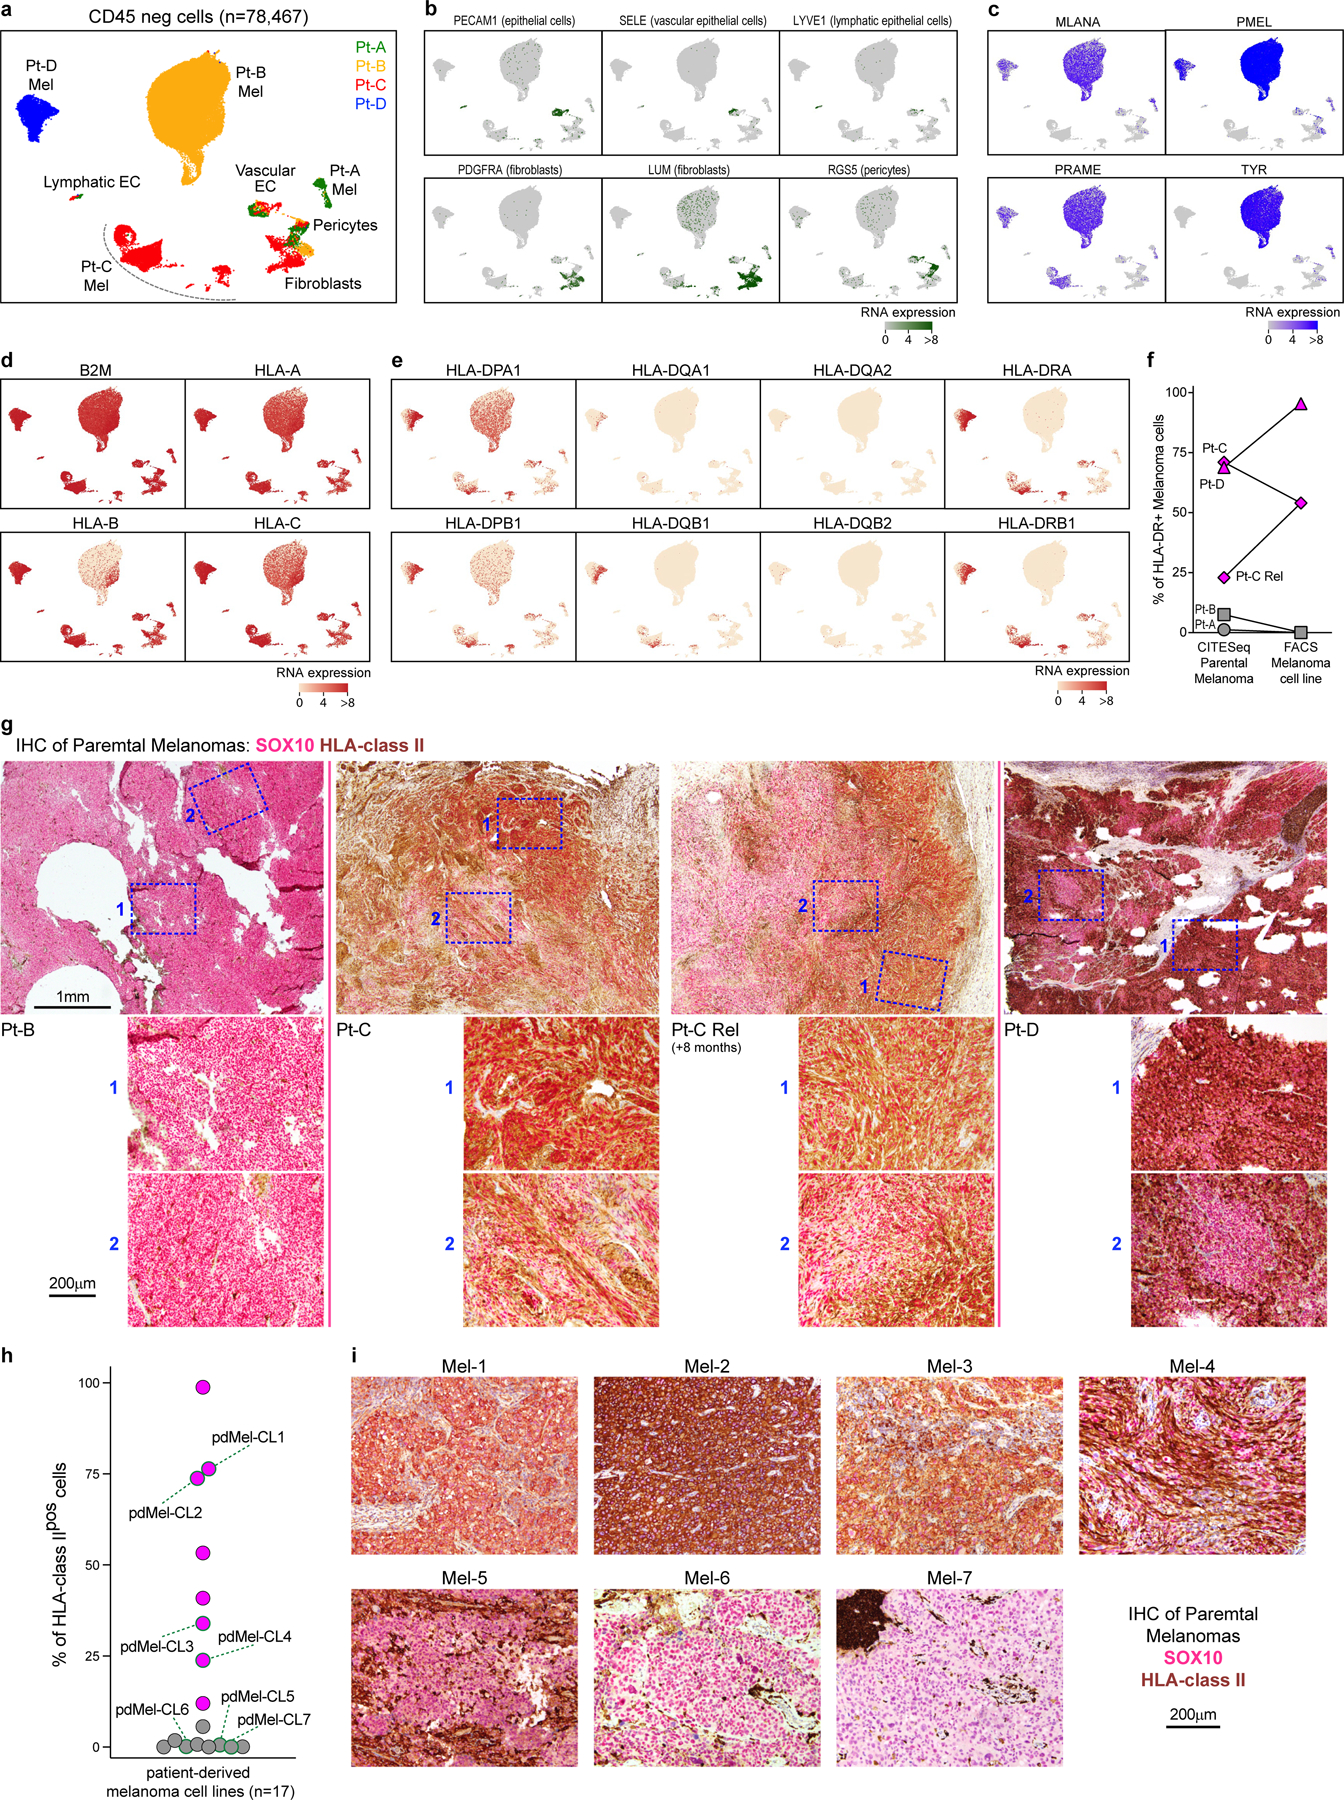
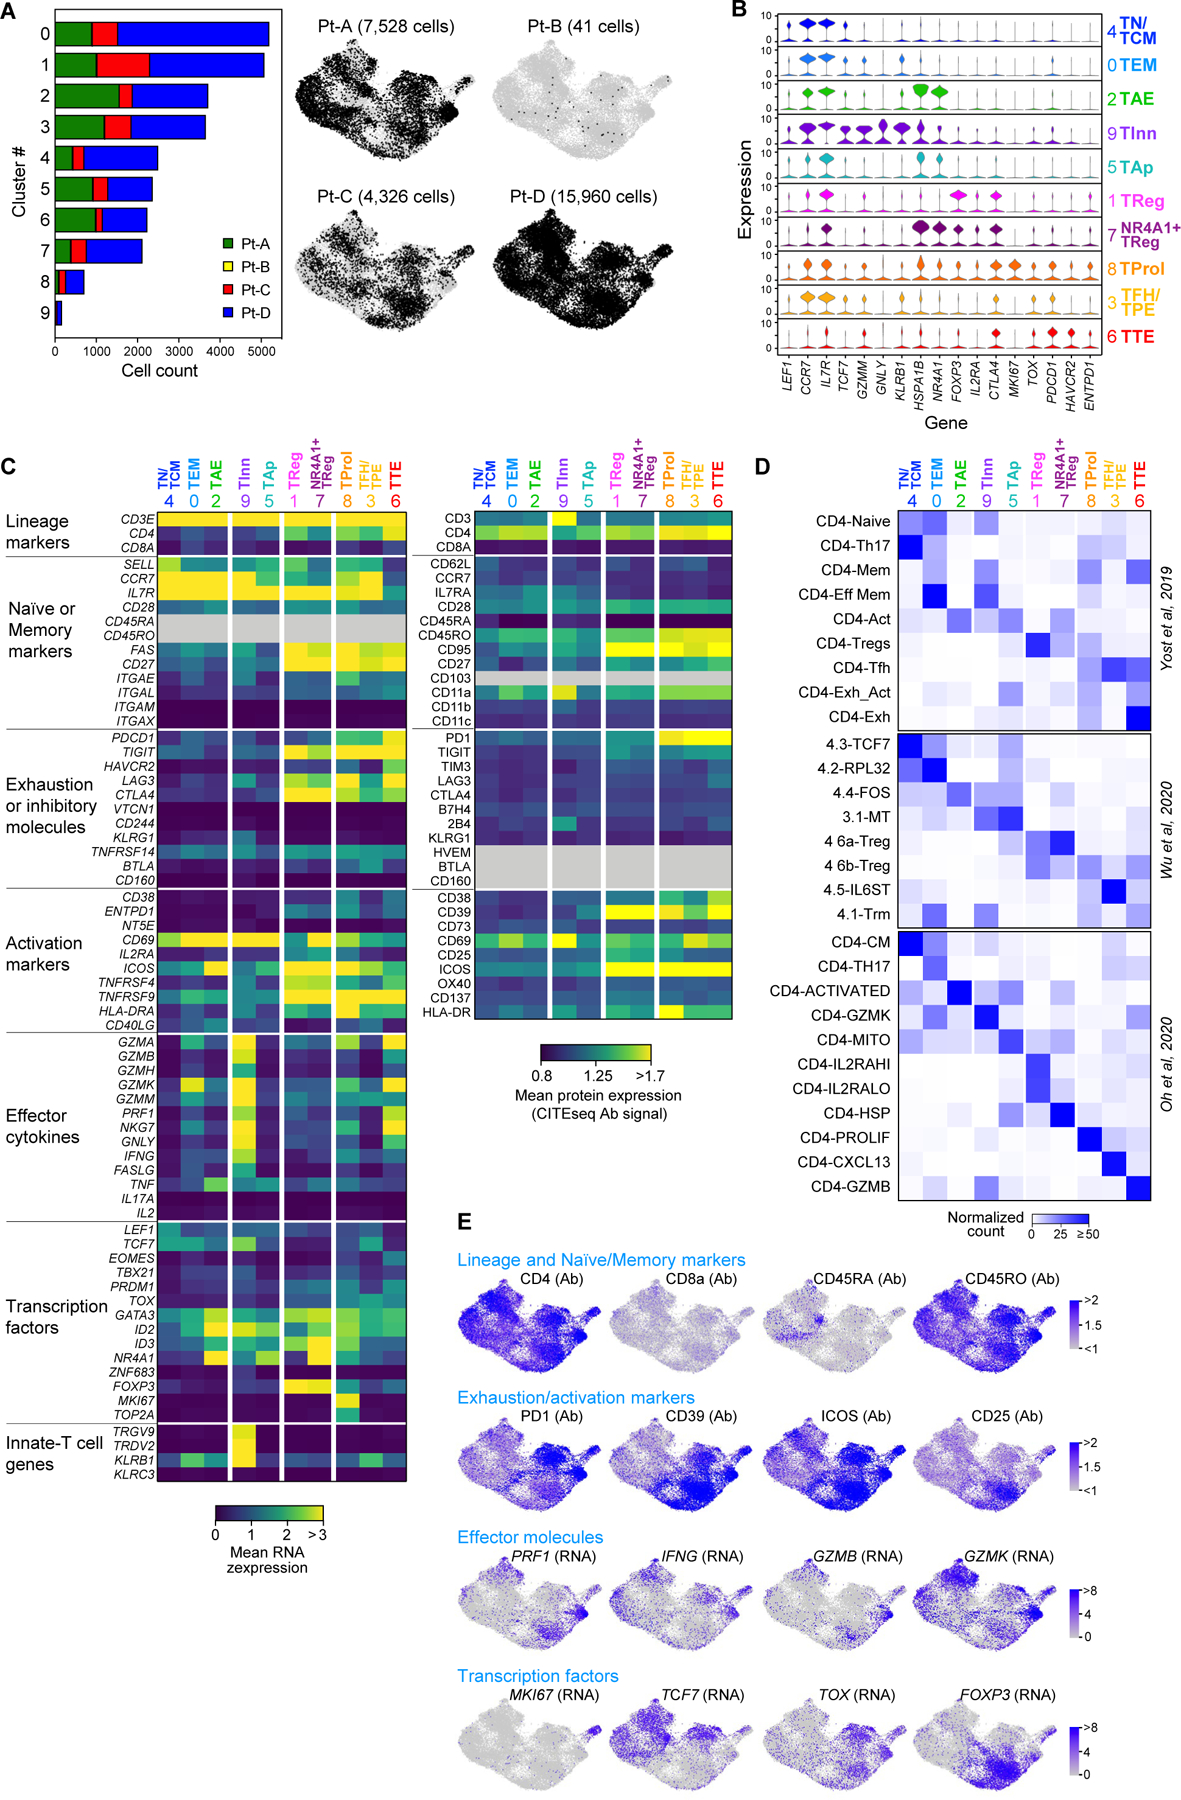
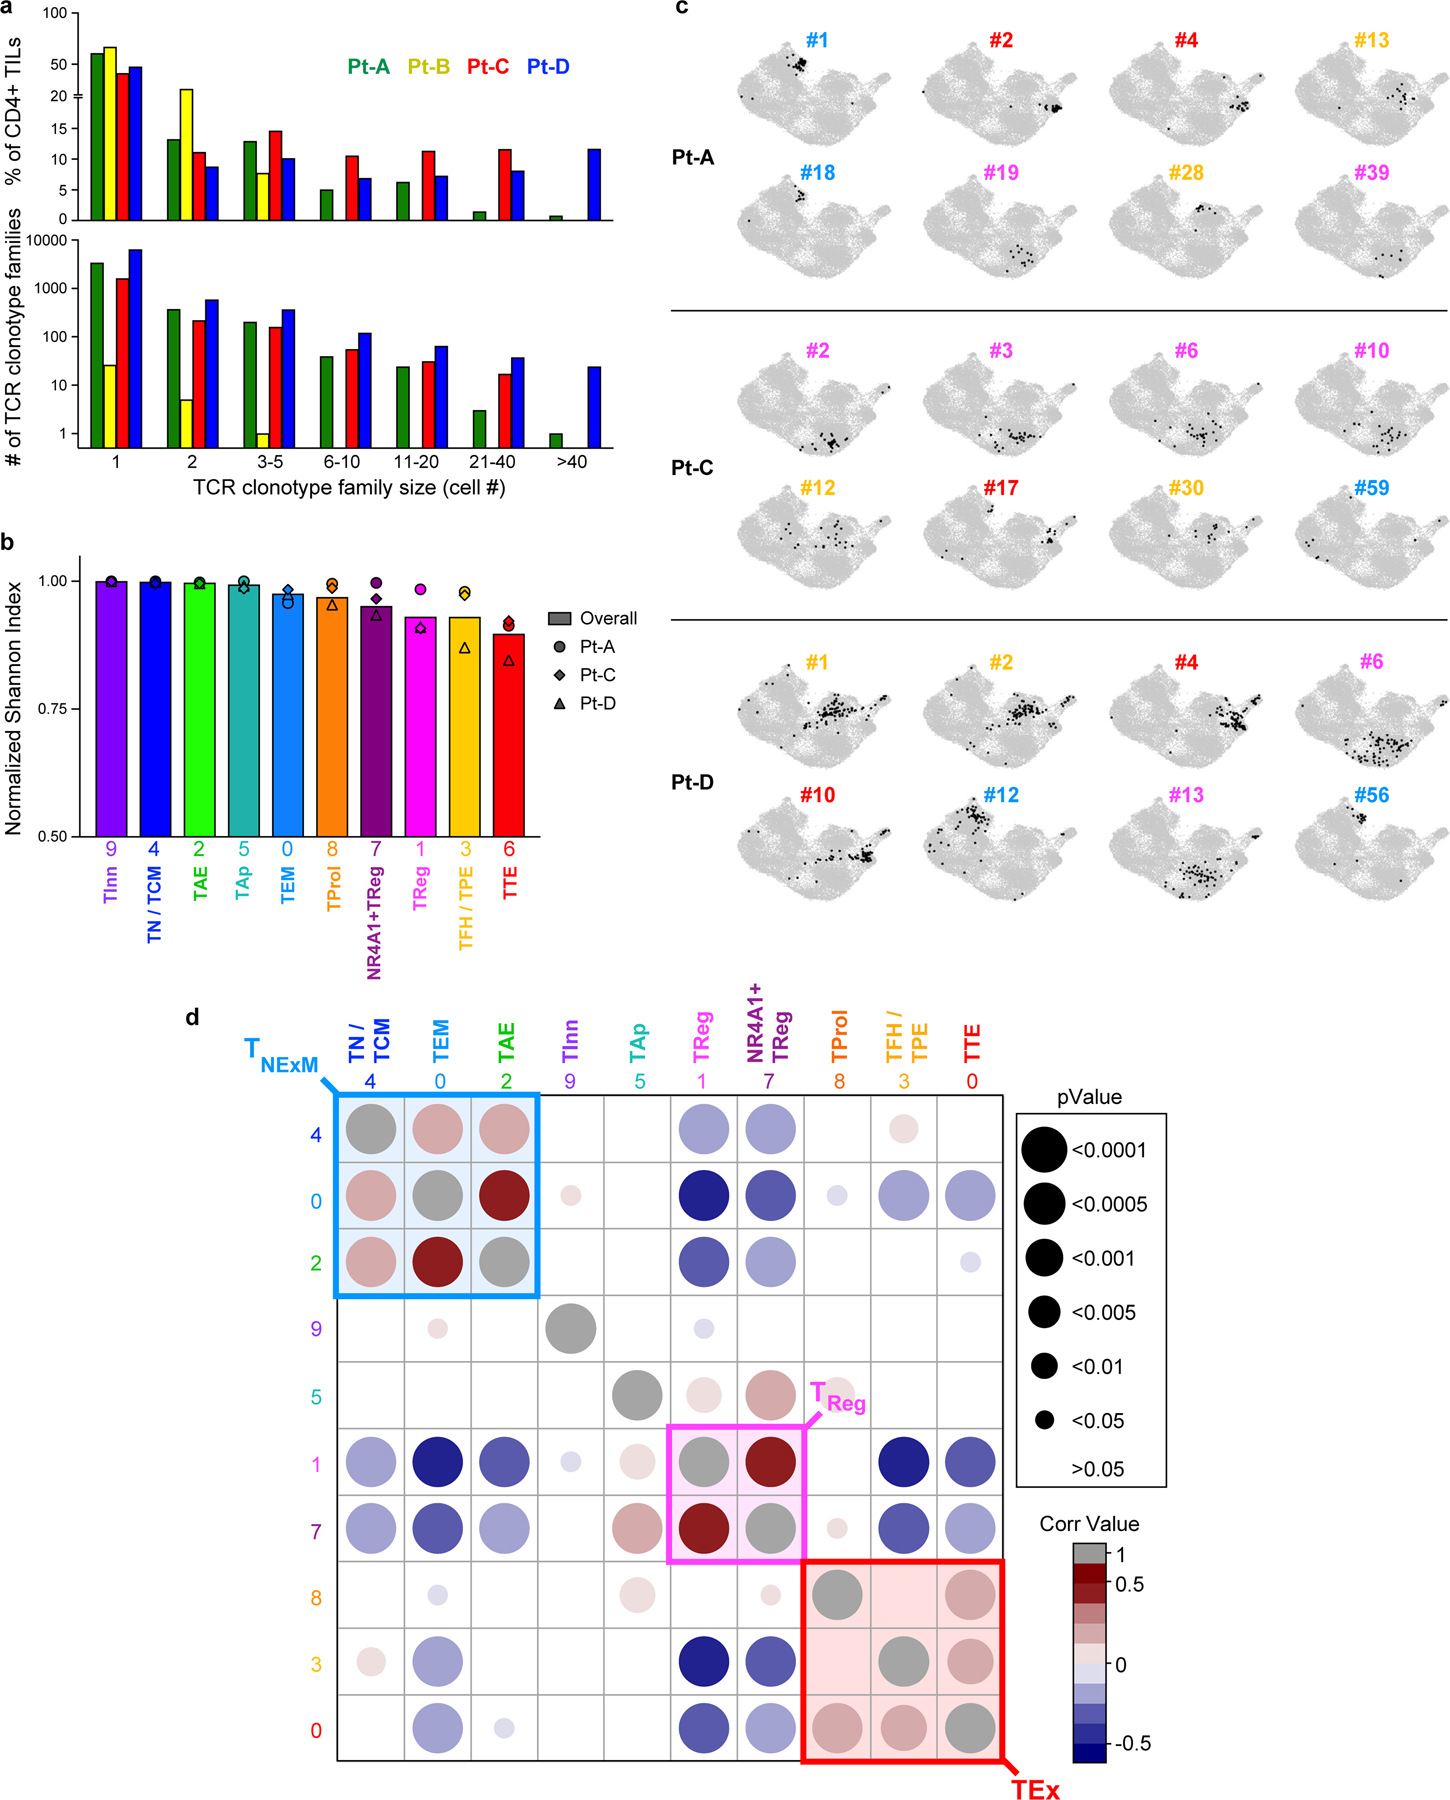
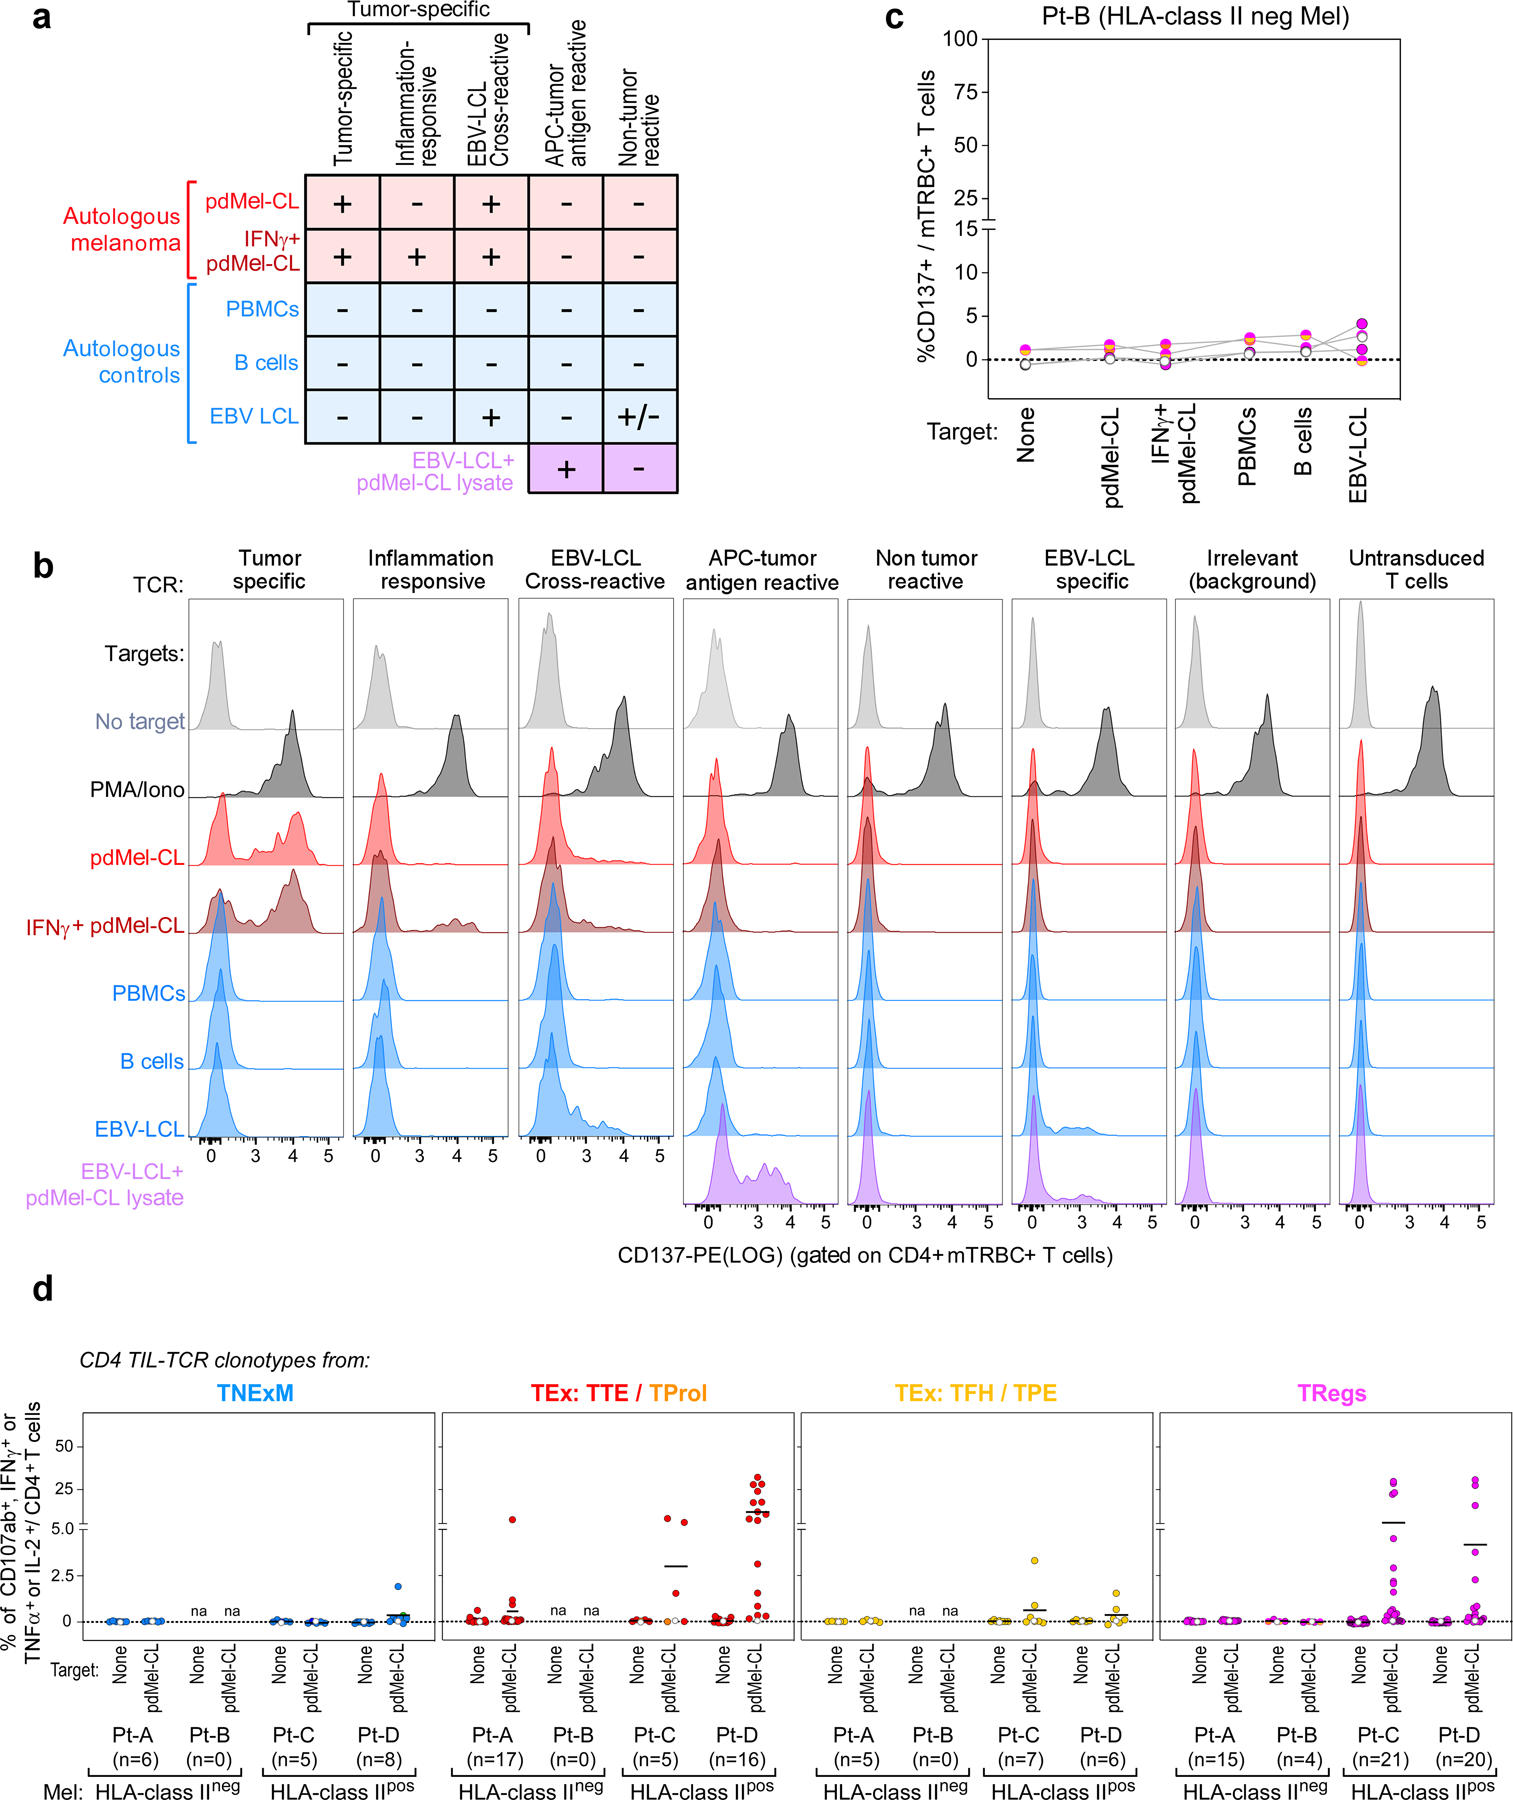
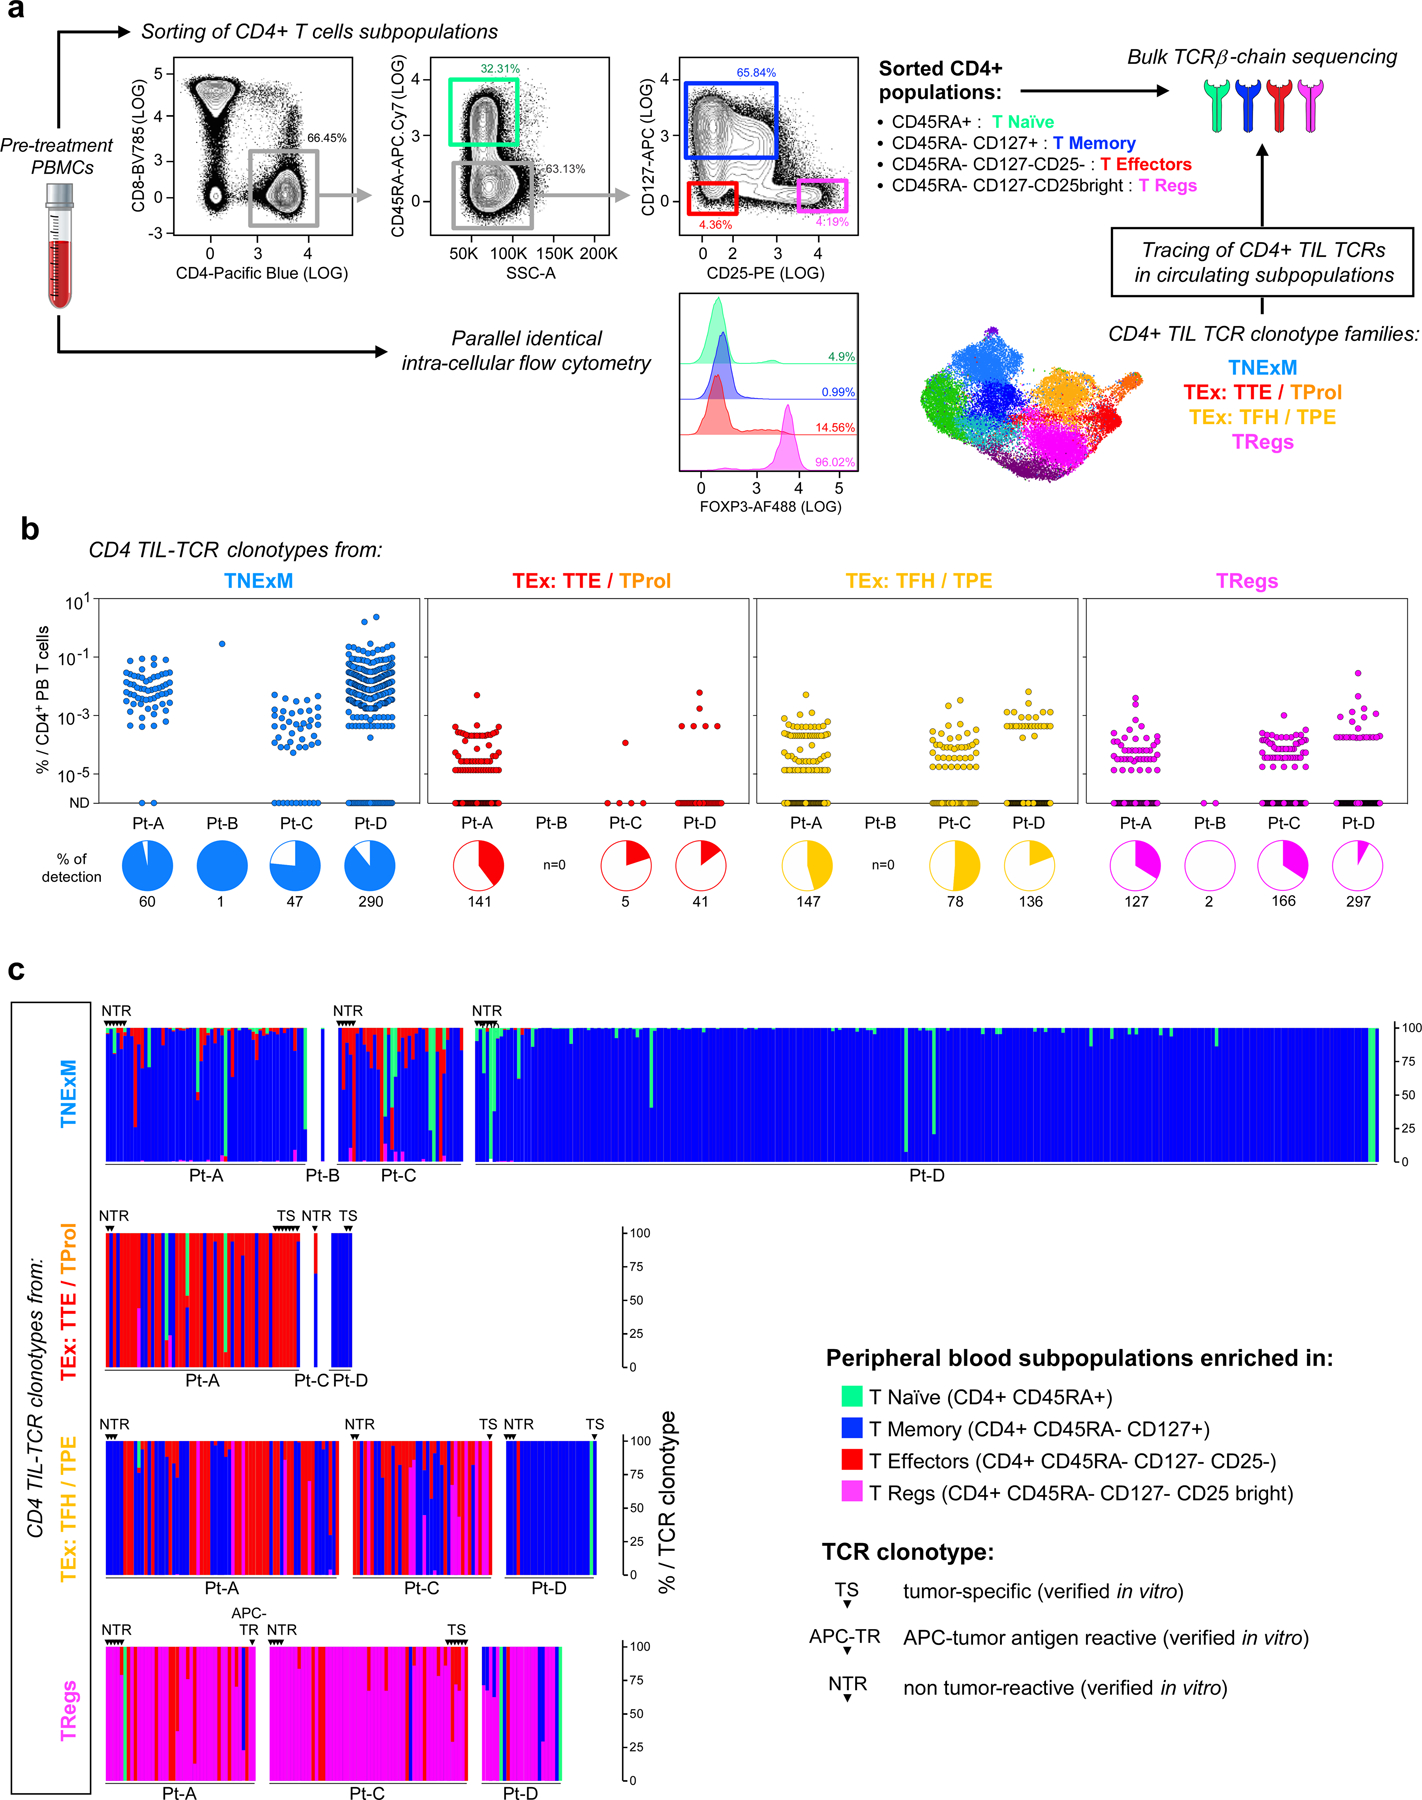
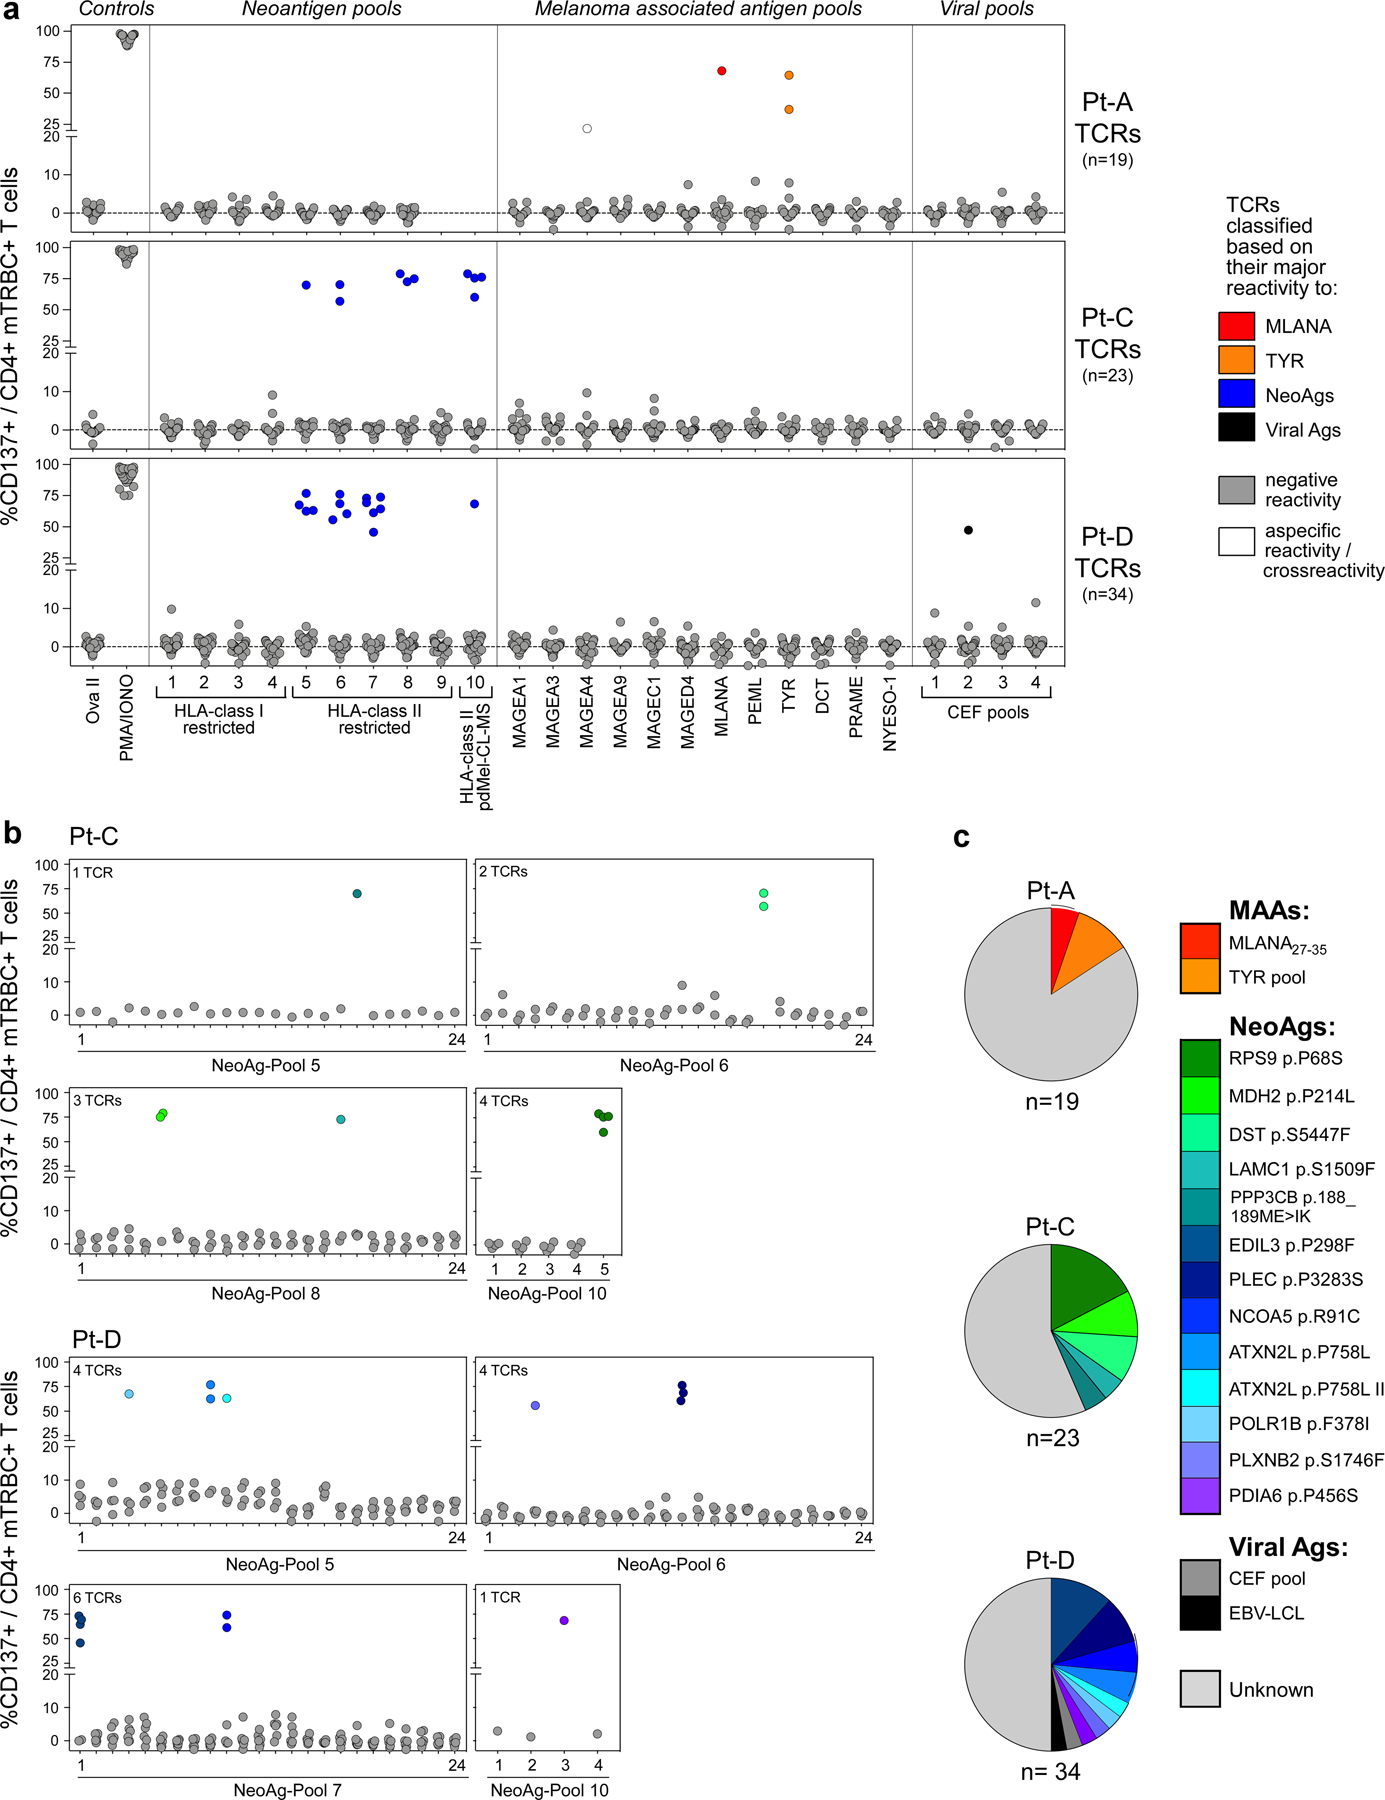
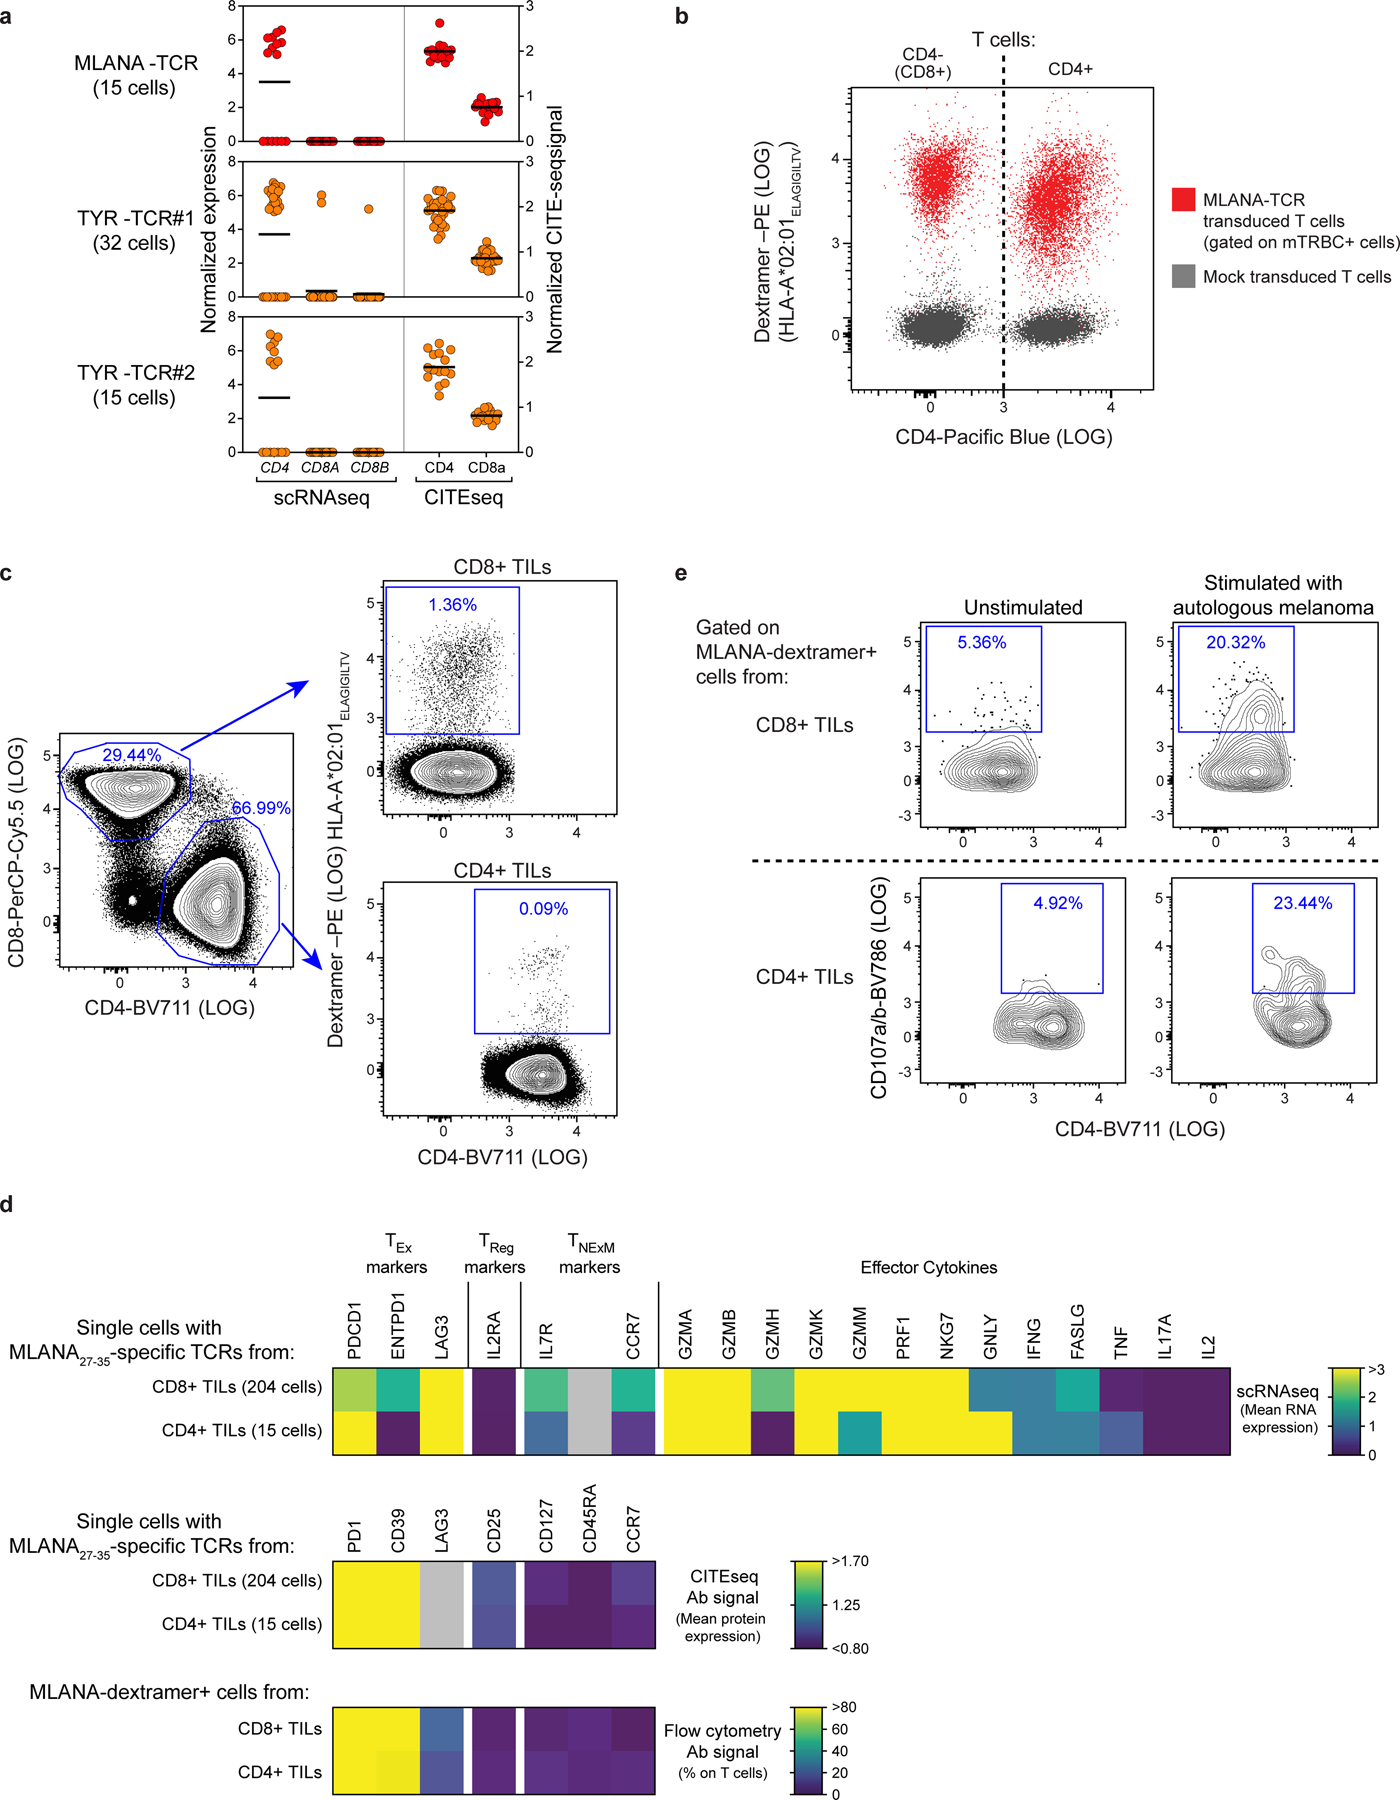
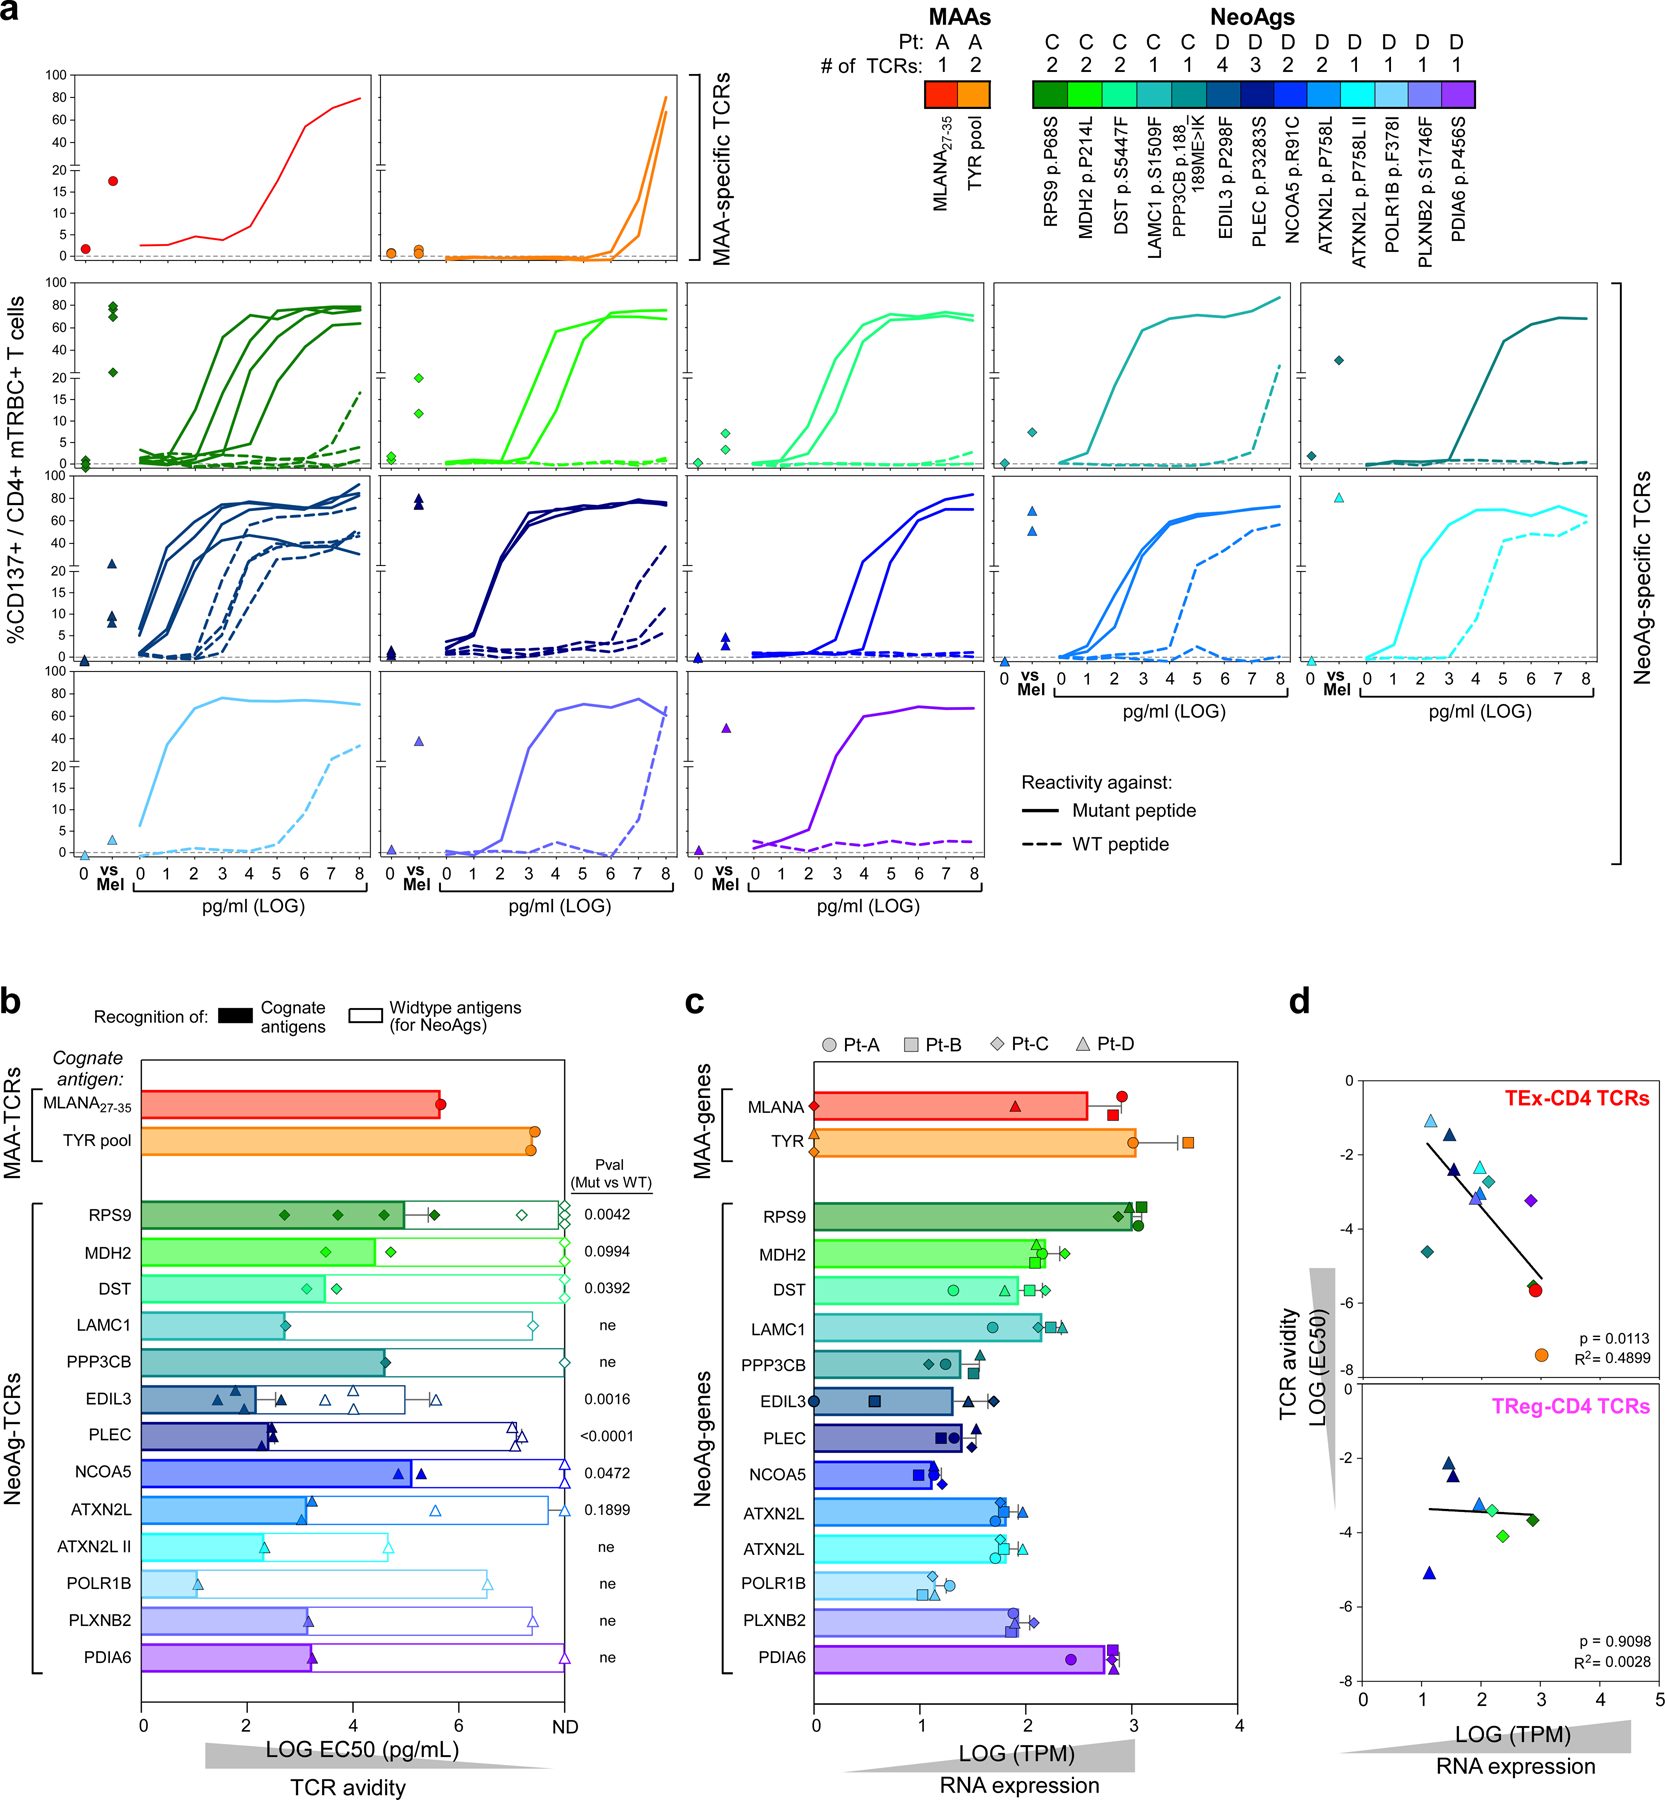
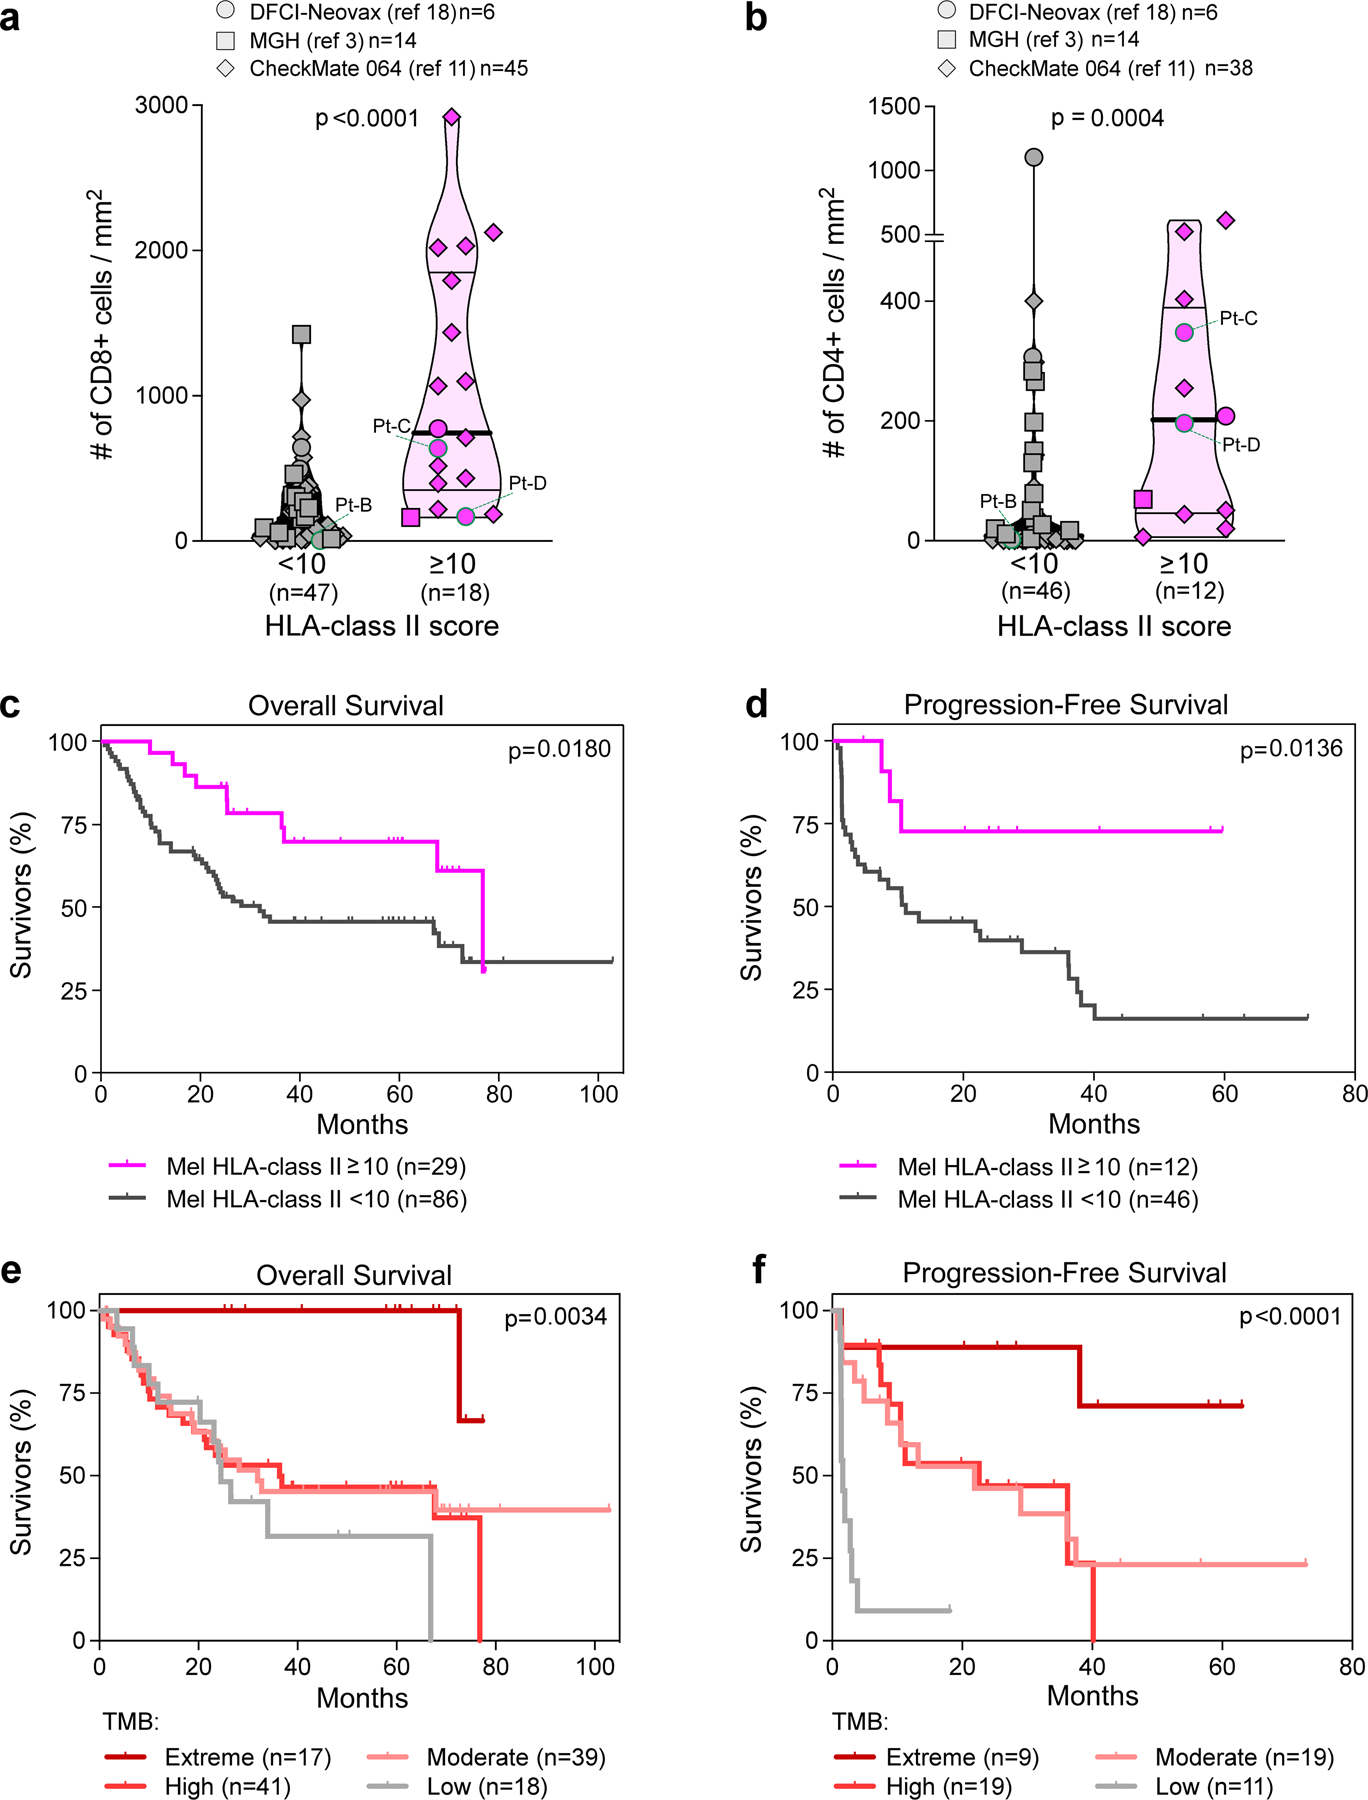
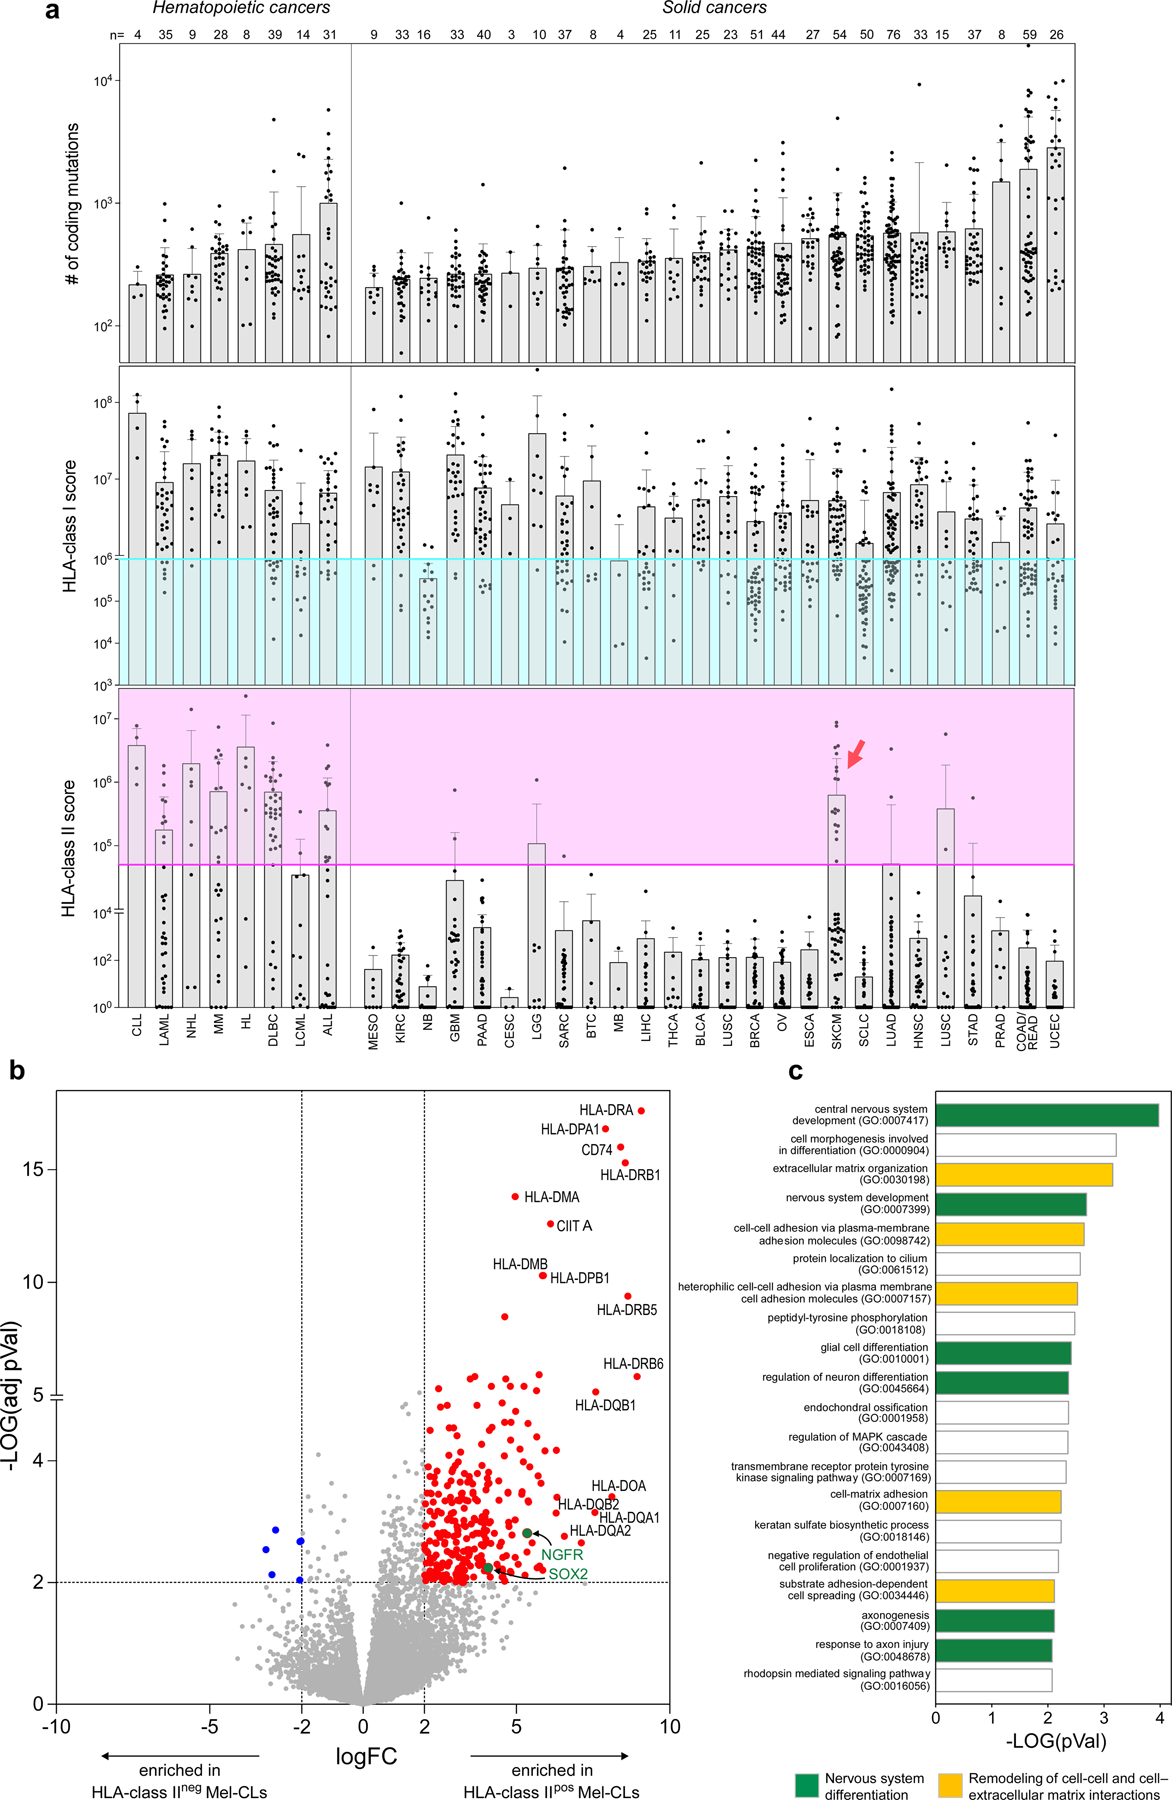
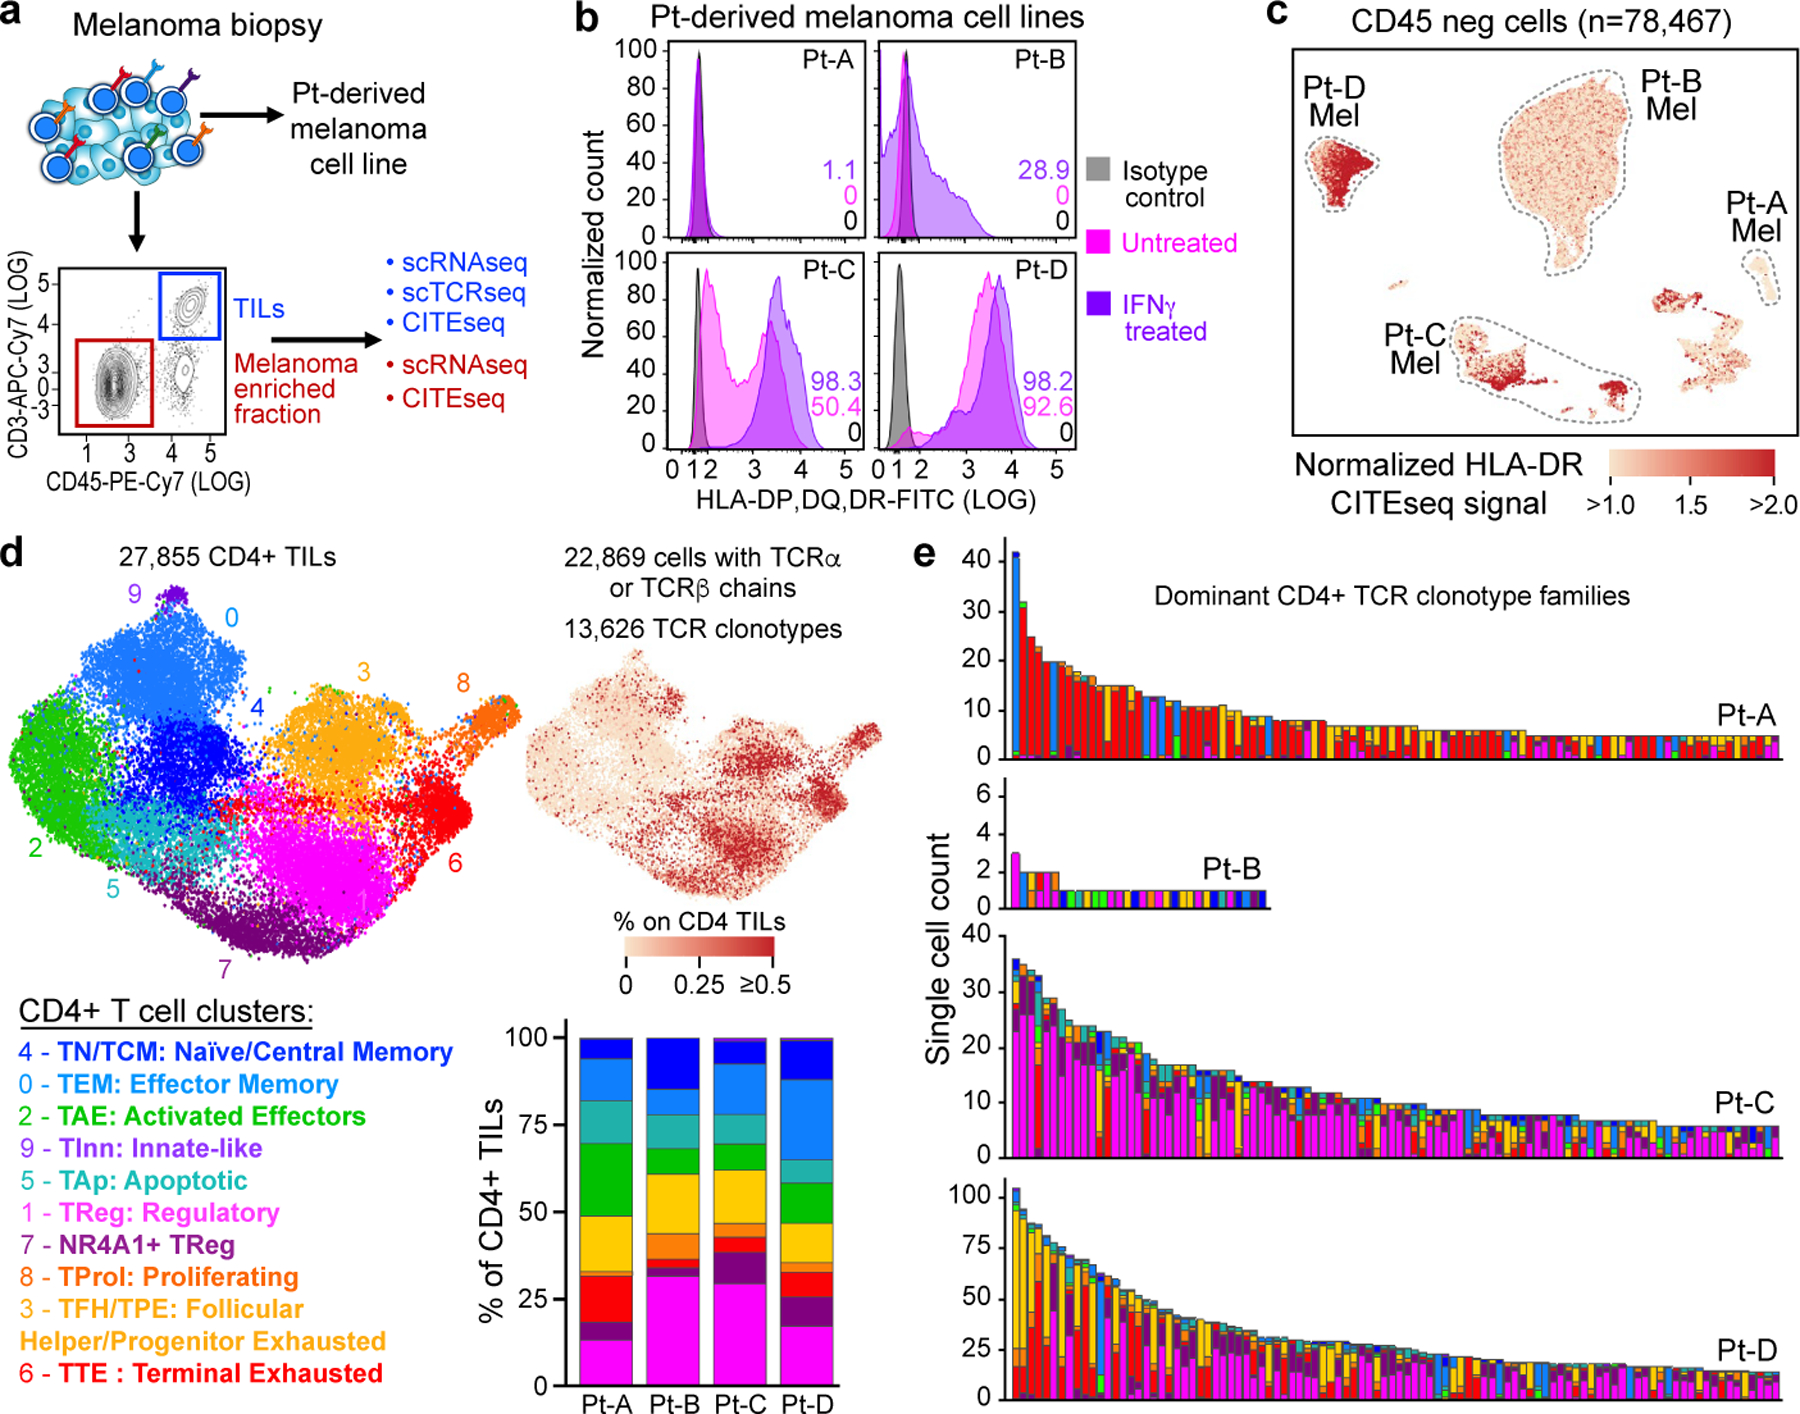
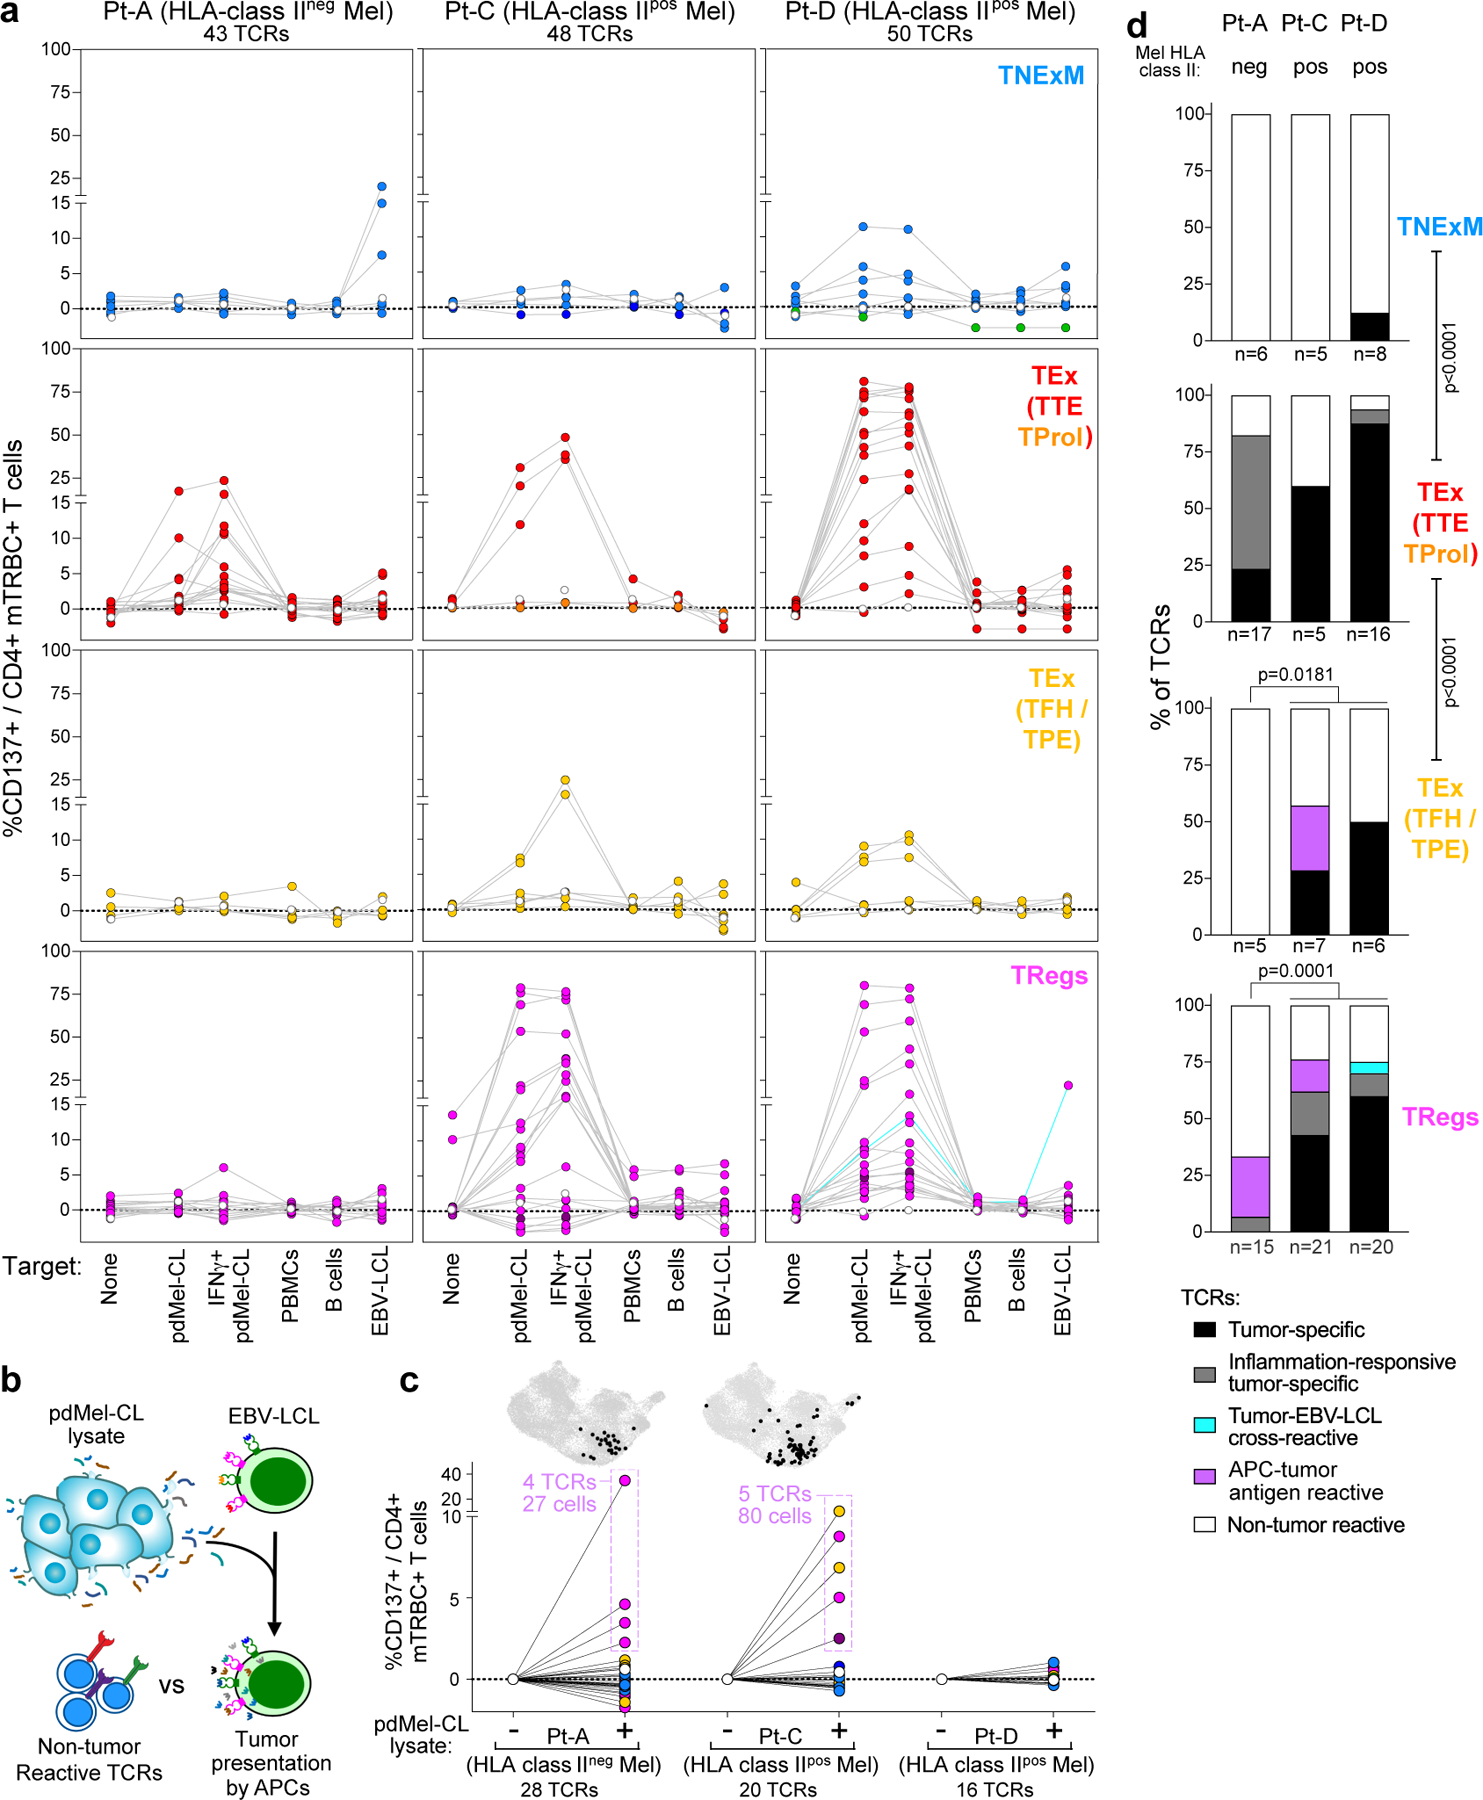
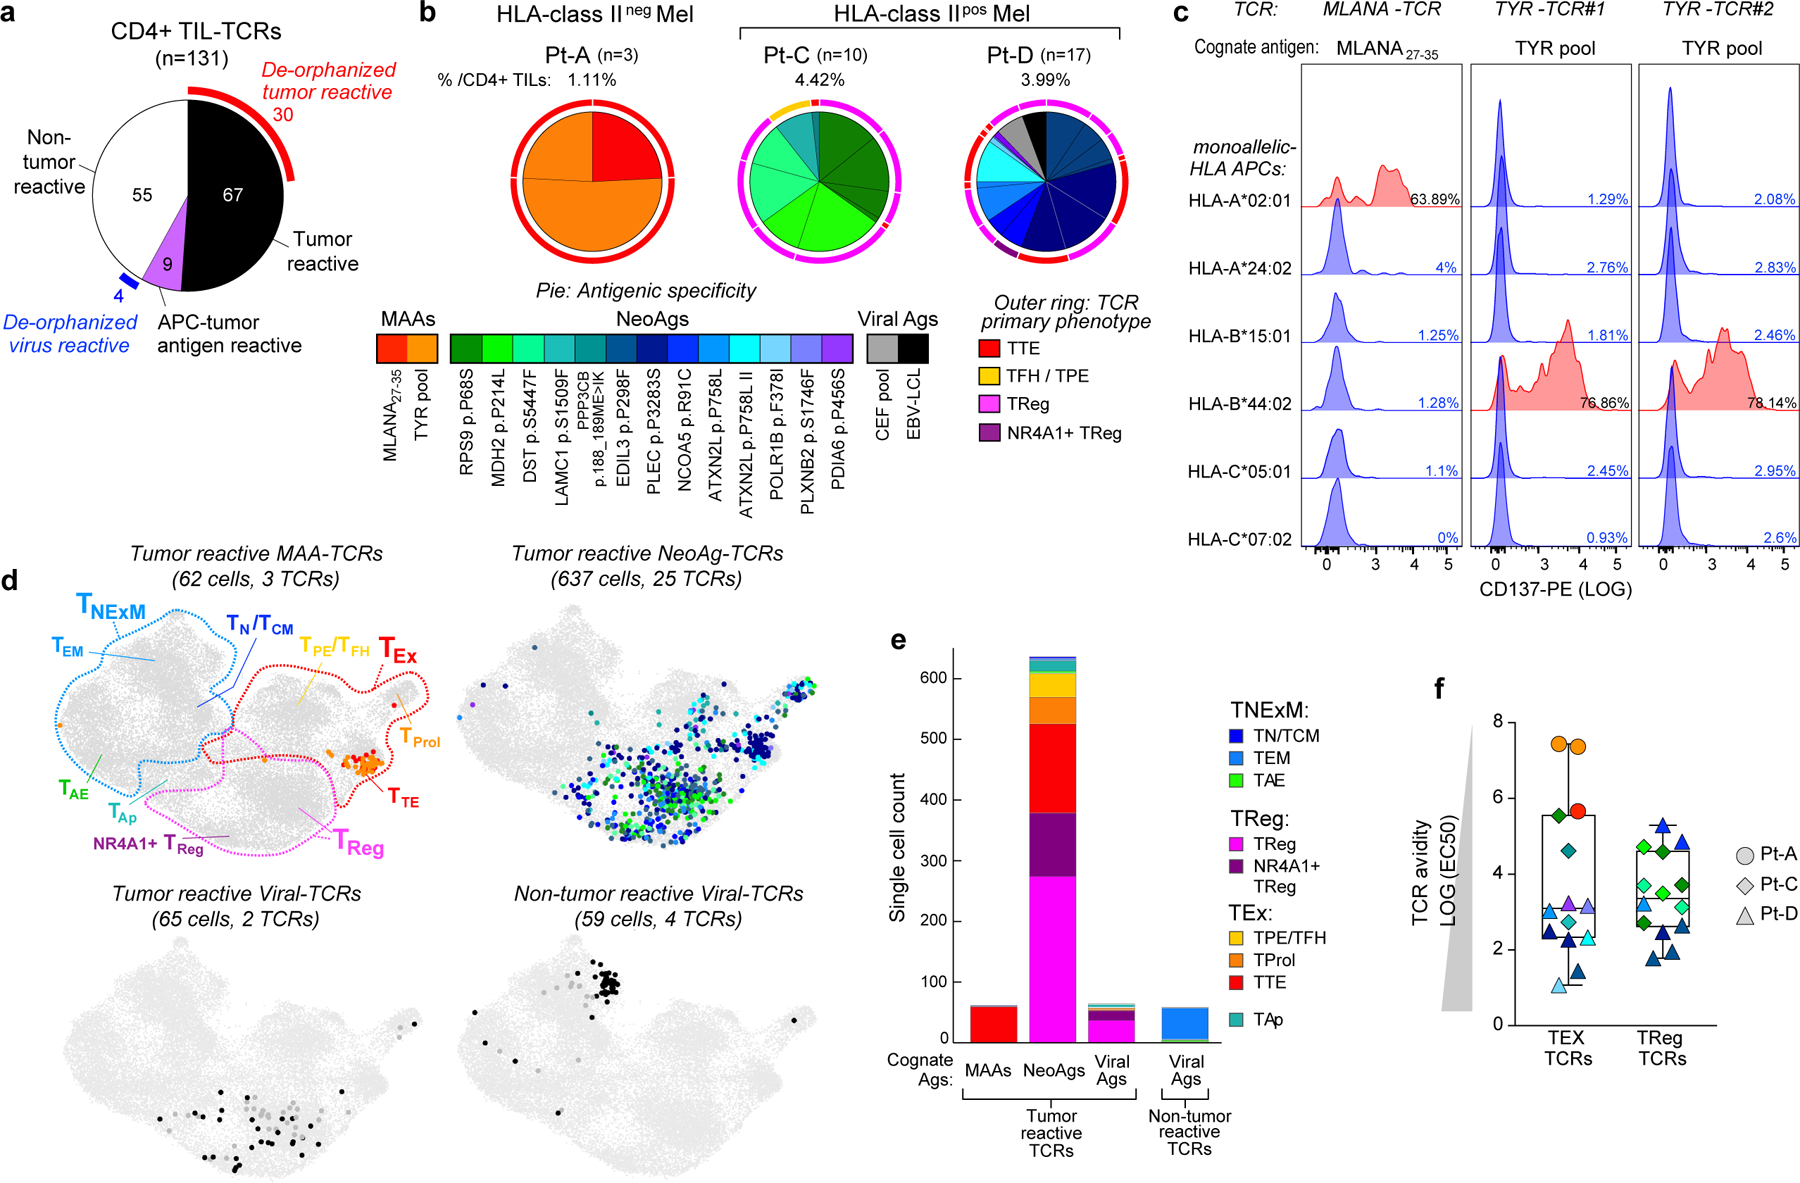
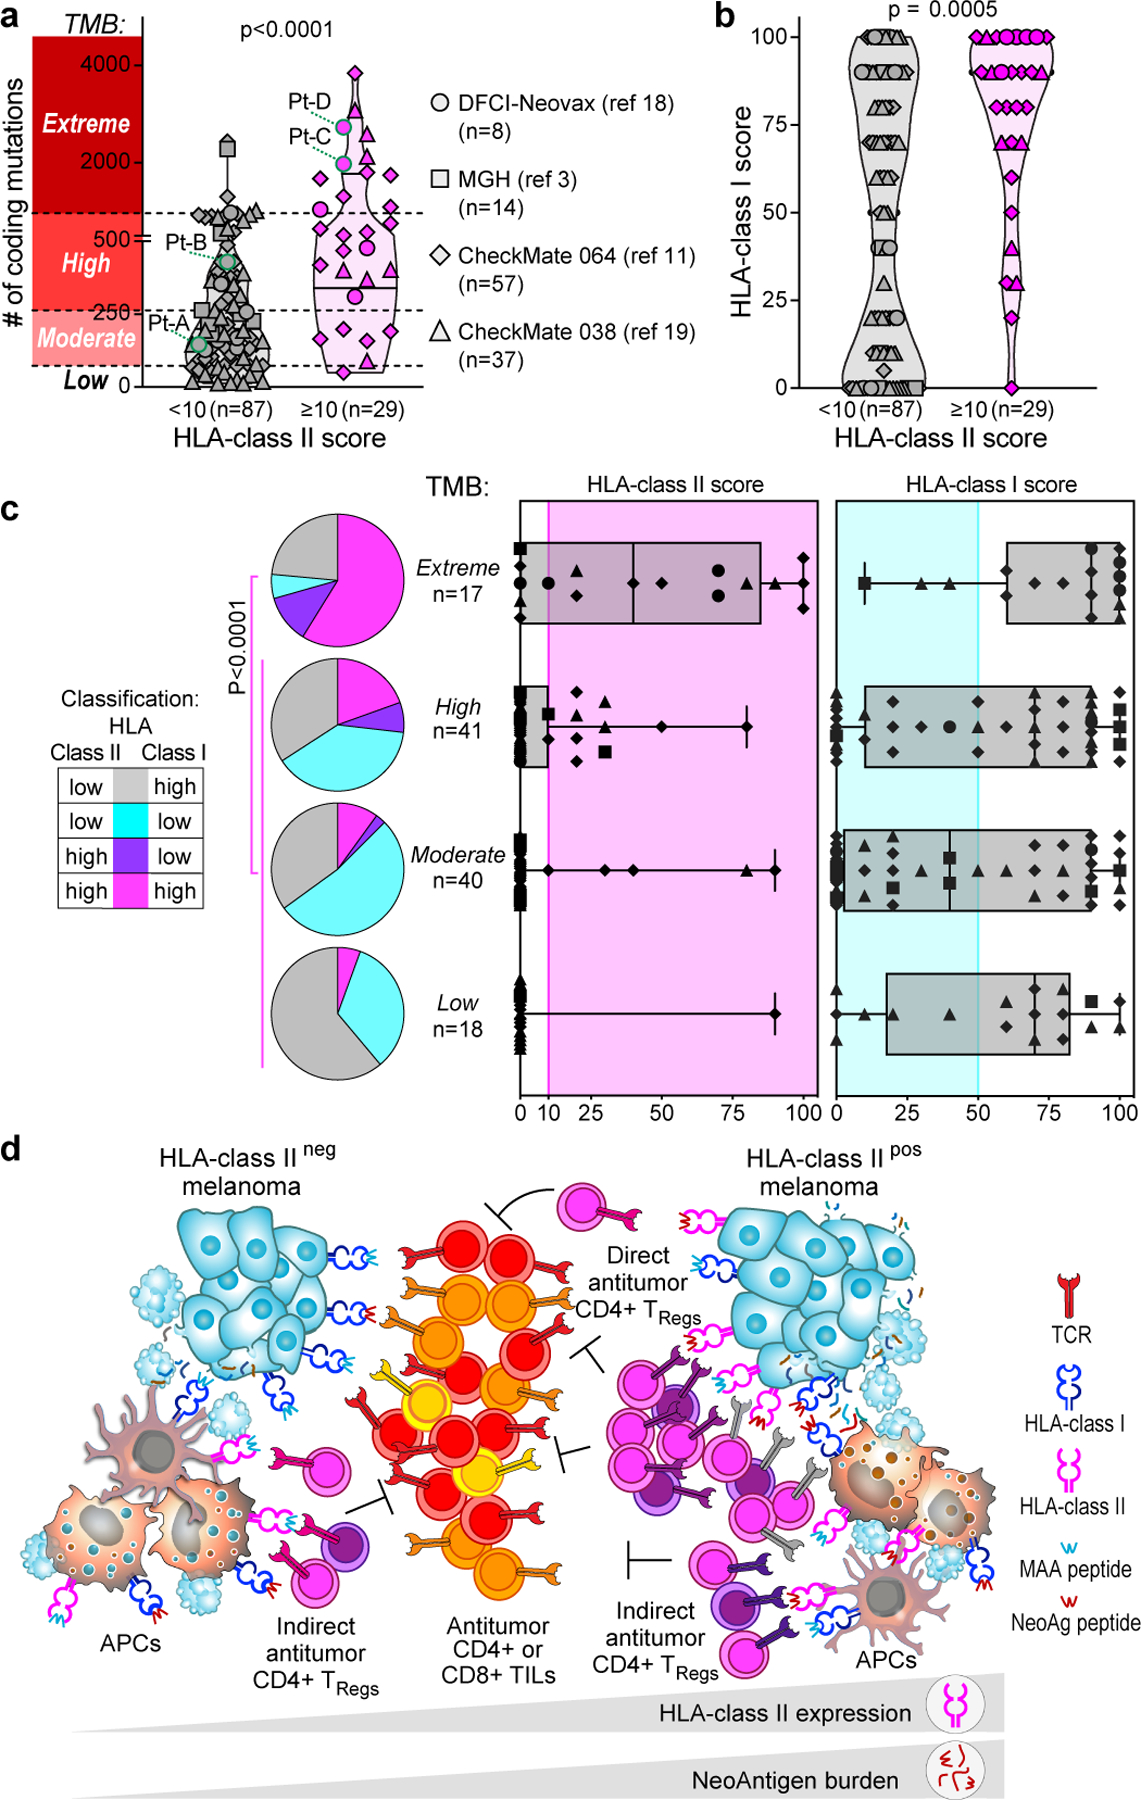
Within the tumour microenvironment, CD4+ T cells can promote or suppress antitumour responses through the recognition of antigens presented by human leukocyte antigen (HLA) class II molecules1,2, but how cancers co-opt these physiologic processes to achieve immune evasion remains incompletely understood. Here we performed in-depth analysis of the phenotype and tumour specificity of CD4+ T cells infiltrating human melanoma specimens, finding that exhausted cytotoxic CD4+ T cells could be directly induced by melanoma cells through recognition of HLA class II-restricted neoantigens, and also HLA class I-restricted tumour-associated antigens. CD4+ T regulatory (TReg) cells could be indirectly elicited through presentation of tumour antigens via antigen-presenting cells. Notably, numerous tumour-reactive CD4+ TReg clones were stimulated directly by HLA class II-positive melanoma and demonstrated specificity for melanoma neoantigens. This phenomenon was observed in the presence of an extremely high tumour neoantigen load, which we confirmed to be associated with HLA class II positivity through the analysis of 116 melanoma specimens. Our data reveal the landscape of infiltrating CD4+ T cells in melanoma and point to the presentation of HLA class II-restricted neoantigens and direct engagement of immunosuppressive CD4+ TReg cells as a mechanism of immune evasion that is favoured in HLA class II-positive melanoma.


Figures

Extended Data Fig. 1 |
Extended Data Fig. 1 |. Characterization of HLA class II expression in melanoma biopsies.
a, UMAP of scRNA-seq data from melanoma-enriched CD45neg cells isolated from tumors obtained from 4 patients with melanoma (Pt-A,B,C,D). Patients’ origin of cells is denoted with colors. Cell types are inferred based on the expression of markers depicted in panels b-c. EC: endothelial cells. b, Single-cell RNA expression of markers associated with non- tumor subpopulations, as reported in. c, Single-cell RNA expression of melanoma-associated markers, which allow identification of melanoma cells within patient-specific clusters. d, e, Single-cell expression of canonical HLA class I (d) and HLA class II (e) transcripts, which demonstrate aberrant HLA class II expression in Pt-C and Pt-D parental tumors. f, Levels of HLA-DR surface expression detected on melanoma cells from 4 patients of the discovery cohorts (Pt-A,B,C,D, corresponding to different symbol shapes). HLA-DR expression is detected on primary melanoma cells through CITE-seq (left, as shown also in Fig. 1c) and on patient-derived melanoma cell lines through flow cytometry (right). Melanomas are classified in HLA class IIpos (magenta) and HLA class IIneg (grey). For Pt-C, two primary biopsies (Pt-C and Pt-C Rel) collected longitudinally have been analyzed. g, Dual chromogenic immunohistochemical (IHC) staining of formalin-fixed paraffin-embedded (FFPE) tumor samples from Pt-B/C/D for HLA class II (brown) and melanoma transcription factor SOX10 (red-pink). For each specimen, the whole slide was assessed for HLA class II expression. Representative low-magnification images of tumors are provided in top images, with blue boxes identifying representative areas (n = 2 repeated acqusitions), as depicted in bottom panels with 20X magnifications. For Pt-C, the same analysis was performed on 2 tumor biopsies collected at 8 months interval, demonstrating the stability of HLA class II pattern of expression in melanoma cells. h, i, Tumor HLA class II expression on independent melanoma specimens (Supplementary Table 3). HLA class II expression was measured by flow cytometry on patient-derived tumor cell lines generated from 17 different patients with melanoma (h). Cell lines are classified as HLA class IIpos (magenta) and HLA class IIneg (grey). For cell lines with available FFPE tissue blocks from parental tumors (Mel-1/7), Dual chromogenic IHC staining was performed (i) using HLA class II (brown) and melanoma SOX10 (red-pink) antibodies. For each specimen, the whole slide was assessed for HLA class II expression. Representative images are displayed. The IHC-stainings document patterns of melanoma HLA class II expression similar to what observed in corresponding cell lines, demonstrating that such feature was constitutive and stably perpetuated in culture in the absence of an inflammatory milieu.
Extended Data Fig. 2 |
Single-cell profiling of CD4+ tumor infiltrating lymphocytes. a, Size and patient distribution of the 10 clusters identified from CD4+TIL scRNA-seq. Left: per cluster, patient origin is denoted by color. Right: UMAPs depicting cluster distribution of patient-specific CD4+TILs. b, Violin plots quantifying relative transcriptional expression of genes (columns) with high differential expression among CD4+TIL clusters (rows). c, Heatmaps depicting the mean cluster expression of a panel of T cell related genes, measured by scRNA-seq (left panel) and the mean surface expression of the corresponding proteins measured through CITE-seq (right panel). Clusters (columns) are labelled using the annotation provided in Fig. 1d; markers (rows) are grouped based on their biological function. Grey - unevaluable markers (CD45 isoforms for scRNA-seq) or which were not assessed (for CITE-seq). CITE- seq CD3 surface expression was poorly detected because of the presence of competing anti-CD3 sorting antibody. d, Characterization of the CD4+TIL clusters using independent reference gene-signatures. Heatmaps show cross-labelling of T cell clusters defined in the present study (columns, reported as in Fig. 1d) versus reference gene-signatures (rows) derived from the analyses in Yost et al., Wu et al. and Oh et al., with intensities indicating normalized frequency. e, UMAPs depicting the single-cell expression of representative T cell markers among CD4+TILs either through detection of surface protein expression with CITE-seq (Ab), or through scRNA-seq (RNA).
Extended Data Fig. 3 |
Extended Data Fig. 3 |. Clonality of CD4+TILs and cell states of TCR clonotypes.
a, Histograms depicting the number (bottom panel) and overall frequency (top panel) of patients’ TCR clonotype families divided in categories based on their size (x axis). b, Histograms showing the intra-cluster TCR clonality, calculated for CD4+ T cells in each cluster (x axis) using normalized Shannon index. Symbols - individual TCR clonality for the 3 patients with high numbers of TILs (Pt-A, Pt-C, Pt-D). Bars - the overall TCR clonality measured within each cluster. c, UMAPs of the cluster distribution of representative dominant TCR clonotype families among CD4+TILs from TIL-rich patients (n = 3). For each patient, numbers denote the ranking of each TCR clonotype (see Fig. 1e), while colors identify their primary cluster (see Fig. 1d). d, Matrix displaying Spearman correlation of normalized cluster distribution of dominant TCR clonotype families composed by ≥4 cells. Colors and area of the circles indicate the strength and significance of the correlation, respectively.
Extended Data Fig. 4 |
Extended Data Fig. 4 |. Antitumor reactivity of in vitro reconstructed TCRs.
a, Schema for classification of TCR reactivities based on CD137 upregulation of TCR transduced T cell lines upon challenge with patient-derived melanoma cells (pdMel-CLs, with or without IFNγ pre-treatment [red]), with controls (PBMCs, B cells and EBV-LCLs [blue]), or with EBV-LCLs pulsed with tumor lysate (purple). b, Representative flow cytometry plots depicting CD137 upregulation measured on CD4+ T cells transduced with TCRs isolated from CD4+ melanoma TILs and cultured with melanoma or control targets. Background reactivity was estimated by measuring CD137 upregulation on CD4+ T cells transduced with an irrelevant TCR. c, TCR reactivities from Pt-B, measured on TCR transduced (mTRBC+) CD4+ lymphocytes cultured alone or with patient- derived target cells. Background activation measured on CD4+ T cells transduced with an irrelevant TCR was subtracted. Each dot-line set represents the behavior of a single TCR; dot colors denote cell states of TCR clonotypes, as delineated in Fig. 1c; white dots show background signal of untransduced CD4+ T cells. d, Cytotoxic potential provided by TCRs isolated from all 4 studied melanoma patients and reconstructed from memory clusters (blue), from TTE and TProl exhausted clusters (red), from TFH/TPE exhausted clusters (yellow) or from TReg clusters (magenta). Degranulation (CD107a/b+) and concomitant production of cytokines (IFNγ, TNFα and IL-2) were assessed through intracellular staining, gating on TCR-transduced (mTRBC+) CD4+ T cells cultured alone or in the presence of autologous melanoma (pdMel-CLs). Each dot represents the result for a single TCR isolated from CD4+TILs, color-coded based to its primary phenotypic cluster (as defined in Fig. 1d). For each analyzed TCR, background cytotoxicity from CD4+ T cells transduced with an irrelevant TCR was subtracted. White dots - basal level of activation of untransduced cells. Overall, these data indicate that antitumor cytotoxicity mainly resides among TCR clonotypes with exhausted and regulatory primary clusters.
Extended Data Fig. 5 |
Extended Data Fig. 5 |. Peripheral blood phenotype and distribution of CD4+ intratumoral TCR clonotypes.
a, Schema for analysis of peripheral blood distribution and phenotype of CD4+ intratumoral clonotypes. PBMCs collected at pre-treatment timepoints from 4 melanoma patients in the discovery cohort were FACS-sorted to isolate CD4+ fractions enriched in T Naïve, T Memory, T Effectors and T Regulatory cells. FACS-plots show the sorting strategy for a representative patient (Pt-A). In parallel, an aliquot of PBMCs was analyzed with intracellular flow-cytometry using the same panel of antibodies with the addition of FOXP3 marker, to confirm enrichment of FOXP3+ cells within the CD4+TReg fraction. Bulk sequencing of TCRβ-chains was performed on sorted CD4+ subpopulation to detect the TCRβ-chains of CD4+TIL-TCR clonotype families (with >1 cell). This allowed to trace in the peripheral blood the TCR clonotypes with different intratumoral phenotypes. b, Peripheral blood frequencies of CD4+TIL-TCR clonotypes. TCR clonotype families detected amongst CD4+TILs and with different primary clusters (TNExM, TEx: TTE+TProl, TEx: TFH/TPE, TRegs) were traced in peripheral blood, as depicted in a. The frequency of each TCR clonotype among circulating CD4+ T cells was reconstructed by taking into account the frequencies of CD4+ subpopulations (determined by FACS-sorting) and the frequencies of each TCRβ-chain within each CD4 fraction (determined by bulk TCRseq). For each patient, the proportion of CD4+TIL-TCRs detected in blood is summarized with pies below each graph. c, Peripheral blood phenotype of CD4+TIL TCRs. The graphs show the distribution among 4 FACS-sorted fractions of circulating CD4+ T cells for each CD4+TIL-TCR traced in peripheral blood by bulk TCRseq. The TIL-TCR clonotypes are divided based on their intratumoral primary cluster (rows: TNExM, TEx: TTE+TProl, TEx: TFH/TPE, TRegs) and based on the patient of origin (x axis). TCRβ-chains corresponding to TCR clonotypes reconstructed in vitro are pointed with arrows and labeled based on classification of their reactivity as reported in the legend.
Extended Data Fig. 6 |
Extended Data Fig. 6 |. Antigen specificity of CD4+ tumor-reactive TCRs.
a, Antigen specificity screening of 76 CD4+TCRs with direct or indirect tumor recognition. Upregulation of CD137 was assessed by flow-cytometry on CD4+ T cells transduced with previously identified tumor-specific or APC-tumor antigen reactive TCRs. Antigen recognition was tested upon culture with autologous EBV-LCLs pulsed with pools of peptides corresponding to immunogenic neoantigens (NeoAgs) predicted to bind patients’ HLA class I or II restrictions or detected through Mass-spectrometry (MS) within the HLA class II immunopeptidome (see Supplementary Table 6), known melanoma associated antigens (MAAs) or immunogenic viral epitopes (CEF pools). Reactivity was also assessed against an irrelevant long peptide (Ova II) or in the presence of polyclonal stimulators (PMA/ionomycin) as negative and positive controls, respectively. Background, assessed using DMSO-pulsed target cells, was subtracted from each condition. Colored dots – confirmed antigen- reactive TCRs, colored based on highest reactivity against a particular antigen, as per the legend, compared to the other tested antigens; white dots – TCRs reactive against an antigen which was not the highest of the panel of antigens tested, and hence considered a cross-reactive response; grey dots - negative responses. b, Deconvolution of antigen specificity of TCRs reactive to NeoAg- peptide pools. Colored dots indicate the deconvoluted cognate antigens, with antigens corresponding to colors represented in panel c. c, Distribution of antigen specificities of tumor reactive CD4+TCRs per patient successfully deorphanized after screening. Colors denote the distinct peptides recognized by individual TCRs.
Extended Data Fig. 7 |
Extended Data Fig. 7 |. Characterization of HLA class I restricted CD4+TILs.
a, Levels of CD4/CD8 transcripts (left, detected by scRNA-seq) or surface proteins (right, detected by CITE-seq) expressed by single cells with CD4+HLA class I restricted TCRs specific for MLANA (n = 1) or TYR (n = 2) isolated from Pt-A. The data indicate that the 3 clonotype families belong to CD4+TILs, despite their reactivity to HLA class I restricted epitopes. b, Flow cytometric plot depicting peptide-HLA binding of T cells transduced with MLANA27–35- specific TCR (red), isolated in CD4+TILs from Pt-A. Transduced T cells comprising CD4+ and CD8+ (CD4) lymphocytes were stained using HLA-A*02:01 dextramers loaded with MLANA26–35 heteroclitic peptide (ELAGIGILTV). Untransduced T cells (grey) are shown as control. The similar level of binding exhibited by CD4+ and CD8+ T cells demonstrates that tested HLA class I TCR act independently from CD4/CD8 co-stimulation. c, Flow cytometry tracing of MLANA-specific HLA class I restricted CD4+ T cells in Pt-A TILs. Plots depict identification of CD4+ or CD8+ cells within CD3+ TILs from Pt-A (left) and binding to HLA-A*02:01 dextramers loaded with MLANA26–35 heteroclitic peptide among CD4+ or CD8+ TILs (right). Frequencies of each population are provided (blue), demonstrating reliable detected of HLA class I restricted CD4+TILs. d, Phenotype of MLANA-specific HLA class I restricted CD4+TILs from Pt-A. Heatmaps show transcript levels detected by scRNA-seq (top), surface protein expression measured by CITE-seq (middle) or flowcytometry (bottom) for CD4+ T cells with TCRs specific for HLA-A*02:01- MLANA26/27–35 complexes. As comparison, the same analysis was performed on CD8+ TILs specific for the same antigen-HLA (as identified in) or detected by flow cytometry (as depicted in panel c). Markers detected with all the 3 technologies are shown (exhaustion markers: PD-1, CD39, LAG3; regulatory marker: CD25; memory markers: CD127, CD45RA, CD127). For scRNA-seq (top) transcripts related to effector molecules are reported. Grey color: values not available. This analysis shows that HLA class I restricted CD4+TILs specific for MLANA display an exhausted and cytotoxic phenotype similar to the one of CD8+ TILs. e, Cytotoxicity of HLA-class I-restricted CD4+TILs. Degranulation (CD107a/b upregulation) measured in vitro on MLANA-specific HLA-A*01:02 restricted CD4+ or CD8+ T cells, identified in TILs from Pt-A as depicted in c. Cells were cultured in the absence (left) or presence (right) of autologous melanoma for 6 h. HLA-class I restricted CD4+TILs specific for MLANA antigen (bottom raw) exhibited degranulation levels comparable to those observed for CD8+ counterparts (top raw), demonstrating their ability to mediate cytotoxicity.
Extended Data Fig. 8 |
Extended Data Fig. 8 |. Avidities of CD4+ MAA/NeoAg-TCRs.
a, Avidity of de- orphanized TCRs with MAA or NeoAg specificity (n = 3 and n = 23 respectively). TCR-dependent CD137 upregulation was measured on TCR-transduced (mTRBC+) CD4+ cells upon culture with patient-derived EBV-LCLs pulsed with increasing concentrations of the cognate antigen (MAAs in the top panels, NeoAgs in bottom panels). Background activation measured on CD4+ T cells transduced with an irrelevant TCR was subtracted. Reactivity to DMSO-pulsed targets (0) and autologous melanoma (pdMel-CL) are reported on the left; for NeoAg-specific TCRs, the dashed lines report reactivity against wildtype peptides. A color legend depicts the different cognate antigens targeted by the deorphanized TCRs and specifies the number of TCRs able to recognize each cognate antigen and the patient the TCR belongs to. b, EC50 calculated from titration curves of MAA or NeoAg-specific TCRs (n = 3 and n = 23 respectively); note that high EC50 values correspond to low TCR avidities. Means with SD are reported, with TCR numbers corresponding to those reported in a. c, Expression levels of MAA or NeoAg transcripts (from bulk RNAseq of pdMel- CLs) from which the analyzed epitopes are generated, as a measure of cognate peptide abundance in tumor cells. Columns show means values with s.d. of values from n = 4 pdMel-CLs (symbols). d, Correlation between the avidity of antitumor CD4+TCRs (y axis) and target abundance (x axis), as measured by RNA expression of TCR-targeted genes detected in the autologous pdMel-CLs and expressed as transcripts per million mapped reads (TPM). Values for TCR avidity represent averages of EC50 data presented in b. The correlation is measured on de-orphanized antitumor CD4+TCR specificities with intratumoral TEx (top) or TReg (bottom) primary clusters, as showed in Fig. 3b, f. Significance of each linear regression is reported within each panel. Symbols: patients from whom TCRs were identified. Colors: cognate antigens of antitumor TCRs, as depicted in a.
Extended Data Fig. 9 |
Extended Data Fig. 9 |. Quantification of TILs and clinical outcome of patients with melanoma.
a, b, Quantification of CD8+ (a) and CD4+ (b) TILs detected in tumor specimens from patients reported in cohorts from published studies,,. TILs were quantified in tumor areas using immunohistochemical or immunofluorescence stainings (see Supplementary Information). Only patients with available tumor FFPE were analyzed (n indicated in the legends). Values from patients included in the discovery cohort are labeled (specimens from Pt-A were not available for this analysis). Melanoma were classified based on HLA class II expression, scored on tumor cells by IHC (≥ or < 10% of tumor cells with positive staining). Patients from each study are denoted by different symbol shapes (as reported in each legend, with number of patients for each cohort). Horizontal lines show median (bold) and quartiles values; p-values indicate the significance of comparisons calculated using Mann-Whitney test. c–f, Clinical outcome of patients with melanoma, classified based on tumor HLA class II expression (c, d) or based on classes of tumor mutation burden (e, f), as defined in Fig. 4a and indicated in each color legend. Kaplan-Meier curves estimate the overall survival (c, e) and progression-free survival (d, f) of patients with melanoma from 4 published studies,,,. Only patients with available overall survival or progression-free survival after treatment with immunotherapies have been analyzed (see Supplementary Table 8). For each category, number of analyzed patients is reported within the legends. P-values indicate the significance of comparison between Kaplan-Meier curves, as obtained using Log-rank Mantel-Cox test between 2 groups (c, d) or 4 groups (e, f).
Extended Data Fig. 10 |
Extended Data Fig. 10 |. Analysis of HLA class II expression in cancer cell lines.
a, Tumor mutation burden (top panel) with HLA class I and HLA class II expression scores (middle and bottom panels) of 927 human cancer cell lines. HLA class I and II scores have been calculated from RNAseq as described in the Material and Methods section. Colored areas denote downregulation of HLA class I (turquoise) and upregulation of HLA class II (pink). Each tumor type is indicated using the corresponding abbreviation from TCGA (x axis). The number of tested cancer cell lines for each tumor type is reported (top). Bars depict mean values with s.d. Compared to hematopoietic tumors, melanoma (SKCM) represents the sole solid cancer with a relevant number of HLA class IIpos cell lines (red arrow). b, Volcano plot showing RNA transcripts deregulated upon comparison of HLA class IIpos (n = 18) and HLA class IIneg (n = 36) melanoma cell lines (Mel-CLs). Significantly upregulated or downregulated genes (log2FC≥ 2 or log2FC≤ −2, adj-p.value ≤ 0.01) are colored in red or blue respectively. HLA class II related genes are labeled; Upregulated genes previously associated with de-differentiated melanoma,, are highlighted in green. c, Top 20 gene ontology processes enriched in transcripts upregulated in HLA class IIpos Mel-CLs. HLA class II related genes were excluded from this analysis. Bars depict enrichment, as calculated using two-sided Fisher’s exact test. Processes related to differentiation of central nervous system are colored in green, while processes related to remodeling of interactions with cells or extracellular matrix are highlighted in yellow. Enrichment in such gene- ontologies, characteristic of neural-crest-like tumors,,, in HLA class IIpos melanoma confirm that HLA class II expression is peculiar of de-differentiated melanoma. No significant deregulation of genes derived from HLA class II RNA- interference screens was observed.
Fig. 1 |
Fig. 1 |. Melanoma HLA class II expression and phenotype of CD4+ TIL TCR clonotypes.
a, Schematic of processing and single-cell sequencing analysis of melanoma samples. b, Flow cytometric assessment of HLA class II expression in 4 pdMel-CLs under basal culture conditions (magenta) or on exposure to IFNγ for 72 h (purple), compared with isotype control (grey). c, Uniform manifold approximation and projection (UMAP) of scRNA-seq data from tumour-enriched CD45− cells isolated from melanomas from four patients. Clusters of patients’ melanoma cells (Mel) were inferred on the basis of markers reported in Extended Data Fig. 1a–c. Colour indicates surface HLA-DR expression as determined by CITE-seq. d, UMAP of inferred cell states from scRNA-seq data of CD4+ TILs. Right, CD4+ TILs on the same UMAP, annotated for intra-patient TCR-clone frequency (defined by scTCR-seq). Bottom right, cluster frequencies among CD4+ TILs from the four patients. e, Cluster distribution of the top 100 CD4+ TCR clonotype families from melanomas from the four patients. Colours indicate cell states, as delineated in d.
Fig. 2 |
Fig. 2 |. Tumour reactivity of TCRs from CD4+ TIL.
a, Reactivity of the dominant TCRs cloned from CD4+ TILs with TNExM, TEx (divided into TTE/TProl and TFH/TPE) or TReg phenotypes in three patients with melanoma. CD137 upregulation was measured on TCR-transduced (mTRBC+) CD4+ T cells cultured alone (no target) or in the presence of autologous pdMel-CLs (with or without IFNγ pre-treatment) or controls (PBMCs, B cells or EBV-LCLs). Background reactivity of an irrelevant TCR was subtracted (examples in Extended Data Fig. 4b). Dotted lines show behaviour of individual TCRs; dot colours correspond to the phenotypes of TCR clonotypes shown in Fig. 1d; open dots show the signal of untransduced cells and turquoise lines show tumour- and EBV-LCL-cross-reactive TCR. Reactivity of TCRs obtained from Pt-B in Extended Data Fig. 4c. b, Workflow for testing indirect antitumour reactivity: autologous APCs (EBV-LCLs) were pulsed with tumour lysates from pdMel-CLs and used to challenge 64 TCRs that did not exhibit direct tumour recognition, as evaluated in a (from Pt-A, Pt-C and Pt-D). c, TCR reactivity against tumour antigens presented by APCs, measured as upregulation of CD137. PBS-pulsed targets were used as background controls. Dot colours correspond to the phenotypes of TCR clonotypes shown in Fig. 1d. Reactive TCRs were traced (outlined in purple) in CD4+ TILs (corresponding to the UMAP in Fig. 1c), to depict abundance and cluster distribution of corresponding TCR clonotypes (top, black dots). d, Summary of CD4+ TIL TCR reactivity as measured in a and c for three patients (Pt-A, Pt-C and Pt-D) and classified as detailed in Extended Data Fig. 4a. Percentages of TCR classes are shown for four different CD4+ phenotypes. Labels below the x-axis show the number of tested TCRs. two-sided Fisher’s exact test on total numbers of TCRs with direct antitumour activity (black or grey) tested in each phenotypic compartment, or in HLA class IIpos (Pt-C and Pt-D) vs HLA class IIneg (Pt-A) melanomas.
Fig. 3 |
Fig. 3 |. Antigen specificity of TCRs from CD4+ TILs.
a, Pie chart summarizing the classification of 131 CD4+ TIL TCRs tested for antigen specificity in melanomas from 3 patients (Pt-A, Pt-C and Pt-D). Partial outer ring indicates TCRs with detected antigen specificity (that is, de-orphanized). b, Cognate antigens of de-orphanized antitumour TIL TCRs, showing the relative frequency of CD4+ TCR-clonotypes with MAA, neoantigen or viral antigen specificity. Numbers and total frequencies of tested TCR clonotypes among CD4+ TILs are reported above each chart. Pie colours indicate the cognate antigens of the TCR; the outer ring colours show the primary phenotype of the clonotypes. c, Deconvolution of HLA class I restriction of 3 de-orphanized tumour-specific CD4+ TCRs from Pt-A. Flow cytometry histograms depict CD137 upregulation measured on CD4+ T cells transduced with TCRs reactive to MLANA27–35 peptide (n = 1, left) or to TYR peptide pool (n = 2, right). TCRs were tested against their cognate antigen, presented by APCs stably transformed with single HLA class I alleles from Pt-A (rows). Red histograms show HLA class I restrictions capable of triggering TCR reactivity upon binding of cognate antigens. d, UMAPs of CD4+ TILs bearing antitumour TCRs specific for MAAs, neoantigens or viral antigens, or non tumour-reactive TCRs specific for viral antigens. Dot colours indicate TCR antigenic specificity corresponding to the scheme in b. TIL phenotypic clusters are delineated within the first UMAP as reference. e, Cell counts of de-orphanized tumour-reactive or non tumour-reactive CD4+ TCR clonotypes specific for different types of cognate antigens (MAAs, neoantigens and viral antigens). Colours show cell states, as inferred by scRNA-seq (Fig. 1c). f, Comparison of avidities of de-orphanized antitumour TIL TCRs with TEx (n = 14) or TReg (n = 14) phenotypes. Dot colours show TCR cognate antigens; colour scheme as in b. The shapes indicate the patient in whom the TCRs were detected. Whiskers extend from minimum to maximum values; horizontal bars represent the median and boxes encompass 25th–75th percentiles.
Fig. 4 |
Fig. 4 |. Relationship between HLA expression and mutation burden in melanoma.
a, b, Number of coding mutations (from tumour bulk-sequencing analysis) (a) and HLA class I scores (from IHC) (b) detected in patients with melanoma from four previous studies,,,; the same shapes represent the studies throughout the figure. Melanomas were classified on the basis of HLA class II expression, scored on tumours by IHC (≥10% or < 10% of SOX10+ melanoma cells). Horizontal lines represent the median (bold) and quartiles;P two-sided Mann–Whitney test. Melanomas were divided in four groups on the basis of the TMB (y-axis in a): low, below 15th percentile; moderate, 15th percentile to median; high, median to 85th percentile; extreme, above 85th percentile. c, Tumour HLA class I (top) and HLA class II (bottom) scores determined by IHC of 116 melanoma specimens with different TMB ranges, as established in a. Pink area indicates HLA class II upregulation (IHC score ≥ 10%) and turquoise area indicates HLA class I downregulation (IHC score ≤ 50%). Whiskers extend to minimum and maximum values, horizontal bars show the median and boxes encompass 25th–75th percentiles. Pie charts show the proportion of melanomas classified on the basis of HLA class I and class II expression for each TMB category. P-value for enrichment of HLA class IIpos cases in the extreme TMB group versus non-extreme TMB groups (two-sided Fisher’s exact test). d, Proposed mechanism of HLA class II-driven immune evasion in melanoma: as well as being able to the indirectly elicit CD4+ responses through APCs, HLA class IIpos melanoma with extreme TMB can directly trigger and expand immunosuppressive TReg cell clones (delineated by different TCR colours) through exposure of HLA class II–neoantigen complexes.

Comment in

References

    1. Sallusto F & Lanzavecchia A Heterogeneity of CD4+ memory T cells: functional modules for tailored immunity. Eur. J. Immunol 39, 2076–2082 (2009). - PubMed
    1. Swain SL, McKinstry KK & Strutt TM Expanding roles for CD4+ T cells in immunity to viruses. Nat. Rev. Immunol 12, 136–148 (2012). - PMC - PubMed
    1. Sade-Feldman M et al. Defining T cell states associated with response to checkpoint immunotherapy in melanoma. Cell 175, 998–1013.e20 (2018). - PMC - PubMed
    1. Yost KE et al. Clonal replacement of tumor-specific T cells following PD-1 blockade. Nat. Med 25, 1251–1259 (2019). - PMC - PubMed
    1. Wu TD et al. Peripheral T cell expansion predicts tumour infiltration and clinical response. Nature 579, 274–278 (2020). - PubMed