

Molecular Visualization of Early-Stage Acute Kidney Injury with a DNA Framework Nanodevice
- PMID: 35508712
- PMCID: PMC9284180
- DOI: 10.1002/advs.202105947
Molecular Visualization of Early-Stage Acute Kidney Injury with a DNA Framework Nanodevice
Abstract
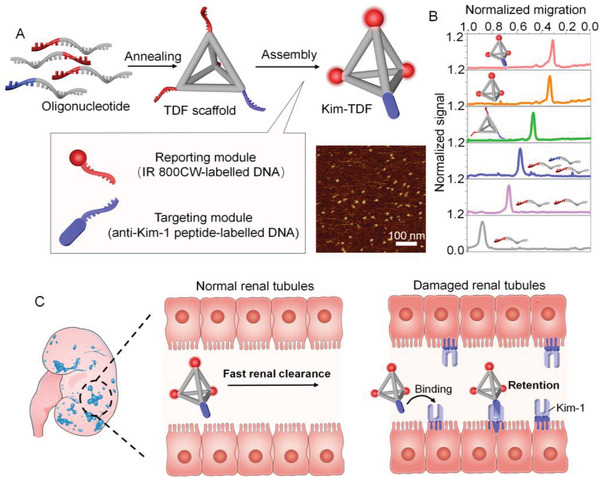
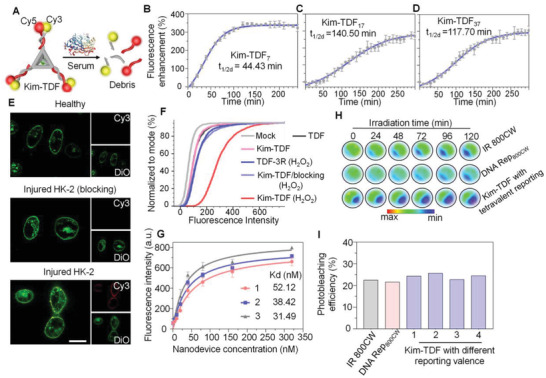
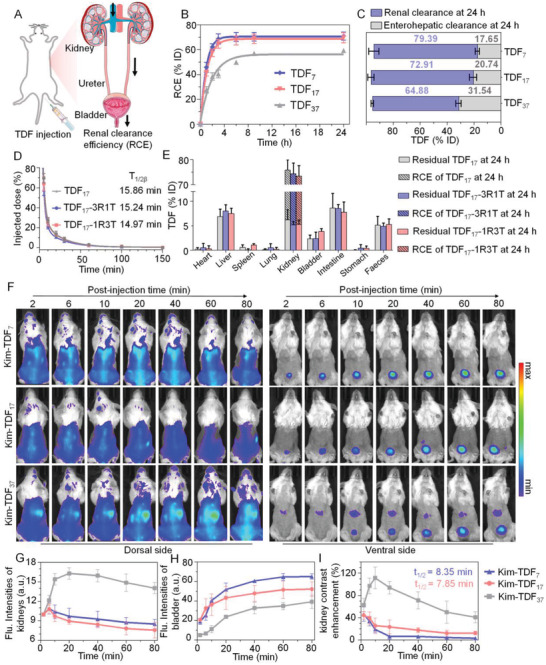
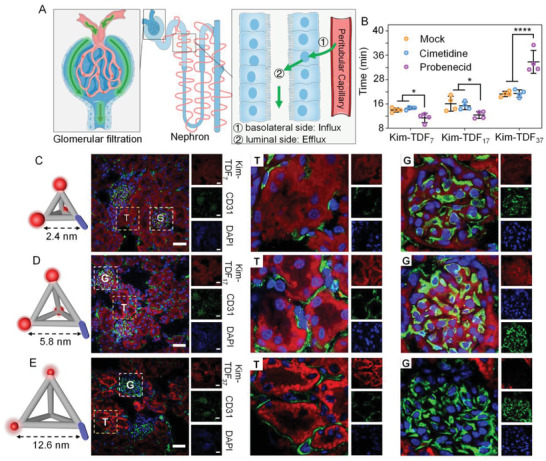
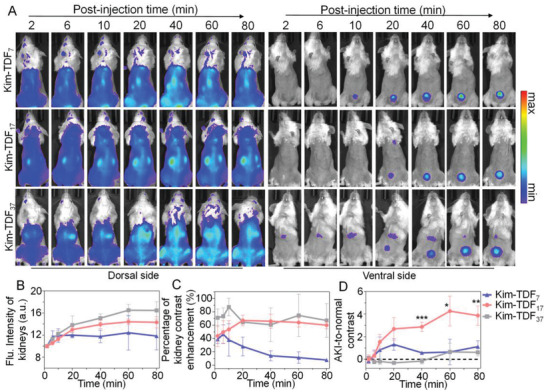
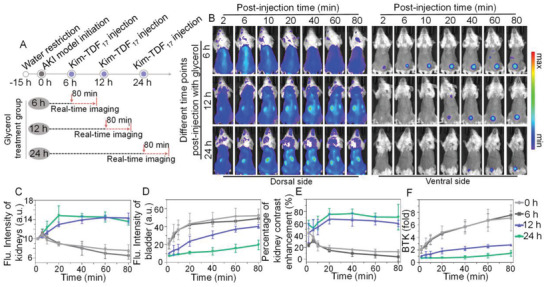
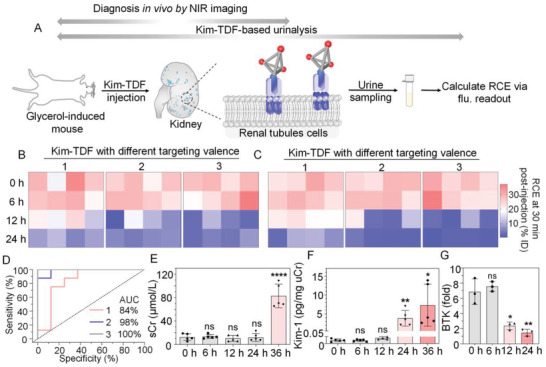
DNA nanomachines with artificial intelligence have attracted great interest, which may open a new era of precision medicine. However, their in vivo behavior, including early diagnosis and therapeutic effect are limited by their targeting efficiency. Here, a tetrahedral DNA framework (TDF)-based nanodevice for in vivo near-infrared (NIR) diagnosis of early-stage AKI is developed. This nanodevice comprises three functional modules: a size-tunable TDF nanostructure as kidney-targeting vehicle, a binding module for the biomarker kidney injury molecule-1 (Kim-1), and a NIR signaling module. The cooperation of these modules allows the nanodevice to be selectively accumulated in injured kidney tissues with high Kim-1 level, generating strong NIR fluorescence; whereas the nanodevice with the proper size can be rapidly cleared in healthy kidneys to minimize the background. By using this nanodevice, the early diagnosis of AKI onset is demonstrated at least 6 h ahead of Kim-1 urinalysis, or 12 h ahead of blood detection. It is envisioned that this TDF-based nanodevice may have implications for the early diagnosis of AKI and other kidney diseases.
Keywords: DNA nanodevice; acute kidney injury; early diagnosis; kidney injury molecule-1; tetrahedral DNA framework.
© 2022 The Authors. Advanced Science published by Wiley-VCH GmbH.
Conflict of interest statement
The authors declare no conflict of interest.
Figures
Similar articles
-
Sequential Therapy of Acute Kidney Injury with a DNA Nanodevice.Nano Lett. 2021 May 26;21(10):4394-4402. doi: 10.1021/acs.nanolett.1c01044. Epub 2021 May 17. Nano Lett. 2021. PMID: 33998787
-
Does the kidney injury molecule-1 predict cisplatin-induced kidney injury in early stage?Ann Clin Biochem. 2015 Jan;52(Pt 1):88-94. doi: 10.1177/0004563214528312. Epub 2014 Mar 26. Ann Clin Biochem. 2015. PMID: 24670880
-
Assessment of urinary kidney injury molecule-1 and interleukin-18 in the early post-burn period to predict acute kidney injury for various degrees of burn injury.BMC Nephrol. 2015 Aug 18;16:142. doi: 10.1186/s12882-015-0140-3. BMC Nephrol. 2015. PMID: 26283194 Free PMC article.
-
The Predictive Role of the Biomarker Kidney Molecule-1 (KIM-1) in Acute Kidney Injury (AKI) Cisplatin-Induced Nephrotoxicity.Int J Mol Sci. 2019 Oct 22;20(20):5238. doi: 10.3390/ijms20205238. Int J Mol Sci. 2019. PMID: 31652595 Free PMC article. Review.
-
Biomarkers in acute kidney injury - pathophysiological basis and clinical performance.Acta Physiol (Oxf). 2017 Mar;219(3):554-572. doi: 10.1111/apha.12764. Epub 2016 Aug 25. Acta Physiol (Oxf). 2017. PMID: 27474473 Free PMC article. Review.
Cited by
-
Ultrasmall Nanodots with Dual Anti-Ferropototic Effect for Acute Kidney Injury Therapy.Adv Sci (Weinh). 2024 Oct;11(39):e2403305. doi: 10.1002/advs.202403305. Epub 2024 Aug 19. Adv Sci (Weinh). 2024. PMID: 39159052 Free PMC article.
-
An enzymatic cleavage-triggered minimally invasive nanosensor for urine-based detection of early atherosclerosis.Sci Adv. 2025 Mar 14;11(11):eadu7614. doi: 10.1126/sciadv.adu7614. Epub 2025 Mar 14. Sci Adv. 2025. PMID: 40085714 Free PMC article.
-
Mackinawite nanozymes as reactive oxygen species scavengers for acute kidney injury alleviation.J Nanobiotechnology. 2023 Aug 19;21(1):281. doi: 10.1186/s12951-023-02034-7. J Nanobiotechnology. 2023. PMID: 37598162 Free PMC article.
-
Screening and Identification of Novel DNA Aptamer for Targeted Delivery to Injured Podocytes in Glomerular Diseases.Adv Sci (Weinh). 2025 May;12(20):e2412356. doi: 10.1002/advs.202412356. Epub 2025 Apr 3. Adv Sci (Weinh). 2025. PMID: 40178289 Free PMC article.
-
Visualization of the hepatic and renal cell uptake and trafficking of tetrahedral DNA origami in tumour.Cell Prolif. 2024 Aug;57(8):e13643. doi: 10.1111/cpr.13643. Epub 2024 Apr 4. Cell Prolif. 2024. PMID: 38572799 Free PMC article.
References
-
- a) Manzari M. T., Shamay Y., Kiguchi H., Rosen N., Scaltriti M., Heller D. A., Nat. Rev. Mater. 2021, 6, 351; - PMC - PubMed
- b) Riley R. S., June C. H., Langer R., Mitchell M. J., Nat. Rev. Drug Discovery 2019, 18, 175; - PMC - PubMed
- c) Mitchell M. J., Billingsley M. M., Haley R. M., Wechsler M. E., Peppas N. A., Langer R., Nat. Rev. Drug Discovery 2021, 20, 101. - PMC - PubMed
-
- a) Jiang D., Ge Z., Im H.‐J., England C. G., Ni D., Hou J., Zhang L., Kutyreff C. J., Yan Y., Liu Y., Cho S. Y., Engle J. W., Shi J., Huang P., Fan C., Yan H., Cai W., Nat. Biomed. Eng. 2018, 2, 865; - PMC - PubMed
- b) Chen Q., Ding F., Zhang S., Li Q., Liu X., Song H., Zuo X., Fan C., Mou S., Ge Z., Nano Lett. 2021, 21, 4394. - PubMed
Publication types
MeSH terms
Substances
Grants and funding
LinkOut - more resources
Full Text Sources
Miscellaneous