

The effect of adding real-world evidence to regulatory submissions on the breadth of population indicated for rare disease medicine treatment by the European Medicines Agency
- PMID: 35509059
- PMCID: PMC9069778
- DOI: 10.1186/s40545-022-00433-z
The effect of adding real-world evidence to regulatory submissions on the breadth of population indicated for rare disease medicine treatment by the European Medicines Agency
Abstract
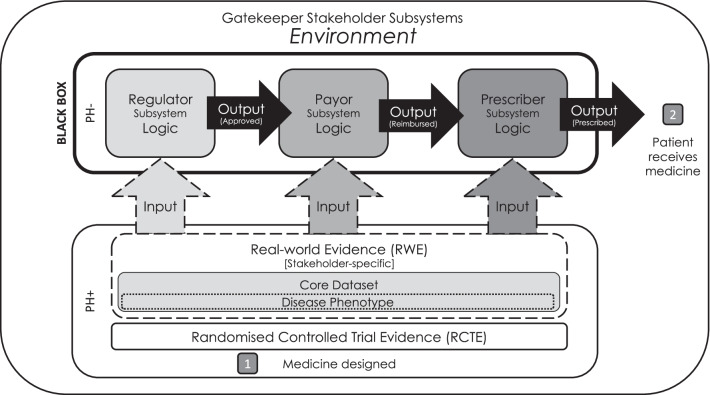
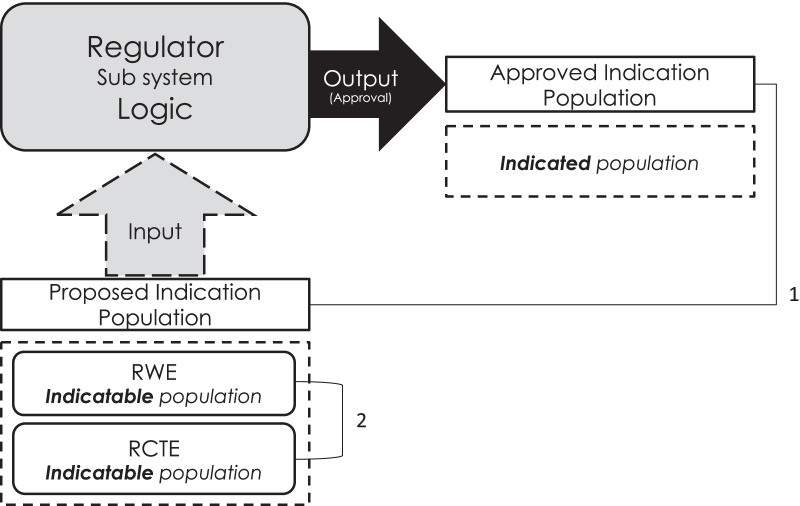
Background: Despite calls for the use of additional real-world evidence (RWE) during drug development, rates of inclusion at the regulatory stage remain low. The medicine adoption model suggests that providing additional RWE to regulators would result in a wider indicated population than providing randomised-controlled trial evidence (RCTE) alone. Here, we tested this hypothesis.
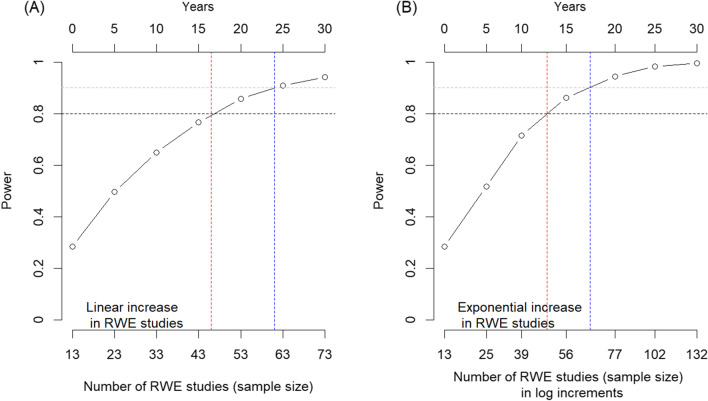
Methods: All engagements concerning the 88 orphan drugs approved between 2009 and 2019 on the European Medicines Agency Orphan Register were reviewed between September and December 2019. Engagements were grouped as containing either randomised-controlled trial evidence (RCTE) or RCTE with real-world evidence (RWE). The data on indicatable population (the therapeutic indication requested by an engagement) and indicated population (the therapeutic indication ultimately granted) as well as the median number of criteria limiting the indicated population in each study type (RCTE/RWE) was extracted. A chi-square test assessed the association between the indicated population (as a proportion of the indicatable population) and type of evidence (RCTE with or without RWE) and a Wilcoxon rank sum test assessed the difference between the median number of limiting criteria between RCTE and RWE studies. Prediction modelling extrapolated the results of a power analysis to a level expected to deliver significance and the time this would take.
Results: The review identified 103 engagements, of which three were excluded (one contained only RWE; two contained only systematic literature reviews), leaving 100 engagements for 87 orphan medicines in the final analysis. Only 13% of engagements contained RWE. Although the difference was statistically insignificant, 76.92% of engagements containing RCTE and RWE resulted in a broader indicated population as compared to only 56.32% of those that contained RCTE alone. The median number of limiting criteria from RCTE (37 (28, 43)) and RWE (5 (2, 9)) studies varied significantly (p = 0.005). Modelling suggested that the analysis would achieve sufficient power by 2033-37 at the current RWE adoption rate.
Conclusion: The proportion of the disease population studied in RWE was greater than that in RCTE. The analysis testing the relationship between additional RWE and broader indicated population would achieve adequate power between 2032 and 2037 at the current RWE adoption rate.
Keywords: Medicine adoption model; Multiple stakeholder approach; Orphan medicine; Randomised controlled trial; Real-world evidence.
© 2022. The Author(s).
Conflict of interest statement
The author is the founder and CEO of Medialis Ltd, a medical affairs consultancy and contract research organisation involved in the design and delivery of real-world evidence including the patient-reported outcomes and patient registries.
Figures

Similar articles
-
A medicine adoption model for assessing the expected effects of additional real-world evidence (RWE) at product launch.Curr Med Res Opin. 2021 Sep;37(9):1645-1655. doi: 10.1080/03007995.2021.1947218. Epub 2021 Jul 8. Curr Med Res Opin. 2021. PMID: 34176383 Clinical Trial.
-
Marketing Authorization Applications Made to the European Medicines Agency in 2018-2019: What was the Contribution of Real-World Evidence?Clin Pharmacol Ther. 2022 Jan;111(1):90-97. doi: 10.1002/cpt.2461. Epub 2021 Nov 13. Clin Pharmacol Ther. 2022. PMID: 34689339 Free PMC article. Review.
-
Use of Real-World Data and Evidence in Drug Development of Medicinal Products Centrally Authorized in Europe in 2018-2019.Clin Pharmacol Ther. 2022 Jan;111(1):310-320. doi: 10.1002/cpt.2462. Epub 2021 Nov 16. Clin Pharmacol Ther. 2022. PMID: 34689334 Free PMC article.
-
Health Canada Usage of Real World Evidence (RWE) in Regulatory Decision Making compared with FDA/EMA usage based on publicly available information.J Pharm Pharm Sci. 2022;25:227-236. doi: 10.18433/jpps32715. J Pharm Pharm Sci. 2022. PMID: 35760071 Review.
-
Translational hurdles with cannabis medicines.Pharmacoepidemiol Drug Saf. 2020 Oct;29(10):1325-1330. doi: 10.1002/pds.4999. Epub 2020 Apr 12. Pharmacoepidemiol Drug Saf. 2020. PMID: 32281186 Review.
Cited by
-
Real-world evidence to support regulatory submissions: A landscape review and assessment of use cases.Clin Transl Sci. 2024 Aug;17(8):e13903. doi: 10.1111/cts.13903. Clin Transl Sci. 2024. PMID: 39092896 Free PMC article. Review.
References
-
- European Medicines Agency. EMA Regulatory Science to 2025. 2020. Accessed December 20, 2021. https://www.ema.europa.eu/en/documents/regulatory-procedural-guideline/e....
LinkOut - more resources
Full Text Sources