. 2022 May 4;20(1):197.
doi: 10.1186/s12967-022-03395-7.

Single-cell N6-methyladenosine regulator patterns guide intercellular communication of tumor microenvironment that contribute to colorectal cancer progression and immunotherapy

Affiliations

Single-cell N6-methyladenosine regulator patterns guide intercellular communication of tumor microenvironment that contribute to colorectal cancer progression and immunotherapy

Yuzhen Gao et al. J Transl Med. .

Abstract

Background: N6-methyladenosine (m6A) RNA methylation plays a critical role in key genetic events for various cancers; yet, how m6A functions within the tumor microenvironment (TME) remains to be elucidated.

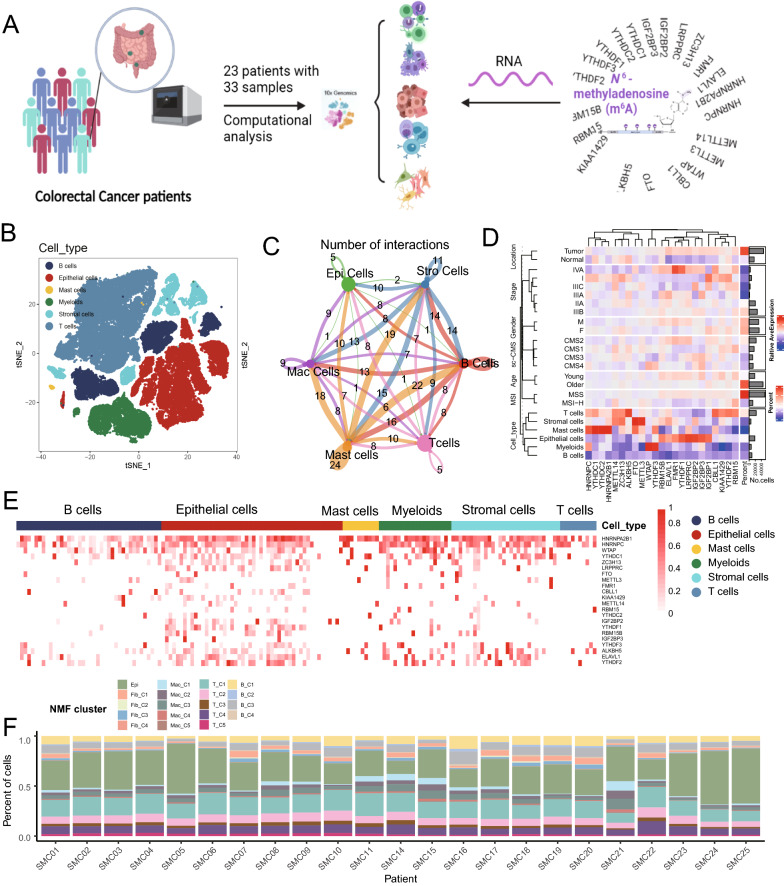
Methods: A total of 65,362 single cells from single-cell RNA-seq data derived from 33 CRC tumor samples were analyzed by nonnegative matrix factorization (NMF) for 23 m6A RNA methylation regulators. CRC and Immunotherapy cohorts from public repository were used to determine the prognosis and immune response of TME clusters.

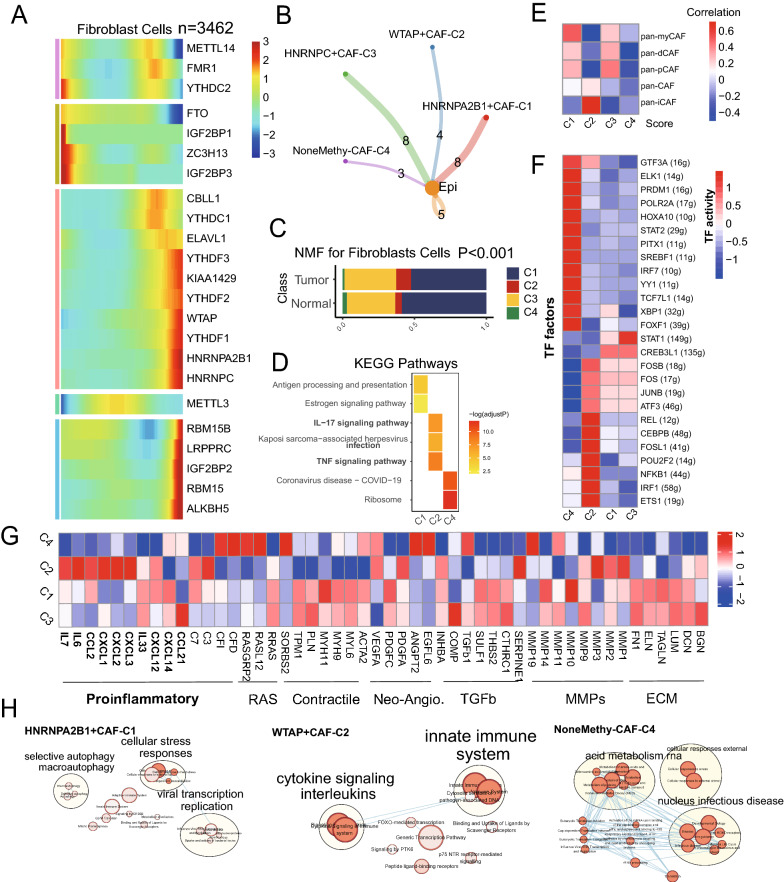
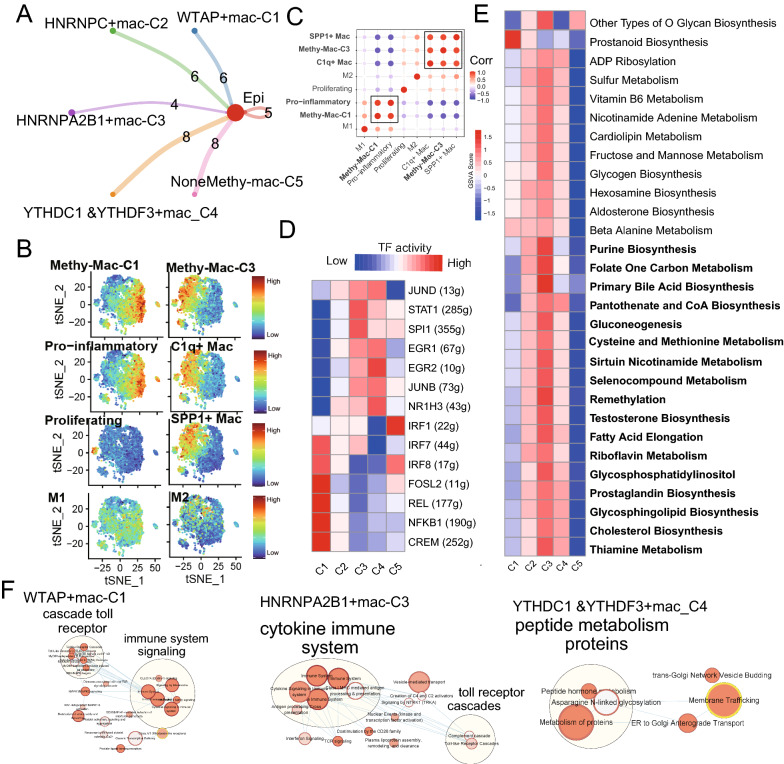
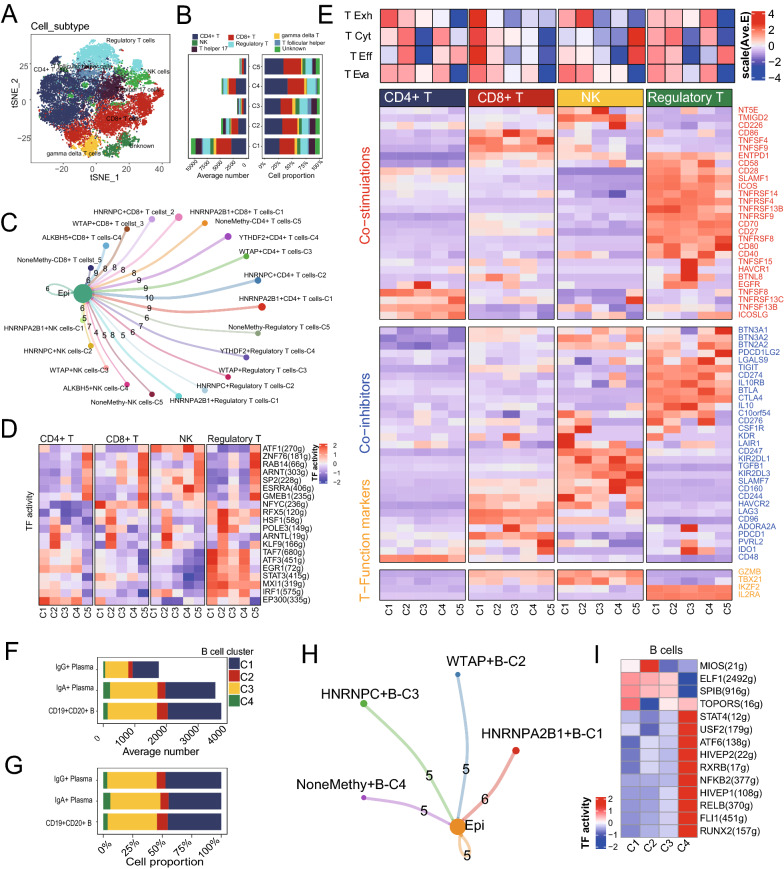
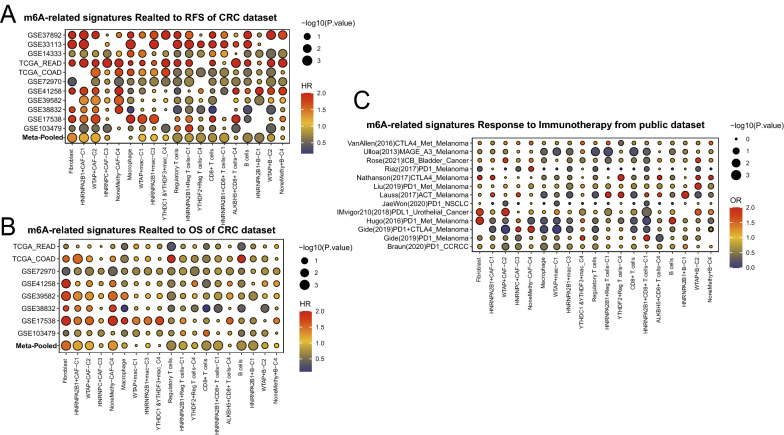
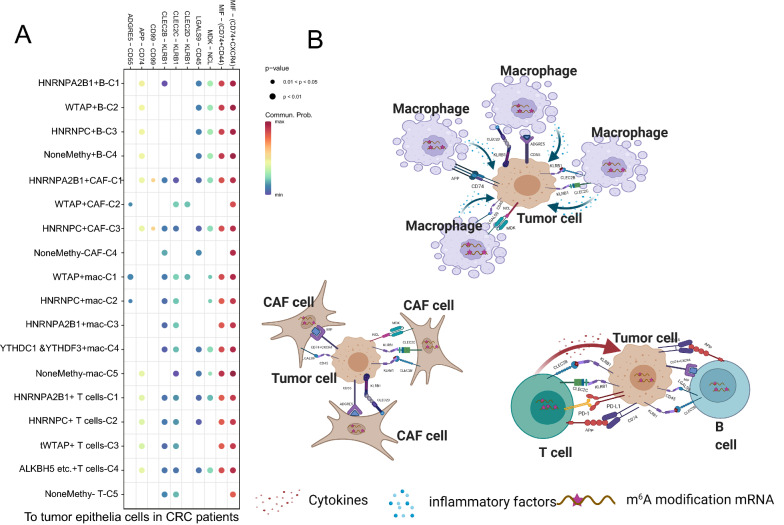
Results: The fibroblasts, macrophages, T and B cells were respectively grouped into 4 to 5 subclusters and then classified according to various biological processes and different marker genes. Furthermore, it revealed that the m6A RNA methylation regulators might be significantly related to the clinical and biological features of CRC, as well as the pseudotime trajectories of main TME cell types. Bulk-seq analysis suggested that these m6A-mediated TME cell subclusters had significant prognostic value for CRC patients and distinguished immune response for patients who underwent ICB therapy, especially for the CAFs and macrophages. Notably, CellChat analysis revealed that RNA m6A methylation-associated cell subtypes of TME cells manifested diverse and extensive interaction with tumor epithelial cells. Further analysis showed that ligand-receptor pairs, including MIF - (CD74 + CXCR4), MIF - (CD74 + CD44), MDK-NCL and LGALS9 - CD45, etc. mediated the communication between m6A associated subtypes of TME cells and tumor epithelial cells.

Conclusions: Taken together, our study firstly revealed the m6A methylation mediated intercellular communication of the tumor microenvironment in the regulation of tumor growth and antitumor immunomodulatory processes.

Keywords: Colorectal cancer; Immunotherapy; Prognosis; Single-cell; Tumor microenvironment; m6A.


Conflict of interest statement

The authors declare that they have no conflicts of interest for this work.

Figures

Fig. 1
Fig. 1
Overview of m6A RNA methylation regulators in the single-cell data for colorectal cancer. A The overall design of the present study and the data sourced from the SMC dataset (GSE132465). B Cell type annotations by using the Seurat t-distributed stochastic neighbor embedding (t-SNE) plot of 65,362 cells; C Cell–Cell communications between main six cell types by Cell chat analysis. D Average expression of m6A RNA methylation regulators in 65,362 cells according to different clinical variables in the SMC dataset containing cell types, including class types (normal vs. tumor), MSI (MSI-H vs. MSS), Age (old vs. young), Stage (I, IIA, IIIA, IIIB IIIC, and IVA), and Gender (female vs. male) by using z-score. E Heatmap distribution of m6A RNA methylation regulators in B cells, epithelial cells, mast cells, myeloid cells, stromal cells, and T cells. F NMF cluster by using the 23 m6A regulators RNA expression respectively for the main four types of TME cells (CAFs, Macrophage cells, T cells, and B cells) in the scRNA data
Fig. 2
Fig. 2
m6A regulators modified the features of fibroblast cells. A Trajectory Analysis reveals the role of m6A genes in for fibroblast cells (3462 cells). B Cell–Cell communications from m6A-related fibroblast cells to epithelial cells. C Bar plot for four m6A-fib-clusters, along with source class, reveals that the percentage of m6A-fib-C2 in tumor is higher than that in normal mucosa (p < 0.001). D Heatmap showing the activated KEGG pathway in main m6A-fib-clusters by using the DEGs among these groups (p < 0.05). E Different m6A-related fibroblast clusters were correlated with the previous signatures (p < 0.05). F Heatmap showing the significantly different activities of TFs among four m6A fibroblast cell clusters by comparing the average AUC using pySCENIC in Python software (Kruskal–Wallis test, p < 0.001). TF activity is scored using AUCell. G Heatmap showing the different average expression of common signaling pathway genes in the four m6A-fib-clusters, including collagens, ECM, MMPs, TGFb, Neo-Angio, Contractile, RAS and Proinflammatory. H Enrichment cluster analysis for activated signaling ways and functions of m6A-related fibroblast types in the Cytoscape by the REAC database
Fig. 3
Fig. 3
m6A regulators contributed to the production of tumor-associated macrophages5822 macrophages. A Cell–Cell communications between main m6A-related macrophage cells to epithelia cells by Cell chat analysis. B t-SNE plots of methy-mac-C1, methy-mac-C3, proinflammatory, C1q+, proliferating, SPP1 + mac, M1, and M2 macrophage signatures for 5582 macrophage cells. C Correlation plot for the above eight gene signatures in 5582 tumor macrophage cells. Methy-mac-C1 clusters are significantly related to proinflammatory macrophages, and methy-mac-C3 clusters are significantly related to SPP1 + and C1q + macrophage cells (p < 0.001, r > 0.5). D Heatmap showing significantly different TFs among m6A macrophage clusters by using pySCENIC in Python software to compare their average AUCs (Kruskal–Wallis test, p < 0.001). TF activity is scored using AUCell. E Heatmap showing significantly different activity of 41/113 metabolic signaling pathway scores by GSVA for 5582 cells among five methy-mac clusters (Kruskal–Wallis test, p < 0.001). F Enrichment cluster analysis for activated signaling ways and functions of m6A-related macrophage types in the Cytoscape by the REAC database
Fig. 4
Fig. 4
NMF clusters of m6A methylation regulators for T cells and B cells. A t-SNE plot for 23,115 T cells by 8 cell types in the SMC dataset, including CD + 4, CD + 8, Treg, NK, T helper 17, T follicular helper, gamma delta T, and Unknown. B Cell–Cell communications from main m6A-related T cells to epithelia cells by Cell chat analysis. (C1, HNRNPA2B1 dominant; C2, IGF2BP1 and HNRNPC dominant; C3, IFG2BP3, WTAP, and FTO dominant; C4, ALKBH5, YTHDF2, and YTHDC1 dominant). C Bar plot showing the number and percentage of methy-T cell clusters, including the cluster without m6A methylation regulator expression (n = 1265), among different cell types of T cells. D Heatmap showing significantly different TFs among m6A clusters in CD + 4, CD + 8, Treg, and NK cells by comparing their average AUC by using pySCENIC in Python (Kruskal–Wallis test, p < 0.001). TF activity is scored using AUCell. E Heatmap showing significantly different features among methy-T clusters in CD + 4, CD + 8, Treg and NK cells, including four T function signatures (T exhaustion score, T cytotoxic score, T effector score, and T evasion score), as well as some immune stimulators, inhibitors and T cell function marker genes (Kruskal–Wallis test, p < 0.001). F Cell–Cell communications between main m6A-related B cells types by Cell chat analysis. G, H Bar plot for the number and percentage of m6A clusters by using the NMF clustering algorithm for 9146 B cells as above. J Heatmap showing significantly different TFs among m6A clusters in total B cells
Fig. 5
Fig. 5
Overall of the prognosis and immunotherapy response of m6A-related cells types (GSVA score) in the bulk sequence from public cohorts. The cut-off were calculated by the survival R packages (A). RFS analysis (data from 11 CRC cohorts); B OS analysis (data from 8 CRC cohorts); C immunotherapy response analysis (data from 13 immunotherapy cohorts with response rate)
Fig. 6
Fig. 6
Cell–Cell communications from main m6A-related TME cells to epithelial cells. A The significantly related ligand–receptor interactions from main m6A-related clusters to epithelial cells. B Hypothesis of the mechanism of m6A clustering TME cells affecting cell communication

Similar articles

Cited by

References

    1. Sung H, Ferlay J, Siegel RL, Laversanne M, Soerjomataram I, Jemal A, Bray F. Global Cancer Statistics 2020: GLOBOCAN Estimates of Incidence and Mortality Worldwide for 36 Cancers in 185 Countries. CA Cancer J Clin. 2021;71:209–249. - PubMed
    1. Garcia-Cardenas JM, Guerrero S, Lopez-Cortes A, Armendariz-Castillo I, Guevara-Ramirez P, Perez-Villa A, Yumiceba V, Zambrano AK, Leone PE, Paz YMC. Post-transcriptional regulation of colorectal cancer: a focus on RNA-Binding Proteins. Front Mol Biosci. 2019;6:65. - PMC - PubMed
    1. Gao Y, Wang H, Li H, Ye X, Xia Y, Yuan S, Lu J, Xie X, Wang L, Zhang J. Integrated analyses of m (1)A regulator-mediated modification patterns in tumor microenvironment-infiltrating immune cells in colon cancer. Oncoimmunology. 2021;10:1936758. - PMC - PubMed
    1. Li M, Zha X, Wang S. The role of N6-methyladenosine mRNA in the tumor microenvironment. Biochim Biophys Acta Rev Cancer. 2021;1875:188522. - PubMed
    1. Roignant JY, Soller M. m (6)A in mRNA: An Ancient Mechanism for Fine-Tuning Gene Expression. Trends Genet. 2017;33:380–390. - PubMed

Publication types