

A constellation of eye-tracking measures reveals social attention differences in ASD and the broad autism phenotype
- PMID: 35509089
- PMCID: PMC9069739
- DOI: 10.1186/s13229-022-00490-w
A constellation of eye-tracking measures reveals social attention differences in ASD and the broad autism phenotype
Abstract
Background: Social attention differences, expressed through gaze patterns, have been documented in autism spectrum disorder (ASD), with subtle differences also reported among first-degree relatives, suggesting a shared genetic link. Findings have mostly been derived from standard eye-tracking methods (total fixation count or total fixation duration). Given the dynamics of visual attention, these standard methods may obscure subtle, yet core, differences in visual attention mechanisms, particularly those presenting sub-clinically. This study applied a constellation of eye-tracking analyses to gaze data from individuals with ASD and their parents.
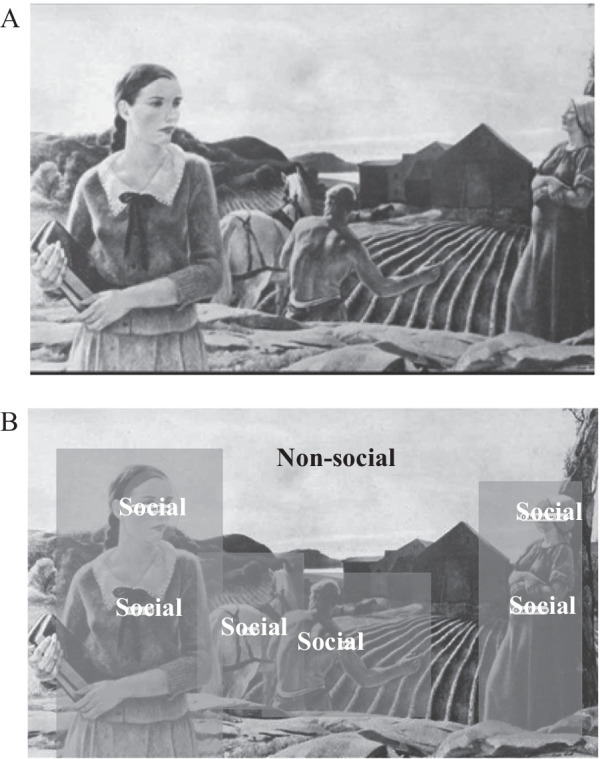
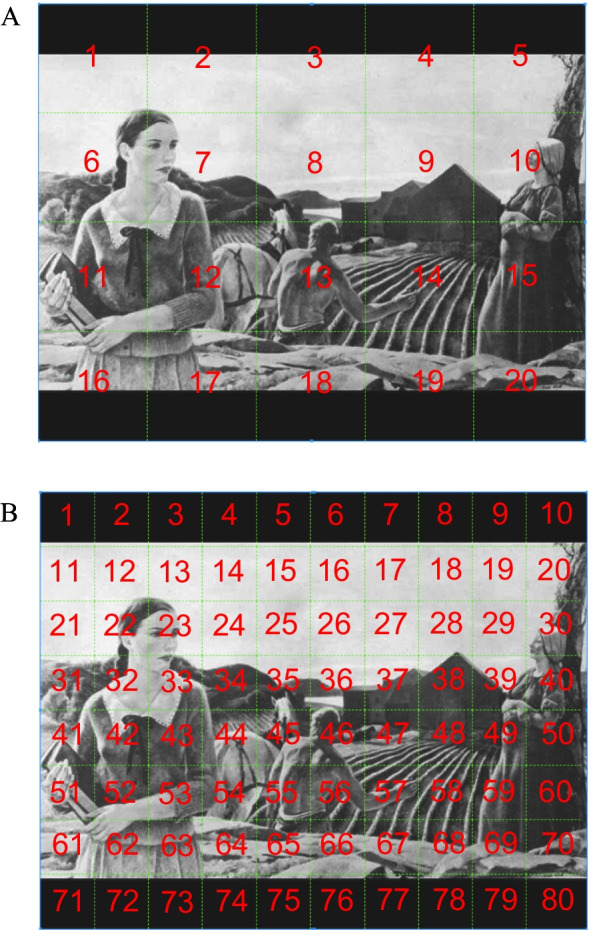
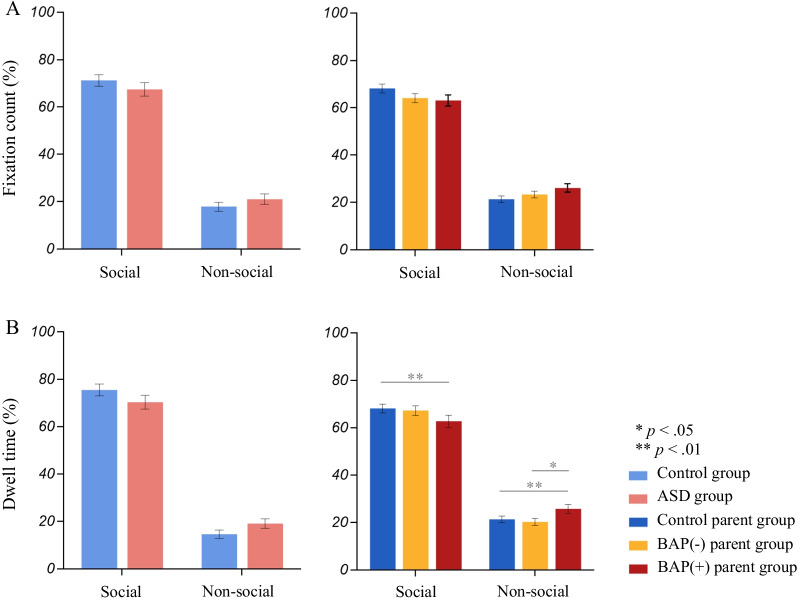
Methods: This study included n = 156 participants across groups, including ASD (n = 24) and control (n = 32) groups, and parents of individuals with ASD (n = 61) and control parents (n = 39). A complex scene with social/non-social elements was displayed and gaze tracked via an eye tracker. Eleven analytic methods from the following categories were analyzed: (1) standard variables, (2) temporal dynamics (e.g., gaze over time), (3) fixation patterns (e.g., perseverative or regressive fixations), (4) first fixations, and (5) distribution patterns. MANOVAs, growth curve analyses, and Chi-squared tests were applied to examine group differences. Finally, group differences were examined on component scores derived from a principal component analysis (PCA) that reduced variables to distinct dimensions.
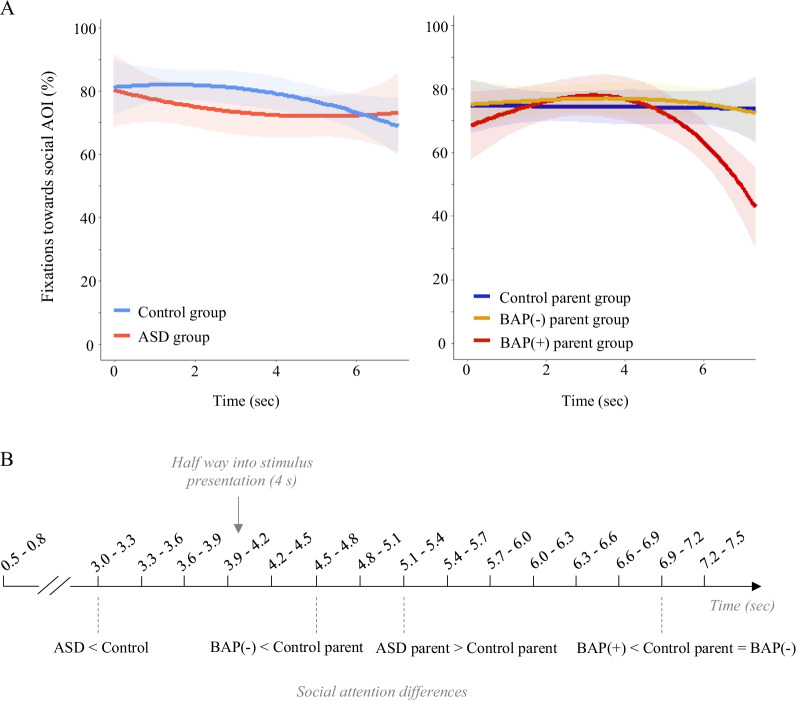
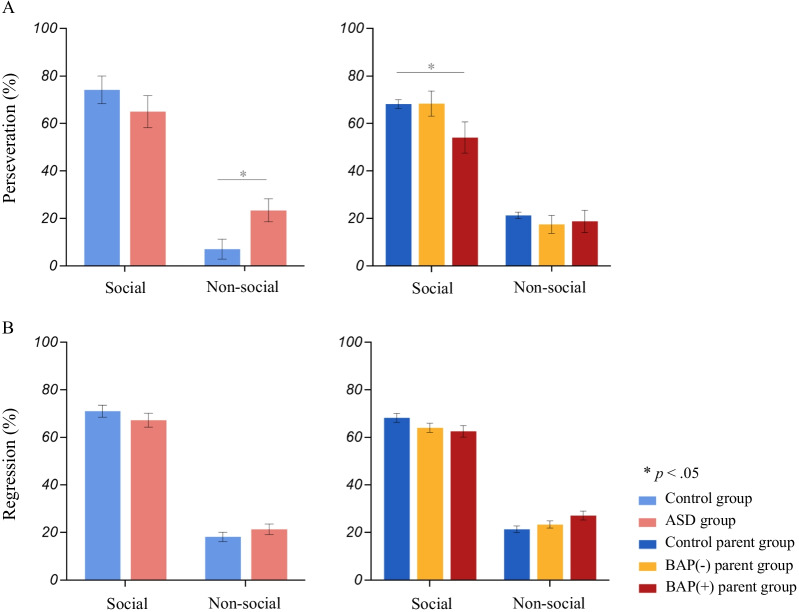
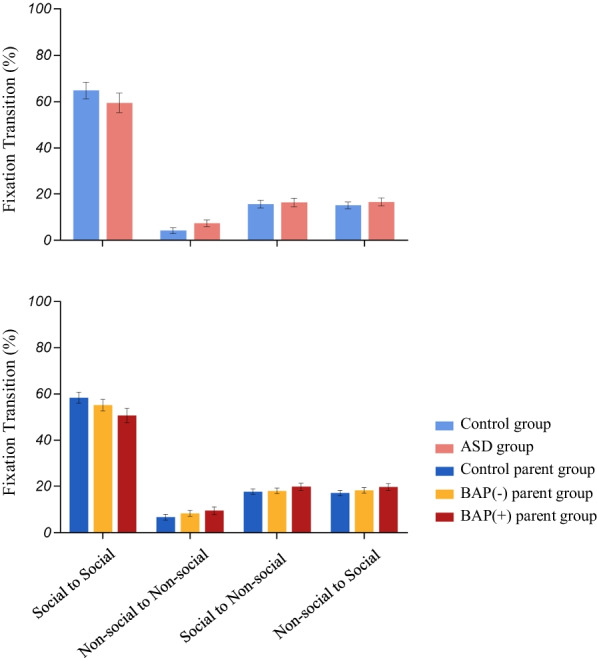
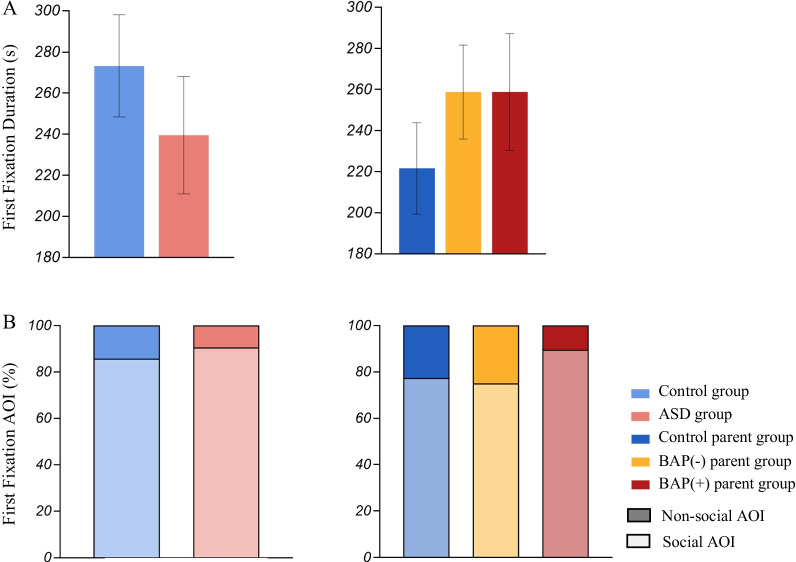
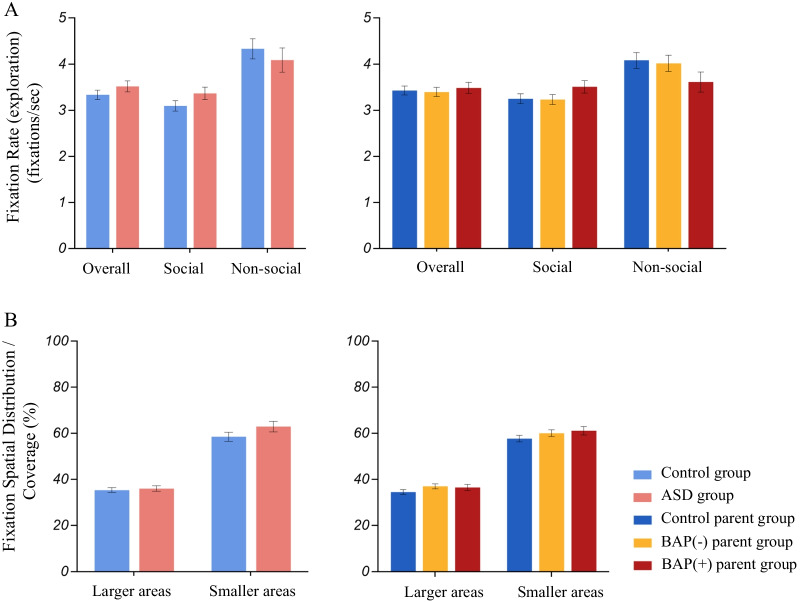
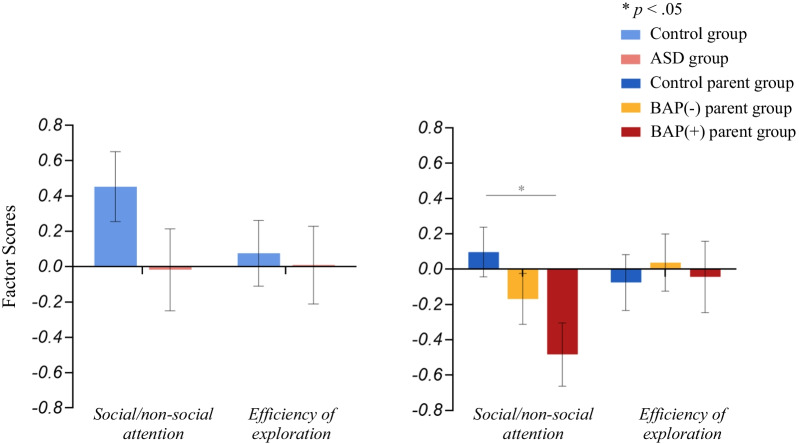
Results: No group differences emerged among standard, first fixation, and distribution pattern variables. Both the ASD and ASD parent groups demonstrated on average reduced social attention over time and atypical perseverative fixations. Lower social attention factor scores derived from PCA strongly differentiated the ASD and ASD parent groups from controls, with parent findings driven by the subset of parents demonstrating the broad autism phenotype.
Limitations: To generalize these findings, larger sample sizes, extended viewing contexts (e.g., dynamic stimuli), and even more eye-tracking analytical methods are needed.
Conclusions: Fixations over time and perseverative fixations differentiated ASD and the ASD parent groups from controls, with the PCA most robustly capturing social attention differences. Findings highlight their methodological utility in studies of the (broad) autism spectrum to capture nuanced visual attention differences that may relate to clinical symptoms in ASD, and reflect genetic liability in clinically unaffected relatives. This proof-of-concept study may inform future studies using eye tracking across populations where social attention is impacted.
Keywords: Autism spectrum disorder; Broad autism phenotype; Endophenotype; Eye tracking; Social attention; Visual processing.
© 2022. The Author(s).
Conflict of interest statement
FS is a paid consultant for Roche and Janssen pharmaceutical companies. All other authors declare that they have no disclosures or conflict of interest.
Figures
References
-
- Yarbus AL. Eye movements during perception of complex objects. Eye movements and vision. New York: Plenum Press; 1967.
Publication types
MeSH terms
Grants and funding
LinkOut - more resources
Full Text Sources
Medical
