. 2022 May 12:6:149.
doi: 10.12688/wellcomeopenres.16883.2. eCollection 2021.

Single-cell multi-omics analysis reveals IFN-driven alterations in T lymphocytes and natural killer cells in systemic lupus erythematosus

Affiliations

Single-cell multi-omics analysis reveals IFN-driven alterations in T lymphocytes and natural killer cells in systemic lupus erythematosus

Dominik Trzupek et al. Wellcome Open Res. .

Abstract

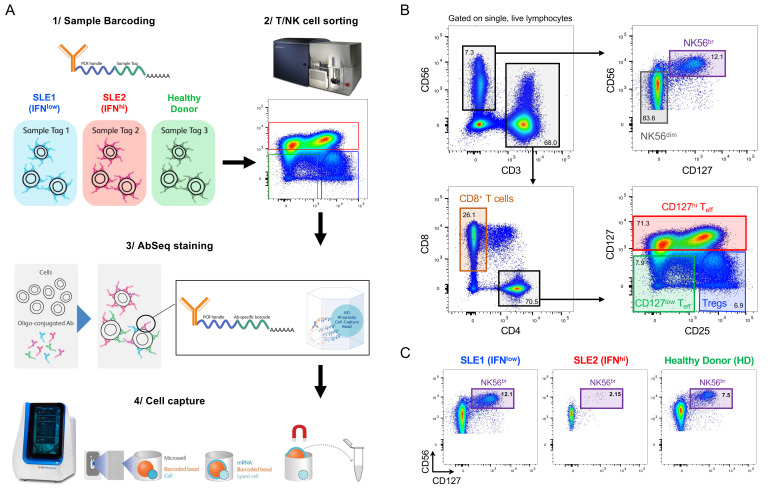
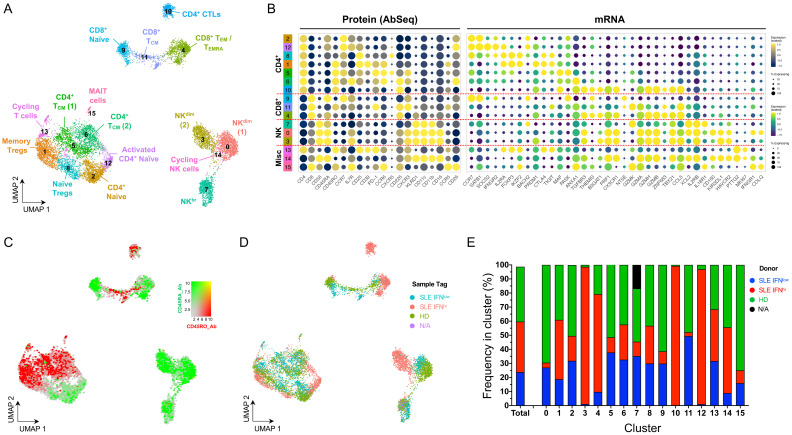
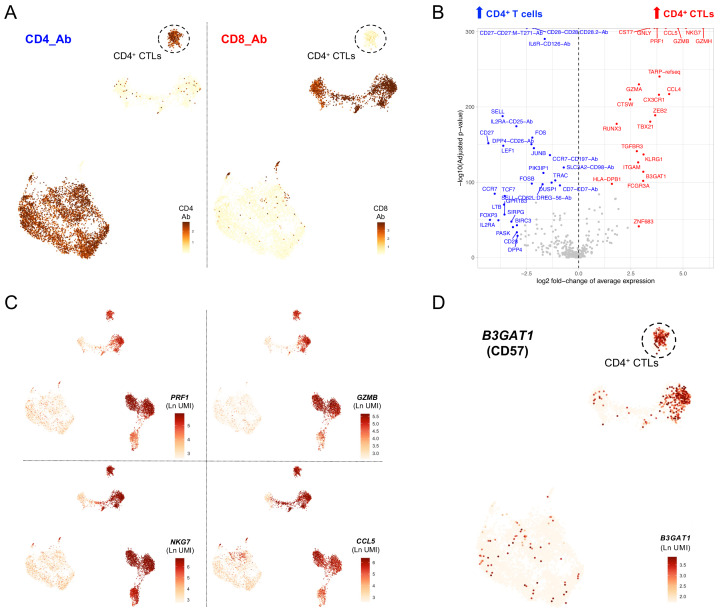
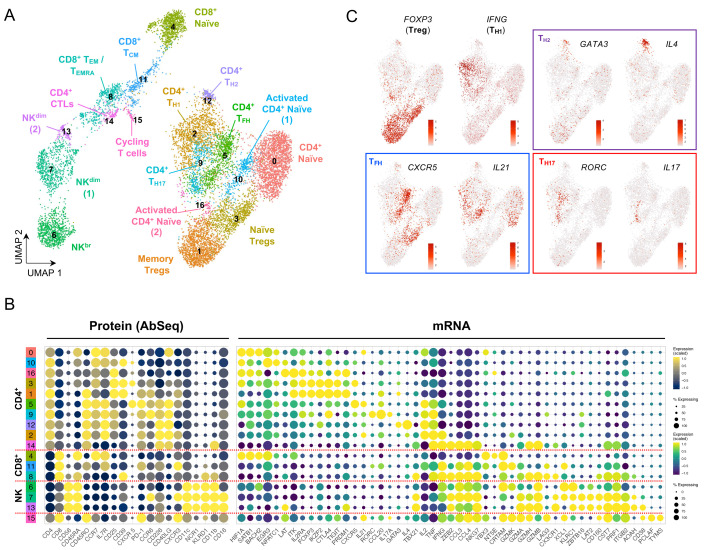
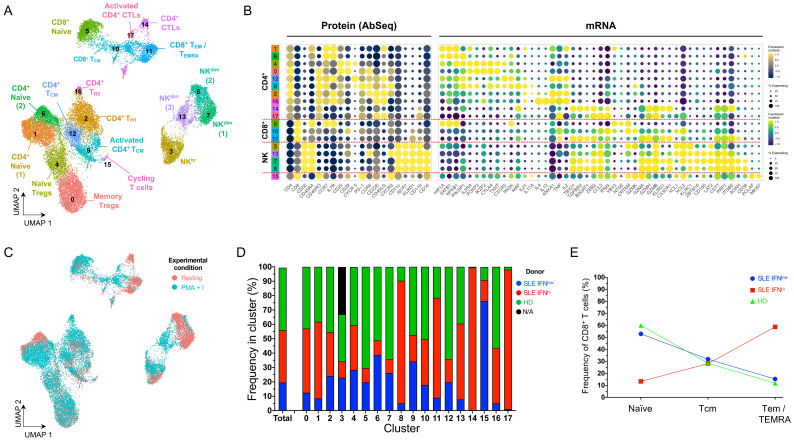
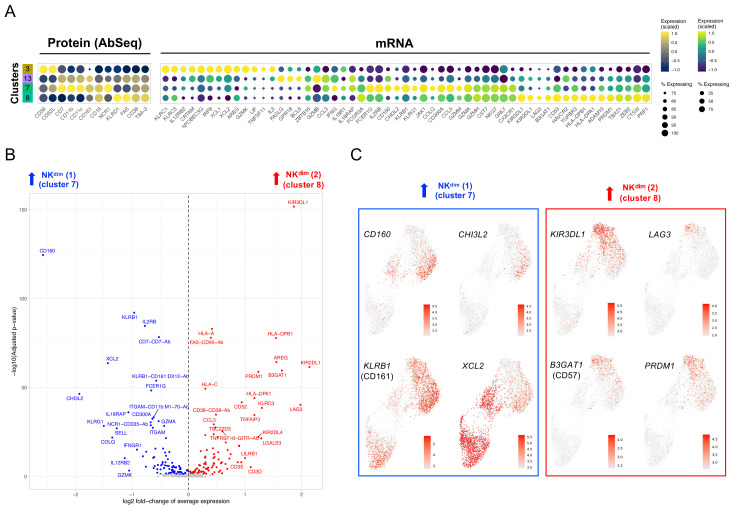
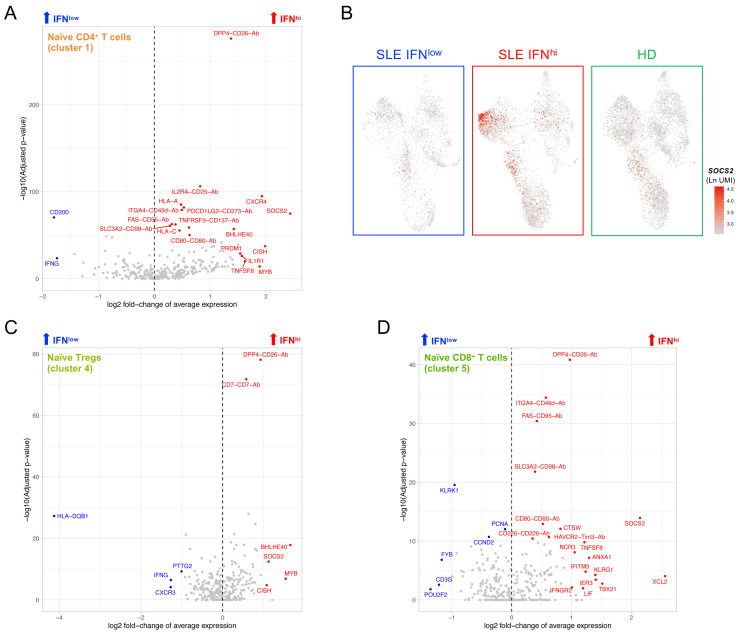
Background: The characterisation of the peripheral immune system in the autoimmune disease systemic lupus erythematosus (SLE) at the single-cell level has been limited by the reduced sensitivity of current whole-transcriptomic technologies. Here we employ a targeted single-cell multi-omics approach, combining protein and mRNA quantification, to generate a high-resolution map of the T lymphocyte and natural killer (NK) cell populations in blood from SLE patients. Methods: We designed a custom panel to quantify the transcription of 534 genes in parallel with the expression of 51 surface protein targets using the BD Rhapsody AbSeq single-cell system. We applied this technology to profile 20,656 T and NK cells isolated from peripheral blood from an SLE patient with a type I interferon (IFN)-induced gene expression signature (IFN hi), and an age- and sex- matched IFN low SLE patient and healthy donor. Results: We confirmed the presence of a rare cytotoxic CD4 + T cell (CTL) subset, which was exclusively present in the IFN hi patient. Furthermore, we identified additional alterations consistent with increased immune activation in this patient, most notably a shift towards terminally differentiated CD57 + CD8 + T cell and CD16 + NK dim phenotypes, and the presence of a subset of recently-activated naïve CD4 + T cells. Conclusions: Our results identify IFN-driven changes in the composition and phenotype of T and NK cells that are consistent with a systemic immune activation within the IFN hi patient, and underscore the added resolving power of this multi-omics approach to identify rare immune subsets. Consequently, we were able to find evidence for novel cellular peripheral biomarkers of SLE disease activity, including a subpopulation of CD57 + CD4 + CTLs.

Keywords: AbSeq; BD Rhapsody; Single-cell RNA-sequencing (scRNA-seq); biomarker; cytotoxic CD4+ T cells (CTLs); multi-omics; systemic lupus erythematosus (SLE); type I interferon (IFN).


Conflict of interest statement

No competing interests were disclosed.

Figures

Figure 1.
Figure 1.. Characterisation of the peripheral T and NK cell populations in SLE using a single-cell multi-omics approach.
( A) Summary of the experimental workflow based on the BD Rhapsody single-cell RNA-sequencing system combining the quantification of mRNA and surface protein targets (AbSeq). Experiment was carried out using samples from three donors: (i) an SLE patient with low expression of the type I interferon (IFN)-induced gene expression signature (IFN low; depicted in blue); (ii) an SLE patient with a previously detected IFN-induced gene expression signature (IFN hi; depicted in red); and (iii) a healthy donor (HD; depicted in green). Cells isolated from each donor were barcoded with oligo-conjugated antibodies and pooled together for cell capture and library preparation. ( B) Gating strategy used for the isolation of the six T and NK cell populations assessed in this study. ( C) Frequency of NK56 br cells, defined as CD3 -CD127 +CD56 hi NK cells, in each of the three donors.
Figure 2.
Figure 2.. Single-cell multi-omics provides a high-resolution map of the peripheral T and NK cell populations.
( A) Uniform Manifold Approximation and Projection (UMAP) plot depicting the clustering of the isolated resting cells (N = 9,568 cells passing QC) from the three donors assessed in this study. ( B) Dot plot depicts the expression of select key differentially expressed markers within the identified clusters. The size of the dots represents the frequency of the marker in the respective cluster and the colour represents the relative expression level. Protein markers (AbSeq) are shown on the left section of the plot and mRNA markers on the right section. ( C) UMAP plot depicting the overlaid expression of the CD45RA (white to green) and CD45RO (white to red) protein isoforms on the identified cell clusters. ( D) UMAP plot depicting the donor-specific clustering. ( E) Compositional analysis depicting the relative frequency of cells from each donor in each of the identified clusters. A small fraction of the NK56 br cells in cluster 7 could not be tagged with the barcoding antibodies, and therefore donor-specific identity could not be assigned for those cells (labelled as N/A on the plot). HD, healthy donor; IFN, type I interferon-induced gene expression signature; SLE, systemic lupus erythematosus.
Figure 3.
Figure 3.. A subset of CD57 + CD4 + T cells with cytotoxic profile is specifically enriched in the IFN hi SLE patient.
( A) Feature plots depicting the expression of CD4 (left) and CD8 (right) at the protein level (AbSeq) on the identified T cell clusters. ( B) Volcano plot depicts the differential expression between the CD4 + CTLs (cluster 10) and the remaining identified CD4 + T cell clusters. ( C) Feature plots depict the expression of four canonical cytotoxic cytokine genes: PRF1, GZMB, NKG7 and CCL5. ( D) Feature plot depicting the expression of B3GAT1, encoding for the surface receptor CD57 on the identified T cell clusters. Ab, AbSeq antibody; CD4 + CTL, cytotoxic CD4 + T cell.
Figure 4.
Figure 4.. In vitro stimulation polarizes the functional differentiation of CD4 + T cell subsets.
( A) UMAP plot depicting the clustering of the isolated T and NK cells following short in vitro stimulation (90 min) with PMA + ionomycin (N = 11,088 cells passing QC). ( B) Dot plot depicts the expression of select key differentially expressed markers within the identified in vitro stimulated clusters. The size of the dots represents the frequency of the marker in the respective cluster and the colour represents the relative expression level. Protein markers (AbSeq) are shown in the left section of the plot and mRNA markers on the right section. ( C) Feature plots depicting the expression of key lineage defining transcription factors and respective effector cytokine.
Figure 5.
Figure 5.. Integrated resting and in vitro stimulated data reveal subtle IFN-induced alterations in the composition of the peripheral T and NK cell populations.
( A) UMAP plot depicting the clustering of integrated (resting + in vitro stimulated) T and NK datasets (N = 20,656 cells passing QC). ( B) Dot plot depicts the expression of select key differentially expressed markers within the identified integrated clusters. The size of the dots represents the frequency of the marker in the respective cluster and the colour represents the relative expression level. Protein markers (AbSeq) are shown on the left section of the plot and mRNA markers on the right section. ( C) UMAP plot depicts the treatment-specific clustering of the resting (red) and in vitro stimulated (teal) cells. ( D) Compositional analysis depicting the relative frequency of cells from each donor in each of the identified clusters. A small fraction of the NK56 br cells in cluster 3 could not be tagged with the barcoding antibodies, and therefore donor-specific identity could not be assigned for those cells (labelled as N/A on the plot). ( E) Relative distribution of the three identified CD8 + T cell subsets (among total CD8 + T cells) in each of the three donors assessed in this study. HD, healthy donor; IFN, type I interferon-induced gene expression signature; SLE, systemic lupus erythematosus; Tcm, central memory T cell; Tem, effector memory T cell; TEMRA, terminally differentiated effector memory T cell.
Figure 6.
Figure 6.. CD16 + NK dim cells from the IFN hi SLE patient display a highly differentiated phenotype.
( A) Dot plot depicts the expression of select key differentially expressed markers within the identified NK cell clusters from the integrated analysis shown in Figure 5A. The size of the dots represents the frequency of the marker in the respective cluster and the colour represents the relative expression level. Protein markers (AbSeq) are shown on the left section of the plot and mRNA markers on the right section. ( B) Volcano plot depicts the differential expression between the two CD16 + NK dim subsets (clusters 7 and 8) identified in the integrated analysis. ( C) Feature plots depicting the expression of key differentially expressed markers between the CD16 + NK dim subsets. Markers specifically upregulated in cluster 7 are highlighted in blue and markers specifically upregulated in cluster 8 are highlighted in red.
Figure 7.
Figure 7.. A subset of naïve CD4 + T cells from the IFN hi SLE patient displays a cytokine-induced activation signature.
( A) Volcano plot depicts the differential expression between the IFN hi SLE patient and the two other donors in cells mapping to the naïve CD4 + T subset (cluster 1 of the integrated data shown in Figure 5A). ( B) Feature plots depict the expression of the cytokine-induced signalling gene SOCS2 in the three donors profiled in this study. ( C, D) Volcano plots depict the differential expression between the IFN hi SLE patient and the two other donors in cells mapping to the CD4 + naïve Treg (cluster 4; C) and CD8 + naïve T cell (cluster 5; D) subsets, respectively.

References

    1. Arbuckle MR, McClain MT, Rubertone MV, et al. : Development of Autoantibodies before the Clinical Onset of Systemic Lupus Erythematosus. N Engl J Med. 2003;349(16):1526–1533. 10.1056/NEJMoa021933 - DOI - PubMed
    1. Tsokos GC: Systemic Lupus Erythematosus. N Engl J Med. 2011;365(22):2110–2121. 10.1056/NEJMra1100359 - DOI - PubMed
    1. Bennett L, Palucka AK, Arce E, et al. : Interferon and Granulopoiesis Signatures in Systemic Lupus Erythematosus Blood. J Exp Med. 2003;197(6):711–723. 10.1084/jem.20021553 - DOI - PMC - PubMed
    1. Baechler EC, Batliwalla FM, Karypis G, et al. : Interferon-inducible gene expression signature in peripheral blood cells of patients with severe lupus. Proc Natl Acad Sci U S A. 2003;100(5):2610–2615. 10.1073/pnas.0337679100 - DOI - PMC - PubMed
    1. Banchereau J, Pascual V: Type I Interferon in Systemic Lupus Erythematosus and Other Autoimmune Diseases. Immunity. 2006;25(3):383–392. 10.1016/j.immuni.2006.08.010 - DOI - PubMed