

Impact of the COVID-19 pandemic on Pennsylvania and its healthcare system
- PMID: 35509418
- PMCID: PMC9059195
- DOI: 10.1002/hsr2.615
Impact of the COVID-19 pandemic on Pennsylvania and its healthcare system
Abstract
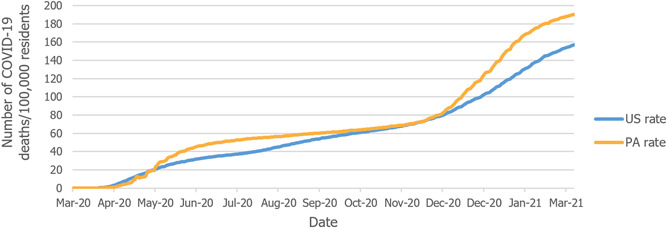
Background and aims: Coronavirus disease 2019 (COVID-19) has taken a toll on Pennsylvania, and the fight against the pandemic continues, with the commonwealth's hospitals and health systems at the epicenter. This report aims to demonstrate the magnitude of the impact of the pandemic on Pennsylvania, with specific attention to its hospitals and health systems and their financial status during the very first year of the pandemic.
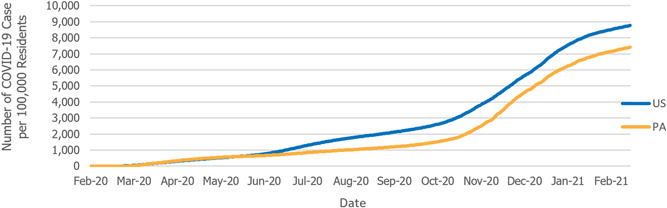
Methods: To measure this magnitude, publicly available US and Pennsylvania COVID-19 data is analyzed, including more detailed geographical, rural/urban, and race/ethnicity analyses.
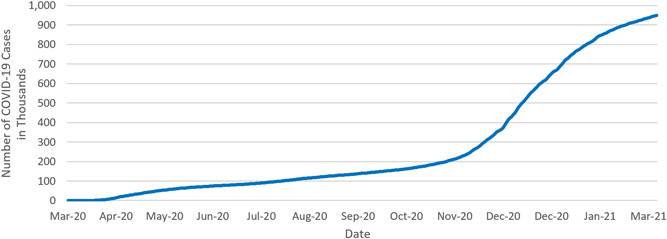
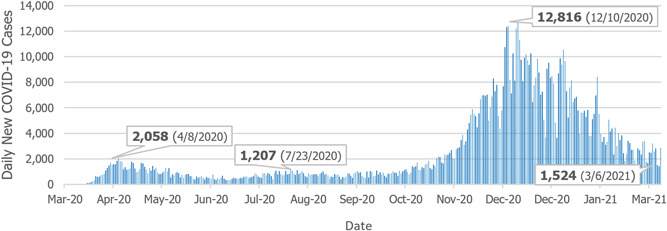
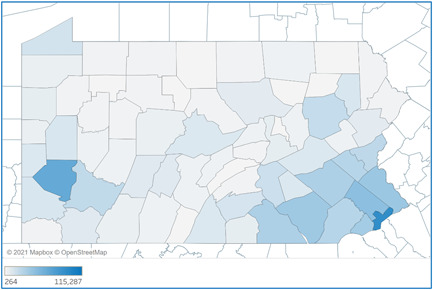
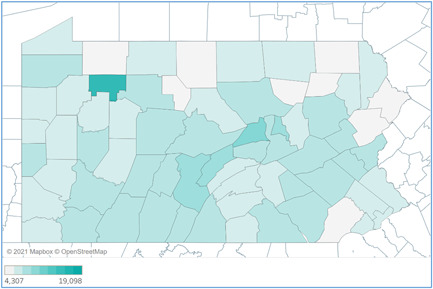
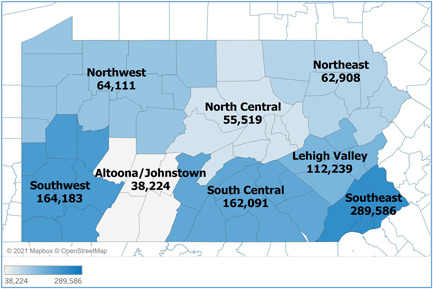
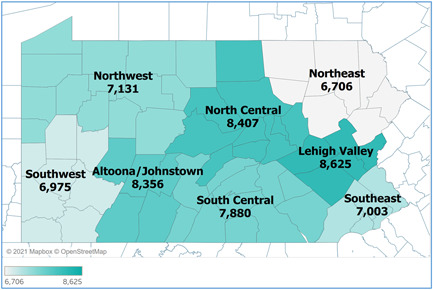
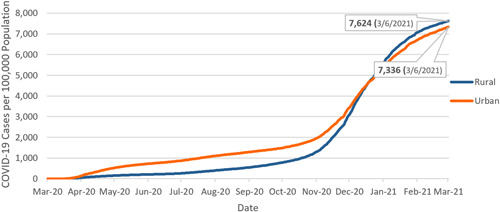
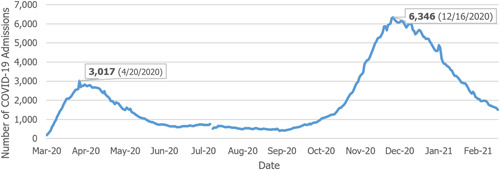
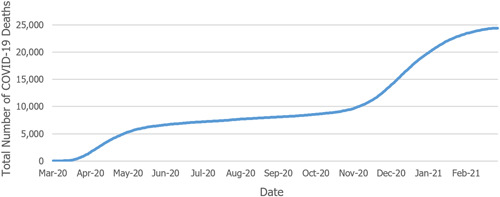
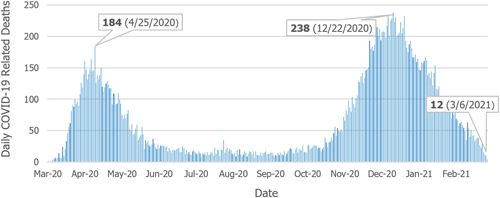
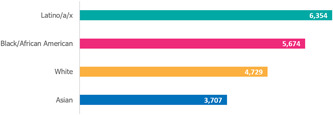
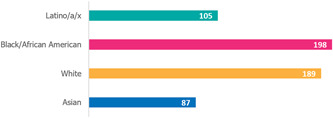
Results: The results show that the case counts started with just two cases on March 6, 2020, and rose to approximately a million by the first anniversary of the pandemic's arrival in the commonwealth. Tragically, the death toll totaled nearly 25,000 during the first year. Philadelphia County had the highest number of total COVID-19 cases, while Forest County had the highest incidence rate. The Southeast region had the highest number of total COVID-19 cases, while the Lehigh Valley had the highest incidence rate. The incidence rate also was higher in rural counties than in urban counties. Black and Latino/a/x populations of Pennsylvania were disproportionally affected by the virus. Several reports measured the financial impact of the pandemic on the state's hospitals to be $4.1-$5 billion during this year.
Conclusion: Hospitals are economic anchors of their communities. To fulfill their critical mission during the pandemic and beyond-and remain economic and community anchors-they need ongoing state and federal support.
Keywords: health economics and evaluation; health policy; healthcare management; public health.
© 2022 The Authors. Health Science Reports published by Wiley Periodicals LLC.
Conflict of interest statement
The authors declare no conflicts of interest.
Figures
References
-
- COVID‐19 Dashboard . Pennsylvania Data, Pennsylvania Department of Health. Accessed December 11, 2020. https://www.health.pa.gov/topics/disease/coronavirus/Pages/Cases.aspx
-
- Hallie Lauer and Kris B. Mamula . Dr. Levine says PA is Seeing the Start of A ‘Fall Resurgence’. Pittsburgh Post‐Gazette. October 14, 2020.
-
- Commonwealth of Pennsylvania . Opendata PA. COVID‐19 aggregate cases current daily county health. Accessed March 9, 2021. https://data.pa.gov/Health/COVID-19-Aggregate-Cases-Current-Daily-County...
-
- American Hospital Association . Hospitals and health systems face unprecedented financial pressures due to COVID‐19. May, 2020. Accessed December 22, 2020. https://www.aha.org/guidesreports/2020-05-05-hospitals-and-health-system...
LinkOut - more resources
Full Text Sources
