. 2022 Apr 25:2022:5682599.
doi: 10.1155/2022/5682599. eCollection 2022.

Functional Analysis of Bronchopulmonary Dysplasia-Related Neuropeptides in Preterm Infants and miRNA-Based Diagnostic Model Construction

Affiliations

Functional Analysis of Bronchopulmonary Dysplasia-Related Neuropeptides in Preterm Infants and miRNA-Based Diagnostic Model Construction

Yue Zhang et al. Comput Math Methods Med. .

Retraction in

Abstract

Background: Bronchopulmonary dysplasia (BPD) has a high mortality rate. This study was aimed at identifying and analysing the risk factors associated with BPD using bioinformatic and mechanical analyses and establishing a predictive model to assess the risk of BPD in preterm infants.

Methods: We identified differentially expressed RNAs via the intersection of miRNAs between datasets. Online analysis tools were used to predict genes targeted by differentially expressed miRNAs (DEmiRNAs) and to generate and visualise competing endogenous RNA (ceRNA) coexpression networks. Gene Ontology (GO) and Kyoto Encyclopedia of Genes and Genomes (KEGG) analyses were subsequently performed on the DEmiRNAs. In addition, an intersection analysis was performed on mRNA and neuropeptide-related genes in the ceRNA network. DEmiRNAs associated with BPD and those involved in ceRNA networks were used to establish a diagnostic prediction model. The GSE108604 dataset was used as a validation set to verify the model.

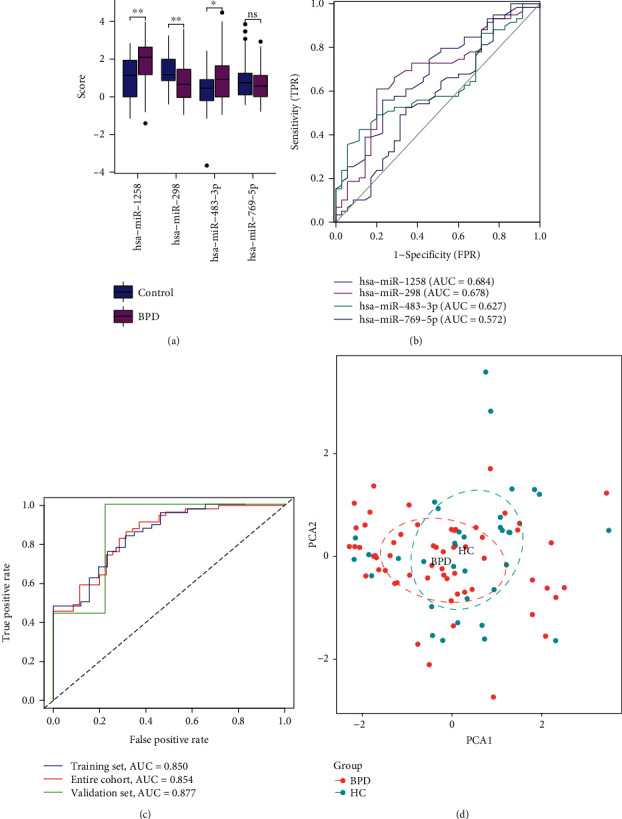
Results: A total of 26 DEmiRNAs were identified from the tracheal aspirates (TAs) of patients with BPD and healthy controls. In addition, a total of 1076 DEmRNAs were obtained from the GSE8586 dataset. Functional enrichment analysis of DEmRNAs revealed an abnormal reduction in mitochondrial-related activity and cellular responses to oxidative stress in patients with BPD. The neuropeptide-related genes OPRL1 and NPPA were found to be upregulated in BPD samples. Eventually, hsa-miR-1258, hsa-miR-298, hsa-miR-483-3p, and hsa-miR-769-5p were screened out and used to establish the prediction model. Calibration curves and detrended correspondence analysis (DCA) revealed that the model had good clinical applicability.

Conclusions: The prediction model provided a simple method for individualised assessment, early diagnosis, and prevention of BPD risk in preterm infants.


Conflict of interest statement

The authors declare that they have no conflicts of interest.

Figures

Figure 1
Figure 1
Research design flow chart. The heat map represents the expression profiles of the final miRNAs used to construct diagnostic models in the training and validation groups. These miRNA signatures can distinguish between the samples of the BPD group and those of the control group (bottom right).
Figure 2
Figure 2
Volcano map of DEmiRNAs and heat map of RNA expression profiles in patients with BPD. (a) DEmiRNAs; (b) DEmRNAs. Purple dots represent upregulated RNAs. Blue dots represent downregulated RNAs. The five RNAs with the largest fold change are labelled in (a) and (b). (c) Heat map of differences in the expression of DEmiRNAs between the BPD and control groups; (d) heat map of differences in the expression of DEmRNAs between the BPD and control groups.
Figure 3
Figure 3
GO enrichment analysis of DEmRNAs and correlation heat map of DEmiRNAs in the ceRNA network. (a) The first five upregulated enriched GO pathways; (b) ten GO pathways that were significantly downregulated; (c) correlation analysis of DEmiRNAs in the ceRNA network.
Figure 4
Figure 4
The miRNA-mRNA ceRNA network. (a) Blue rectangles represent miRNAs, and red circles represent mRNAs. mRNA enrichment in the ceRNA network of upregulated (b) and downregulated (c) GO and KEGG pathways.
Figure 5
Figure 5
Expression of neuropeptides in the ceRNA network and their ability to classify BPD. (a) Sankey diagram demonstrating three miRNA-NP mRNA regulatory pairs in the ceRNA network; (b) differential expression of the neuropeptide-related genes OPRL1 and NPPA between samples from the BPD and control groups; (c) the AUC values of the diagnostic classification ability of OPRL1 and NPPA for BPD were shown; (d) gene set enrichment analysis (GSEA) of OPRL1 indicates the KEGG CYTOKINE CYTOKINE RECEPTOR INTERACTION pathway and NABA ECM REGULATORS pathway are elevated. (e) GSEA of NPPA indicated the KEGG NEUROACTIVE LIGAND RECEPTOR INTERACTION pathway and the REACTOME ADORA2B MEDIATED ANTI INFLAMMATORY pathway.
Figure 6
Figure 6
Construction of SVM-RFE and lasso regression models and demonstration of classification performance. (a) A line graph between the number of incorporated variables and accuracy of the model during the training of the SVM-RFE model; the model had the highest accuracy when 11 variables were included; (b) the relationship between the choice of the penalty coefficient log(lambda) and retention variables in the lasso regression analysis; (c) using ten cross-validated lasso regression analyses, the relationship curves of binomial deviance and log(lambda) were drawn; 18 variables were selected for further analysis; (d) PCA demonstrating classification performance when the SVM-RFE model performs the best; (e) PCA demonstrating the classification performance of lasso logistic regression analysis.
Figure 7
Figure 7
Logistic regression analysis and the predictive power of the model. (a) Box plot depicting the differential expression analysis of four miRNAs between the BPD and control groups; (b) ROC curves demonstrating the classification performance of four miRNAs; (c) diagnostic prediction models were constructed using four miRNAs in the training set. Classification performance in the test and overall sets. (d) PCA of the prediction model constructed by those four miRNAs.
Figure 8
Figure 8
Construction and evaluation of a nomogram prediction model. (a) Nomogram for predicting the occurrence of BPD based on four miRNAs; (b) calibration curve showed the calibration of the prediction model between the predicted and observed values; (c) DCA curves demonstrating the range of safety and efficacy of the clinical prediction model.

References

    1. Younge N., Goldstein R. F., Bann C. M., et al. Survival and neurodevelopmental outcomes among periviable infants. The New England Journal of Medicine . 2017;376(7):617–628. doi: 10.1056/NEJMoa1605566. - DOI - PMC - PubMed
    1. Venkataraman R., Kamaluddeen M., Hasan S. U., Robertson H. L., Lodha A. Intratracheal administration of budesonide-surfactant in prevention of bronchopulmonary dysplasia in very low birth weight infants: a systematic review and meta-analysis. Pediatric Pulmonology . 2017;52(7):968–975. doi: 10.1002/ppul.23680. - DOI - PubMed
    1. Voynow J. A., Fisher K., Sunday M. E., et al. Urine gastrin-releasing peptide in the first week correlates with bronchopulmonary dysplasia and post-prematurity respiratory disease. Pediatric Pulmonology . 2020;55(4):899–908. doi: 10.1002/ppul.24665. - DOI - PMC - PubMed
    1. Johnson D. E., Lock J. E., Elde R. P., Thompson T. R. Pulmonary neuroendocrine cells in hyaline membrane disease and bronchopulmonary dysplasia. Pediatric Research . 1982;16(6):446–454. doi: 10.1203/00006450-198206000-00009. - DOI - PubMed
    1. Kojima T., Fukuda Y., Hirata Y., Matsuzaki S., Kobayashi Y. Changes in vasopressin, atrial natriuretic factor, and water homeostasis in the early stage of bronchopulmonary dysplasia. Pediatric Research . 1990;27(3):260–263. doi: 10.1203/00006450-199003000-00011. - DOI - PubMed

Publication types

LinkOut - more resources