

Chronic glucocorticoid exposure causes brown adipose tissue whitening, alters whole-body glucose metabolism and increases tissue uncoupling protein-1
- PMID: 35510321
- PMCID: PMC9069169
- DOI: 10.14814/phy2.15292
Chronic glucocorticoid exposure causes brown adipose tissue whitening, alters whole-body glucose metabolism and increases tissue uncoupling protein-1
Abstract
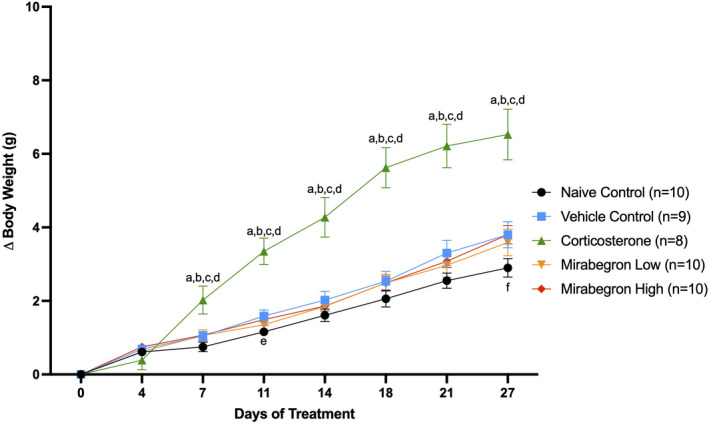
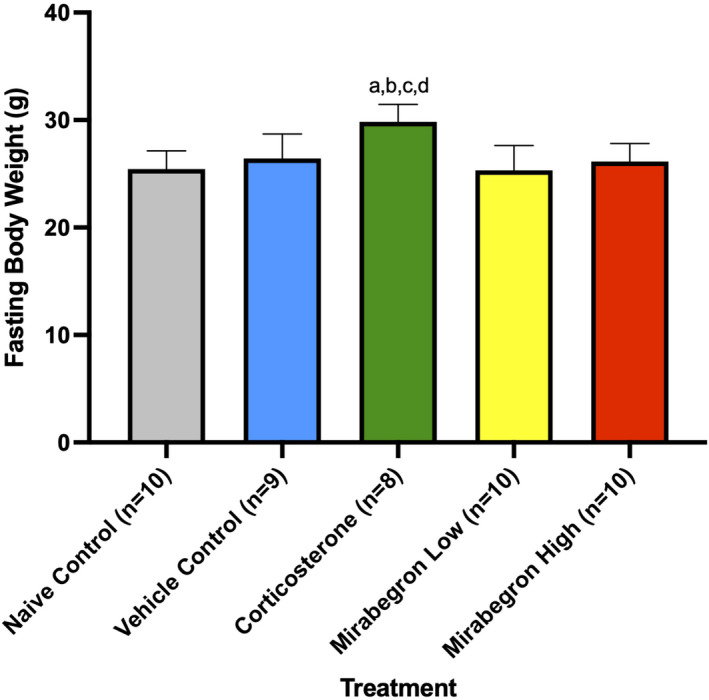
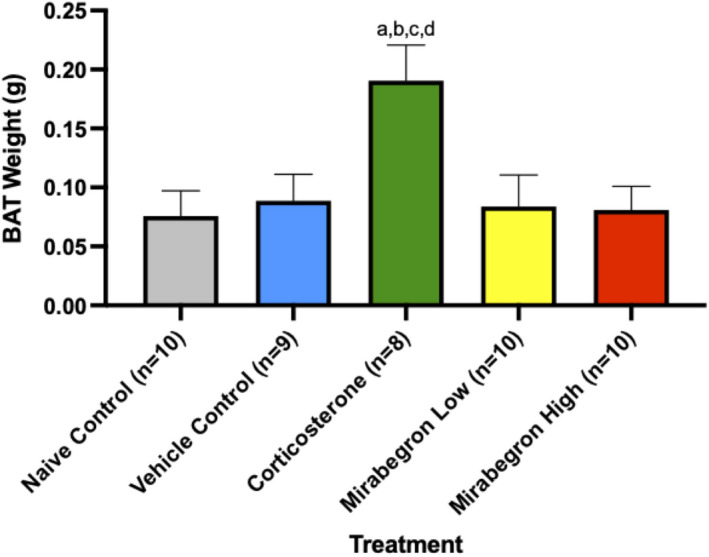
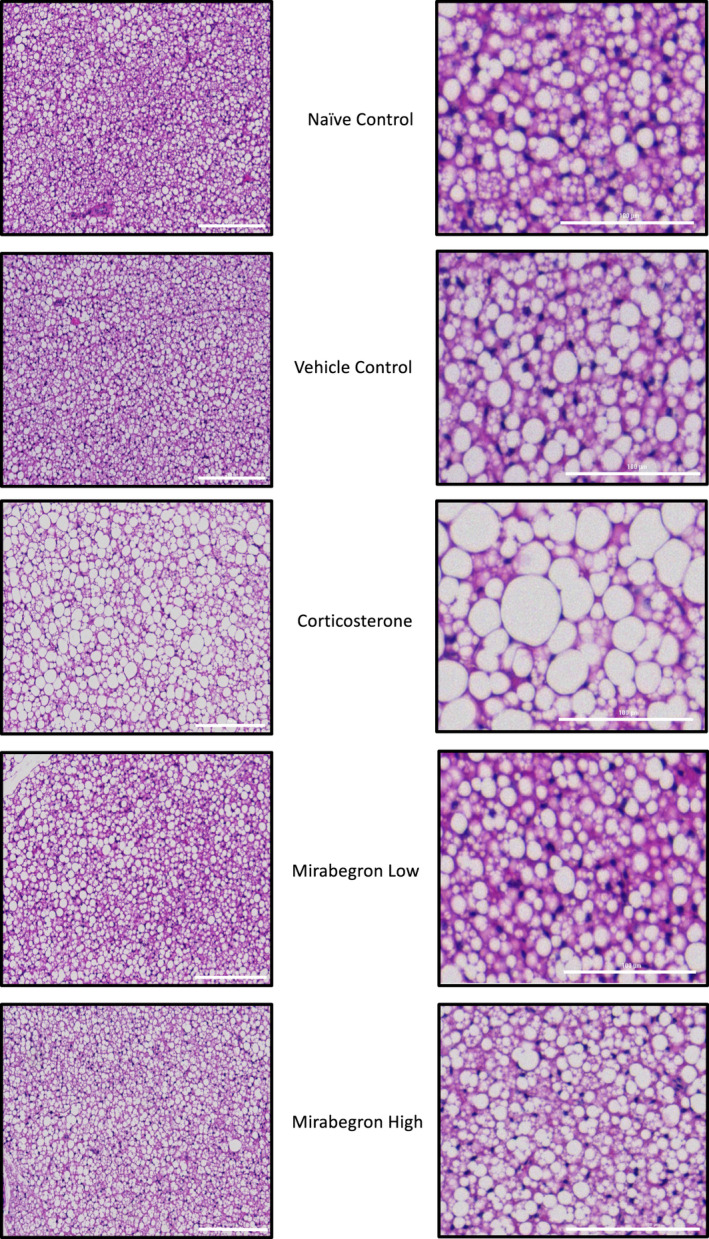
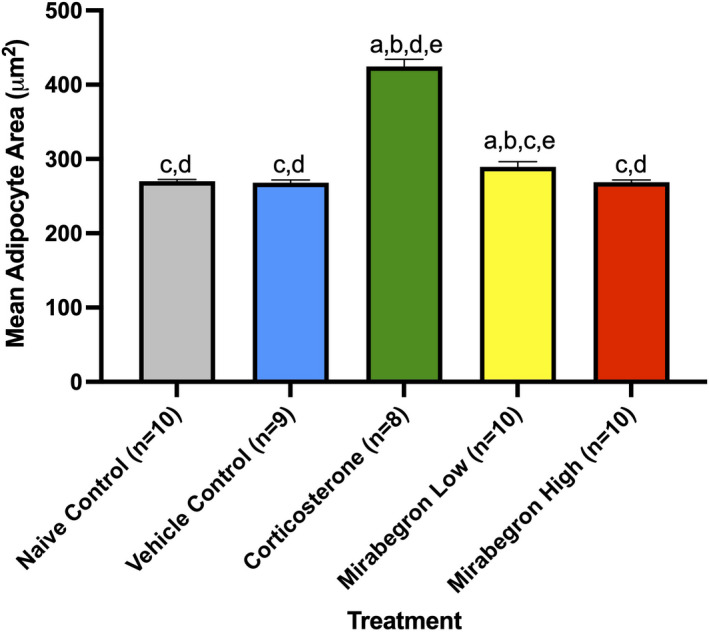
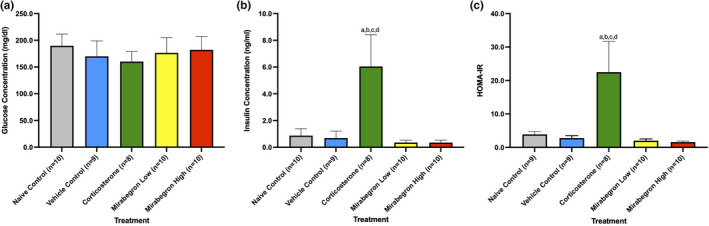
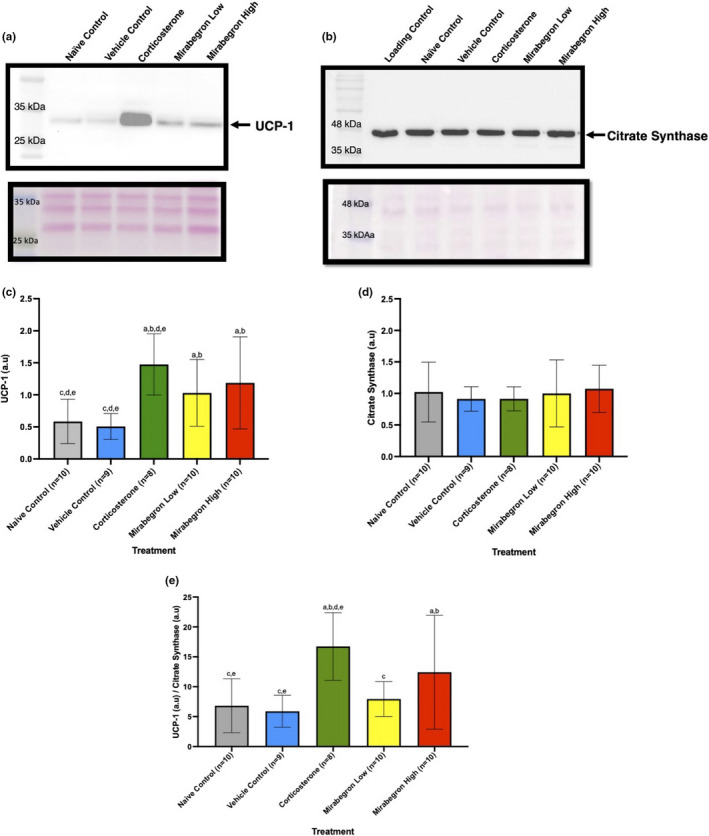
Adipose tissue (AT) has been found to exist in two predominant forms, white and brown. White adipose tissue (WAT) is the body's conventional storage organ, and brown adipose tissue (BAT) is responsible for non-shivering thermogenesis which allows mammals to produce heat and regulate body temperature. Studies examining BAT and its role in whole-body metabolism have found that active BAT utilizes glucose and circulating fatty acids and is associated with improved metabolic outcomes. While the beiging of WAT is a growing area of interest, the possibility of the BAT depot to "whiten" and store more triglycerides also has metabolic and health implications. Currently, there are limited studies that examine the effects of chronic stress and its ability to induce a white-like phenotype in the BAT depot. This research examined how chronic exposure to the murine stress hormone, corticosterone, for 4 weeks can affect the whitening process of BAT in C57BL/6 male mice. Separate treatments with mirabegron, a known β3-adrenergic receptor agonist, were used to directly compare the effects of corticosterone with a beiging phenotype. Corticosterone-treated mice had significantly higher body weight (p ≤ 0.05) and BAT mass (p ≤ 0.05), increased adipocyte area (p ≤ 0.05), were insulin resistant (p ≤ 0.05), and significantly elevated expressions of uncoupling protein 1 (UCP-1) in BAT (p ≤ 0.05) while mitochondrial content remained unchanged. This whitened phenotype has not been previously associated with increased uncoupling proteins under chronic stress and may represent a compensatory mechanism being initiated under these conditions. These findings have implications for the study of BAT in response to chronic glucocorticoid exposure potentially leading to BAT dysfunction and negative impacts on whole-body glucose metabolism.
Keywords: UCP-1; corticosterone; insulin resistance; metabolic syndrome; mirabegron; obesity.
© 2022 The Authors. Physiological Reports published by Wiley Periodicals LLC on behalf of The Physiological Society and the American Physiological Society.
Figures
Similar articles
-
Activation of β-adrenergic receptor signaling prevents glucocorticoid-induced obesity and adipose tissue dysfunction in male mice.Am J Physiol Endocrinol Metab. 2023 Jun 1;324(6):E514-E530. doi: 10.1152/ajpendo.00259.2022. Epub 2023 Apr 26. Am J Physiol Endocrinol Metab. 2023. PMID: 37126848
-
Overexpression of Adiponectin Receptor 1 Inhibits Brown and Beige Adipose Tissue Activity in Mice.Int J Mol Sci. 2021 Jan 18;22(2):906. doi: 10.3390/ijms22020906. Int J Mol Sci. 2021. PMID: 33477525 Free PMC article.
-
A single day of high-fat diet feeding induces lipid accumulation and insulin resistance in brown adipose tissue in mice.Am J Physiol Endocrinol Metab. 2019 Nov 1;317(5):E820-E830. doi: 10.1152/ajpendo.00123.2019. Epub 2019 Aug 6. Am J Physiol Endocrinol Metab. 2019. PMID: 31386566
-
Loading and firing the brown adipocyte.Adipocyte. 2018 Jan 2;7(1):4-11. doi: 10.1080/21623945.2017.1405879. Epub 2017 Dec 22. Adipocyte. 2018. PMID: 29271697 Free PMC article. Review.
-
Brown adipose tissue and thermogenesis.Horm Mol Biol Clin Investig. 2014 Jul;19(1):25-37. doi: 10.1515/hmbci-2014-0022. Horm Mol Biol Clin Investig. 2014. PMID: 25390014 Review.
Cited by
-
Understanding the Role of Adipokines in Cardiometabolic Dysfunction: A Review of Current Knowledge.Biomolecules. 2025 Apr 23;15(5):612. doi: 10.3390/biom15050612. Biomolecules. 2025. PMID: 40427505 Free PMC article. Review.
-
A Novel Mouse Model of the Glucocorticoid Withdrawal Syndrome.J Endocr Soc. 2025 Jul 13;9(9):bvaf116. doi: 10.1210/jendso/bvaf116. eCollection 2025 Sep. J Endocr Soc. 2025. PMID: 40799777 Free PMC article.
-
Pilot investigations into the mechanistic basis for adverse effects of glucocorticoids in dysferlinopathy.Skelet Muscle. 2024 Aug 9;14(1):19. doi: 10.1186/s13395-024-00350-6. Skelet Muscle. 2024. PMID: 39123261 Free PMC article.
-
Vamorolone improves Becker muscular dystrophy and increases dystrophin protein in bmx model mice.iScience. 2023 Jun 16;26(7):107161. doi: 10.1016/j.isci.2023.107161. eCollection 2023 Jul 21. iScience. 2023. PMID: 37534133 Free PMC article.
-
Dexamethasone-associated metabolic effects in male mice are partially caused by depletion of endogenous corticosterone.Front Endocrinol (Lausanne). 2022 Aug 10;13:960279. doi: 10.3389/fendo.2022.960279. eCollection 2022. Front Endocrinol (Lausanne). 2022. PMID: 36034417 Free PMC article.
References
-
- Alcala, M. , Calderon‐Dominguez, M. , Bustos, E. , Ramos, P. , Casals, N. , Sera, D. , Viana, M. , & Herrero, L. (2017). Increased inflammation, oxidative stress and mitochondrial respiration in brown adipose tissue from obese mice. Scientific Reports, 7, 16082. 10.1038/s41598-017-16463-6 - DOI - PMC - PubMed
-
- Ayala, J. E. , Samuel, V. T. , Morton, G. J. , Obici, S. , Croniger, C. M. , Shulman, G. I. , Wasserman, D. H. , & McGuinness, O. P. (2010). Standard operating procedures for describing and performing metabolic tests of glucose homeostasis in mice. Disease Models & Mechanisms, 3, 525–534. 10.1242/dmm.006239 - DOI - PMC - PubMed
Publication types
MeSH terms
Substances
LinkOut - more resources
Full Text Sources
Medical
Research Materials
