

A deep learning method for translating 3DCT to SPECT ventilation imaging: First comparison with 81m Kr-gas SPECT ventilation imaging
- PMID: 35510535
- PMCID: PMC9545310
- DOI: 10.1002/mp.15697
A deep learning method for translating 3DCT to SPECT ventilation imaging: First comparison with 81m Kr-gas SPECT ventilation imaging
Abstract
Purpose: This study aimed to evaluate the accuracy of deep learning (DL)-based computed tomography (CT) ventilation imaging (CTVI).
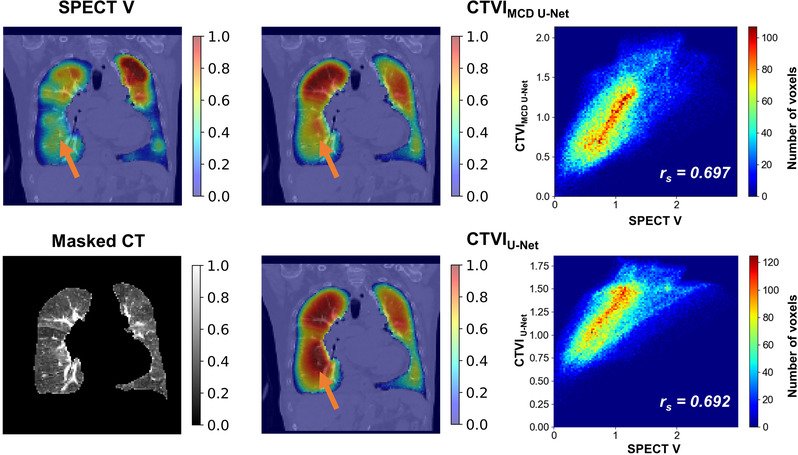
Methods: A total of 71 cases that underwent single-photon emission CT 81m Kr-gas ventilation (SPECT V) and CT imaging were included. Sixty cases were assigned to the training and validation sets, and the remaining 11 cases were assigned to the test set. To directly transform three-dimensional (3D) CT (free-breathing CT) images to SPECT V images, a DL-based model was implemented based on the U-Net architecture. The input and output data were 3DCT- and SPECT V-masked, respectively, except for whole-lung volumes. These data were rearranged in voxel size, registered rigidly, cropped, and normalized in preprocessing. In addition to a standard estimation method (i.e., without dropout during the estimation process), a Monte Carlo dropout (MCD) method (i.e., with dropout during the estimation process) was used to calculate prediction uncertainty. To evaluate the two models' (CTVIMCD U-Net , CTVIU-Net ) performance, we used fivefold cross-validation for the training and validation sets. To test the final model performances for both approaches, we applied the test set to each trained model and averaged the test prediction results from the five trained models to acquire the mean test result (bagging) for each approach. For the MCD method, the models were predicted repeatedly (sample size = 200), and the average and standard deviation (SD) maps were calculated in each voxel from the predicted results: The average maps were defined as test prediction results in each fold. As an evaluation index, the voxel-wise Spearman rank correlation coefficient (Spearman rs ) and Dice similarity coefficient (DSC) were calculated. The DSC was calculated for three functional regions (high, moderate, and low) separated by an almost equal volume. The coefficient of variation was defined as prediction uncertainty, and these average values were calculated within three functional regions. The Wilcoxon signed-rank test was used to test for a significant difference between the two DL-based approaches.
Results: The average indexes with one SD (1SD) between CTVIMCD U-Net and SPECT V were 0.76 ± 0.06, 0.69 ± 0.07, 0.51 ± 0.06, and 0.75 ± 0.04 for Spearman rs , DSChigh , DSCmoderate , and DSClow , respectively. The average indexes with 1SD between CTVIU-Net and SPECT V were 0.72 ± 0.05, 0.66 ± 0.04, 0.48 ± 0.04, and 0.74 ± 0.06 for Spearman rs , DSChigh , DSCmoderate , and DSClow , respectively. These indexes between CTVIMCD U-Net and CTVIU-Net showed no significance difference (Spearman rs , p = 0.175; DSChigh , p = 0.123; DSCmoderate , p = 0.278; DSClow , p = 0.520). The average coefficient of variations with 1SD were 0.27 ± 0.00, 0.27 ± 0.01, and 0.36 ± 0.03 for the high-, moderate-, and low-functional regions, respectively, and the low-functional region showed a tendency to exhibit larger uncertainties than the others.
Conclusion: We evaluated DL-based framework for estimating lung-functional ventilation images only from CT images. The results indicated that the DL-based approach could potentially be used for lung-ventilation estimation.
Keywords: deep learning; functional imaging; radiotherapy.
© 2022 The Authors. Medical Physics published by Wiley Periodicals LLC on behalf of American Association of Physicists in Medicine.
Conflict of interest statement
The authors declare that they have no known competing financial interests or personal relationships that could have appeared to influence the work reported in this paper.
Figures


Similar articles
-
A deep learning method for producing ventilation images from 4DCT: First comparison with technegas SPECT ventilation.Med Phys. 2020 Mar;47(3):1249-1257. doi: 10.1002/mp.14004. Epub 2020 Jan 28. Med Phys. 2020. PMID: 31883382
-
The VAMPIRE challenge: A multi-institutional validation study of CT ventilation imaging.Med Phys. 2019 Mar;46(3):1198-1217. doi: 10.1002/mp.13346. Epub 2019 Feb 1. Med Phys. 2019. PMID: 30575051 Free PMC article.
-
A deep learning model for translating CT to ventilation imaging: analysis of accuracy and impact on functional avoidance radiotherapy planning.Jpn J Radiol. 2024 Jul;42(7):765-776. doi: 10.1007/s11604-024-01550-2. Epub 2024 Mar 27. Jpn J Radiol. 2024. PMID: 38536558
-
Imaging of regional ventilation: Is CT ventilation imaging the answer? A systematic review of the validation data.Radiother Oncol. 2019 Aug;137:175-185. doi: 10.1016/j.radonc.2019.03.010. Epub 2019 May 23. Radiother Oncol. 2019. PMID: 31129503
-
Single photon emission computed tomography (SPECT) or positron emission tomography (PET) imaging for radiotherapy planning in patients with lung cancer: a meta-analysis.Sci Rep. 2020 Sep 10;10(1):14864. doi: 10.1038/s41598-020-71445-5. Sci Rep. 2020. PMID: 32913277 Free PMC article.
Cited by
-
Perfusion estimation from dynamic non-contrast computed tomography using self-supervised learning and a physics-inspired U-net transformer architecture.Int J Comput Assist Radiol Surg. 2025 May;20(5):959-970. doi: 10.1007/s11548-025-03323-2. Epub 2025 Jan 20. Int J Comput Assist Radiol Surg. 2025. PMID: 39832070 Free PMC article.
-
Artificial intelligence uncertainty quantification in radiotherapy applications - A scoping review.Radiother Oncol. 2024 Dec;201:110542. doi: 10.1016/j.radonc.2024.110542. Epub 2024 Sep 17. Radiother Oncol. 2024. PMID: 39299574 Free PMC article.
-
Motion and anatomy dual aware lung ventilation imaging by integrating Jacobian map and average CT image using dual path fusion network.Med Phys. 2025 Jan;52(1):246-256. doi: 10.1002/mp.17466. Epub 2024 Oct 21. Med Phys. 2025. PMID: 39432032 Free PMC article.
-
Artificial Intelligence Uncertainty Quantification in Radiotherapy Applications - A Scoping Review.medRxiv [Preprint]. 2024 May 13:2024.05.13.24307226. doi: 10.1101/2024.05.13.24307226. medRxiv. 2024. Update in: Radiother Oncol. 2024 Dec;201:110542. doi: 10.1016/j.radonc.2024.110542. PMID: 38798581 Free PMC article. Updated. Preprint.
References
MeSH terms
Grants and funding
LinkOut - more resources
Full Text Sources
Research Materials
