Electric Current Detection Based on the MR Signal Magnitude Decay
- PMID: 35510691
- PMCID: PMC9325414
- DOI: 10.1002/mrm.29278
Electric Current Detection Based on the MR Signal Magnitude Decay
Abstract
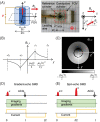
Purpose: Conventional current density imaging method, which relies on the detection of the magnetic field induced by the current in an image phase, is demanding and difficult to perform. In this study, a much simpler signal-magnitude-decay (SMD)-based current detection method is proposed.
Methods: Conductive test and biological samples were imaged at various TE times using the gradient- or spin-echo imaging sequences with superimposed constant or bipolar currents, respectively. The SMD curve was sampled for each image voxel, which enabled voxel-vise current density calculation by fitting an appropriate SMD model curve to the measured SMD curve. Effect of the voxel size on the signal decay and precision of the current density calculation was studied as well.
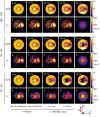
Results: It was shown theoretically, as well as verified by experiments on test and biological samples, that the current flowing though the sample creates an inhomogeneous magnetic field, which, as a consequence has a faster signal decay. Estimated current density from the measured signal decay increase agreed reasonably well with the actual current density, especially with the larger voxel sizes and longer times to signal acquisition. The sensitivity of the SMD method is up to the sensitivity of the current density imaging method.
Conclusion: SMD method of current detection is not limited to any particular sample orientation or geometry, and any pulse sequence capable of acquisition of the current-induced signal evolution in a voxel can be used for it. This widens the scope of its application from tissues to in vivo studies on animals and humans.
Keywords: current-induced magnetic field gradient; electric current detection; gradient-echo imaging; signal magnitude decay.
© 2022 The Author. Magnetic Resonance in Medicine published by Wiley Periodicals LLC on behalf of International Society for Magnetic Resonance in Medicine.
Figures


Similar articles
-
Improved conductivity reconstruction from multi-echo MREIT utilizing weighted voxel-specific signal-to-noise ratios.Phys Med Biol. 2012 Jun 7;57(11):3643-59. doi: 10.1088/0031-9155/57/11/3643. Phys Med Biol. 2012. PMID: 22596083
-
Multishot echo-planar MREIT for fast imaging of conductivity, current density, and electric field distributions.Magn Reson Med. 2018 Jan;79(1):71-82. doi: 10.1002/mrm.26638. Epub 2017 Feb 16. Magn Reson Med. 2018. PMID: 28205251 Free PMC article.
-
Human in-vivo brain magnetic resonance current density imaging (MRCDI).Neuroimage. 2018 May 1;171:26-39. doi: 10.1016/j.neuroimage.2017.12.075. Epub 2017 Dec 28. Neuroimage. 2018. PMID: 29288869
-
Modeling magnitude and phase neuronal current MRI signal dependence on echo time.Magn Reson Med. 2010 Dec;64(6):1832-7. doi: 10.1002/mrm.22569. Magn Reson Med. 2010. PMID: 20665823 Free PMC article.
-
MR pulse sequences: what every radiologist wants to know but is afraid to ask.Radiographics. 2006 Mar-Apr;26(2):513-37. doi: 10.1148/rg.262055063. Radiographics. 2006. PMID: 16549614 Review.
References
-
- Manassen Y, Shalev E, Navon G. Mapping of electrical circuits using chemical‐shift imaging. J Magn Reson. 1988;76:371‐374.
-
- Joy ML. MR current density and conductivity imaging: the state of the art. Conf Proc IEEE Eng Med Biol Soc. 2004;2004:5315‐5319. - PubMed
-
- Joy M, Scott G, Henkelman M. In vivo detection of applied electric currents by magnetic resonance imaging. Magn Reson Imaging. 1989;7:89‐94. - PubMed
-
- Scott GC, Joy MG, Armstrong RL, Henkelman RM. Measurement of nonuniform current density by magnetic resonance. IEEE Trans Med Imaging. 1991;10:362‐374. - PubMed
-
- Scott GC, Joy MLG, Armstrong RL, Henkelman RM. Sensitivity of magnetic‐resonance current‐density imaging. J Magn Reson. 1992;97:235‐254. - PubMed
Publication types
MeSH terms
LinkOut - more resources
Full Text Sources
Medical

