. 2022 Aug;235(4):1470-1485.
doi: 10.1111/nph.18198. Epub 2022 May 25.

PEAPOD repressors modulate and coordinate developmental responses to light intensity in Arabidopsis

Affiliations

PEAPOD repressors modulate and coordinate developmental responses to light intensity in Arabidopsis

Derek W R White. New Phytol. 2022 Aug.

Abstract

Higher plants adapt to different light intensities by altering hypocotyl elongation, stomatal density, seed size, and flowering time. Despite the importance of this developmental plasticity, knowledge of the underlying genetic and molecular mechanisms modulating and coordinating responses to light intensity remains incomplete. Here, I report that in Arabidopsis the PEAPOD (PPD) repressors PPD1 and PPD2 prevent exaggerated responses to light intensity. Genetic and transcriptome analyses, of a ppd deletion mutant and a PPD1 overexpression genotype, were used to identify how PPD repressors modulate the light signalling network. A ppd1/ppd2 deletion mutant has elongated hypocotyls, elevated stomatal density, enlarged seed, and delayed flowering, whereas overexpression of PPD1 results in the reverse. Transcription of both PPD1 and PPD2, upregulated in low light and downregulated in higher light, is activated by PHYTOCHROME INTERACTING FACTOR 4. I found PPDs modulate light signalling by negative regulation of SUPPRESSOR OF phyA-105 (SPA1) transcription. Whereas PPDs coordinate many of the responses to light intensity - hypocotyl elongation, flowering time, and stomatal density - by repression/de-repression of SPA1, PPD regulation of seed size occurs independent of SPA1. In conclusion PPD repressors modulate and coordinate developmental responses to light intensity by altering light signal transduction.

Keywords: PEAPOD; SPA1; gene regulation; light signalling; photomorphogenesis; repressor.


Figures

Fig. 1
Fig. 1
PEAPODs (PPDs) regulate seedling hypocotyl length in Arabidopsis thaliana. (a) Seedlings of wild‐type, Δppd mutant, and mutant complemented with a PPD1 transgene (PPD1C‐1, PPD1C‐2, and PPD1‐OE) all in a Landsberg erecta (Ler) ecotype background. (b) Hypocotyl lengths of n > 30 of each genotype shown in (a). (c) PPD1 expression levels in PPD1C‐1, PPD1C‐2 and PPD1‐OE seedlings, relative to Ler wild‐type, determined by quantitative reverse transcription PCR. (d) Seedlings of wild‐type, Δppd mutant, PPD1‐OE transgenic and transfer DNA insertion mutations in PPD1 (ppd1‐1, ppd1‐2) or PPD2 (ppd2‐1) all in a Col‐0 ecotype background. (e) Hypocotyl lengths of n > 30 of each genotype shown in (d). (f) Comparison of the number of protruding epidermal cells in a file the length of hypocotyls of Col‐0, Δppd, and PPD1‐OE seedlings. (g) Mean lengths of individual protruding epidermal cells in files from apical to basal position on hypocotyls of Col‐0, Δppd, and PPD1‐OE seedlings. Cell numbers and lengths were measured for eight hypocotyls of each genotype. Bar, 2 mm. Error bars represent mean ± SEM. Seedlings sampled 6 d post‐germination were grown in soil at 22°C, with a 16 h : 8 h, white light (180 µmol m−2 s−1) : dark cycle. The statistical significance in (b, e, f) was determined by one‐way ANOVA, with Dunnet's post hoc analysis (P < 0.001). Equivalent groups are denoted by different letters. Box plots denote a range from the first to the third quartiles, with the median indicated by a narrow horizontal line, the fifth percentile by a thick horizontal line, and the 95th percentile by a circle. The whiskers below and above the box plot are 1.5 times the interquartile range. The statistical significance in (c) was determined with Student's t‐test, ns, not significant. **, P < 0.001.
Fig. 2
Fig. 2
PEAPOD (PPD) expression is regulated by light intensity and modulates photomorphogenesis in Arabidopsis thaliana. (a) Effect of darkness (Dc), continuous red (Rc) or blue (Bc) light at 10 µmol−2 s−1, or 16 h : 8 h, white light (60 µmol−2 s−1) : darkness (W 60), on the hypocotyl length of wild‐type, Δppd, and PPD1‐OE seedlings, all in Col‐0 ecotype background, 6 d post‐germination. Different letters indicate statistically equivalent groups as assessed by one‐way ANOVA with Tukey's post hoc analysis (P < 0.05). Box plots denote a range from the first to the third quartiles, with the median indicated by a narrow horizontal line, the fifth percentile by a thick horizontal line, and the 95th percentile by a circle. The whiskers below and above the box plot are 1.5 times the interquartile range. (b) Comparison of PPD1 and PPD2 expression in Col‐0 seedlings grown with high (180 µmol m−2 s−1) relative to low (20 µmol m−2 s−1) white light intensity. (c) Expression of PPD1 and PPD2 in mutants phyB, cry1, cop1‐6, hy5, and pif4‐2 or overexpression transgenic PHYBOE and 35SPIF4‐MYC seedlings grown with 180 µmol m−2 s−1 white light intensity, relative to wild‐type (WT). Error bars represent mean ± SEM. Statistical significance differences in (b, c) from wild‐type were determined by the Student's t‐test, *, P < 0.01; **, P < 0.001. Differences between PPD1 and PPD2 were not significant. Seedlings used for the quantitative reverse transcription PCR expression analysis were sampled 6 d post‐germination and grown in soil at 22°C, with a 16 h : 8 h, light : dark cycle.
Fig. 3
Fig. 3
Genetic analysis shows that PEAPODs (PPDs) are positive regulators of photomorphogenesis and a component of light signalling in Arabidopsis thaliana. (a) Hypocotyl length of Landsberg erecta (Ler) wild‐type, Δppd Ler, phyB, phyB;Δppd, phyBOE, and phyBOE;Δppd. phyB, phytochrome B.(b) Hypocotyl length of Col‐0 wild‐type, Δppd Col‐0, cry1, cry1;Δppd, hy5, hy5;Δppd, pif4‐2, and pif4‐2;Δppd seedlings. cry1, cryptochrome 1; hy5, elongated hypocotyl 5; pif4, phytochrome interacting factor 4. Seedlings were sampled after 6 d growth in 180 µmol m−2 s−1 light, 16 h : 8h, light : dark conditions. n > 30 for each genotype. Statistical significance differences were determined by one‐way ANOVA followed by Tukey's post hoc analysis (P < 0.05). Different letters denote equivalent groups. Box plots denote a range from the first to the third quartiles, with the median indicated by a narrow horizontal line, the fifth percentile by a thick horizontal line, and the 95th percentile by a circle. The whiskers below and above the box plot are 1.5 times the interquartile range.
Fig. 4
Fig. 4
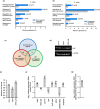
Comparison of genome‐wide differential gene expression between wild‐type and Δppd mutant revealed PEAPODs (PPDs) regulate the light signalling network in Arabidopsis thaliana (At). A selected subset of Gene Ontology terms significantly enriched in genes identified by RNA‐sequencing analysis is shown: (a) downregulated; (b) upregulated. (c) Venn diagram showing the overlap of downregulated and upregulated Δppd differentially expressed genes (DEGs) with light‐regulated ELONGATED HYPOCOTYL 5 (HY5) direct target genes. (d) Western blot detection of HY5 protein in wild‐type, Δppd, and PPD1‐OE seedlings. HY5 was detected with an anti‐HY5 (N2) antibody, and blots were reprobed with an anti‐α‐ACTIN antibody as loading control. (e) Relative HY5 levels normalized against α‐ACTIN loading controls using ImageJ. Three biological replicates. (f) Quantitative reverse transcription PCR analysis of (SUPPRESSOR OF phyA‐105) SPA1 transcript levels in Δppd, PPD1‐OE, cop1‐6, hy5, hy5;Δppd, pif4‐2, 35SPIF4‐MYC, and kix8;kix9 seedlings, relative to Col‐0 wild‐type. cop1, constitutive photomorphogenic 1; hy5, elongated hypocotyl 5; kix, kinase‐inducible domain interacting; pif4, phytochrome interacting factor 4. (g) Comparison of SPA1 expression in Col‐0 seedlings grown with high (180 µmol m−2 s−1) relative to low (20 µmol m−2 s−1) white light intensity. Error bars represent mean ± SEM. Statistical significance differences from wild‐type were determined by Student's t‐test, *, P < 0.01; **, P < 0.001.
Fig. 5
Fig. 5
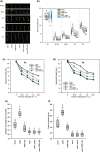
SUPPRESSOR OF phyA‐105 (SPA1) is essential for PEAPOD (PPD) modulation of photomorphogenesis and flowering time in Arabidopsis thaliana. (a) Seedlings of Col‐0, Δppd mutant, PPD1‐OE, spa1, spa1;Δppd, and spa1;PPD1‐OE, after 6 d growth in either 180 µmol m−2 s−1 (W 180) or 60 µmol m−2 s−1 (W 60) white light 16 h : 8 h, light : dark or continuous red (Rc) or blue (Bc) light at 10 µmol m−2 s−1, or continuous dark (Dc). (b) Hypocotyl lengths of n > 30 of each genotype and light condition shown in (a). Fluence dose response curves for seedlings of Col‐0, Δppd mutant, PPD1‐OE, spa1, spa1;Δppd, and spa1;PPD1‐OE, in continuous (c) red or (d) blue light, after 6 d (n = 20). Flowering time for plants grown in short day length of 12 h : 12 h, light : dark was determined as (e) number of leaves at bolt and (f) days to flowering, for n = 12 for each genotype. Statistical significance differences from wild‐type were determined by one‐way ANOVA followed by Tukey's post hoc analysis (P < 0.05). Different letters denote equivalent groups. Box plots denote a range from the first to the third quartiles, with the median indicated by a narrow horizontal line, the fifth percentile by a thick horizontal line, and the 95th percentile by a circle. The whiskers below and above the box plot are 1.5 times the interquartile range. Error bars in (c) and (d) are ± SEM.
Fig. 6
Fig. 6
SUPPRESSOR OF phyA‐105 (SPA1) is required for PEAPOD (PPD) regulation of meristemoid epidermal cell proliferation and stomatal density in Arabidopsis thaliana. (a) Photographs of Col‐0, Δppd, PPD1‐OE, spa1, spa1; Δppd, and spa1;PPD1‐OE plants at 18 d. (b) Side view of third leaf (L3) at 18 d. (c) Representative drawings of cells in the abaxial epidermis of the third leaves of spa1, Δppd, and Δppd;spa1 18‐d‐old plants. Stomata are illustrated in yellow and meristemoids in red. (d) Stomatal density on hypocotyls of Col‐0, Δppd, PPD1‐OE, spa1, spa1;Δppd, and spa1;PPD1‐OE seedlings at 6 d post‐germination, n = 40. Statistical significance differences from wild‐type or PPD1‐OE were determined by one‐way ANOVA with Tukey's post hoc test (P < 0.05). Different letters indicate statistically equivalent groups. Box plots denote a range from the first to the third quartiles, with the median indicated by a narrow horizontal line, the fifth percentile by a thick horizontal line, and the 95th percentile by a circle. The whiskers below and above the box plot are 1.5 times the interquartile range. Plants and seedlings were grown at 22°C, with a 16 h : 8 h, white light (180 µmol m−2 s−1) : dark cycle.
Fig. 7
Fig. 7
A proposed model for PEAPOD (PPD) repressor modulation of light signal transmission. In low light the concerted action of reduced ELONGATED HYPOCOTYL 5 (HY5) activation and PPD repression limits SUPPRESSOR OF phyA‐105 (SPA1) expression resulting in increased sensitivity of light signalling. In high light, enhanced HY5 activation and PPD de‐repression of SPA1 expression limits light signalling. COP1, CONSTITUTIVE PHOTOMORPHOGENIC 1; cry1, cryptochrome 1; HFR1, LONG HYPOCOTYL IN FAR‐RED; phyB, phytochrome B; PIF4, PHYTOCHROME INTERACTING FACTOR 4. Thick lines indicate strong action, and thin lines indicate weaker effects. Arrows represent activation, and bars represent repression. Solid lines represent direct action, whereas unknown molecular mechanisms are represented by dashed lines. [Correction added after online publication 25 May 2022: the right‐hand panel of the figure has been updated.]

Similar articles

Cited by

References

    1. Al‐Sady B, Ni W, Kircher S, Schäfer E, Quail PH. 2006. Photoactivated phytochrome induces rapid PIF3 phosphorylation prior to proteasome‐mediated degradation. Molecular Cell 23: 439–446. - PubMed
    1. Baekelandt A, Pauwels L, Wang Z, Li N, De Milde L, Natran A, Vermeersch M, Li Y, Goossens A, Inzé D. 2018. Arabidopsis leaf flatness is regulated by PPD2 and NINJA through repression of CYCLIN D3 genes. Plant Physiology 178: 217–232. - PMC - PubMed
    1. Bai Y, Meng Y, Huang D, Qi Y, Chen M. 2011. Origin and evolutionary analysis of the plant‐specific TIFY transcription factor family. Genomics 98: 128–136. - PubMed
    1. Balcerowicz M, Fittinghoff K, Wirthmueller L, Maier A, Fackendahl P, Fiene G, Koncz C, Hoecker U. 2011. Light exposure of Arabidopsis seedlings causes rapid de‐stabilization as well as selective post‐translational inactivation of the repressor of photomorphogenesis SPA2. The Plant Journal 65: 712–723. - PubMed
    1. Besbrugge N, Van Leene J, Eeckhout D, Cannoot B, Kulkarni SR, De Winne N, Persiau G, Van De Slijke E, Bontinck M, Aesaert S et al. 2018. GSyellow, a multifaceted tag for functional protein analysis in monocot and dicot plants. Plant Physiology 177: 447–464. - PMC - PubMed

MeSH terms

LinkOut - more resources