. 2022 Oct 1;144(10):101012.
doi: 10.1115/1.4054485.

A Computational Framework for Atrioventricular Valve Modeling Using Open-Source Software

Affiliations

A Computational Framework for Atrioventricular Valve Modeling Using Open-Source Software

Wensi Wu et al. J Biomech Eng. .

Abstract

Atrioventricular valve regurgitation is a significant cause of morbidity and mortality in patients with acquired and congenital cardiac valve disease. Image-derived computational modeling of atrioventricular valves has advanced substantially over the last decade and holds particular promise to inform valve repair in small and heterogeneous populations, which are less likely to be optimized through empiric clinical application. While an abundance of computational biomechanics studies has investigated mitral and tricuspid valve disease in adults, few studies have investigated its application to vulnerable pediatric and congenital heart populations. Further, to date, investigators have primarily relied upon a series of commercial applications that are neither designed for image-derived modeling of cardiac valves nor freely available to facilitate transparent and reproducible valve science. To address this deficiency, we aimed to build an open-source computational framework for the image-derived biomechanical analysis of atrioventricular valves. In the present work, we integrated an open-source valve modeling platform, SlicerHeart, and an open-source biomechanics finite element modeling software, FEBio, to facilitate image-derived atrioventricular valve model creation and finite element analysis. We present a detailed verification and sensitivity analysis to demonstrate the fidelity of this modeling in application to three-dimensional echocardiography-derived pediatric mitral and tricuspid valve models. Our analyses achieved an excellent agreement with those reported in the literature. As such, this evolving computational framework offers a promising initial foundation for future development and investigation of valve mechanics, in particular collaborative efforts targeting the development of improved repairs for children with congenital heart disease.

Keywords: atrioventricular valves; contact potential; finite element modeling; open-source; uncertainty analysis; valve mechanics.


Figures

FE modeling pipeline from 3DE image, demonstrated on tricuspid valve: valve construction process from 3DE image to FE model: (a) define annulus and free edge control points (3D Slicer SlicerHeart), (b) create leaflet segmentation (SlicerHeart), (c) create splines (SlicerHeart), (d) initialize Non-Uniform Rational B-Spline (NURBS) surface (Autodesk Fusion 360), (e) adjust NURBS surface to segmentation (Fusion 360), and (f) project chordae onto leaflets (SlicerHeart). The development of leaflet medial surface extraction and NURBS editing is underway in SlicerHeart to allow all functionality in a single open-source workflow.
Fig. 1
FE modeling pipeline from 3DE image, demonstrated on tricuspid valve: valve construction process from 3DE image to FE model: (a) define annulus and free edge control points (3D Slicer SlicerHeart), (b) create leaflet segmentation (SlicerHeart), (c) create splines (SlicerHeart), (d) initialize Non-Uniform Rational B-Spline (NURBS) surface (Autodesk Fusion 360), (e) adjust NURBS surface to segmentation (Fusion 360), and (f) project chordae onto leaflets (SlicerHeart). The development of leaflet medial surface extraction and NURBS editing is underway in SlicerHeart to allow all functionality in a single open-source workflow.
FE modeling pipeline from 3D echocardiographic image, demonstrated on tricuspid valve: chordae tendineae modeling: (a) identify papillary muscles (3D Slicer SlicerHeart), (b) define chordal insertion area, indicated here by the shaded region (SlicerHeart), and (c) project chordae (SlicerHeart)
Fig. 2
FE modeling pipeline from 3D echocardiographic image, demonstrated on tricuspid valve: chordae tendineae modeling: (a) identify papillary muscles (3D Slicer SlicerHeart), (b) define chordal insertion area, indicated here by the shaded region (SlicerHeart), and (c) project chordae (SlicerHeart)
Geometric representation of image-derived mitral and tricuspid valve FE models: (a) model of open mitral valve with annulus, leaflets, and chordae tendineae defined, (b) model of closed mitral valve with leaflet regions defined, (c) model of an open tricuspid valve with annulus, leaflets, and chordae tendineae defined, and (d) model of a closed tricuspid valve with leaflets defined. Mitral valve annular circumference was 12.3 cm and annular area projected onto the least squares annular plane was 11.0 cm2. Tricuspid valve annular circumference was 13.1 cm and annular area projected onto the least squares annular plane was 12.0 cm2.
Fig. 3
Geometric representation of image-derived mitral and tricuspid valve FE models: (a) model of open mitral valve with annulus, leaflets, and chordae tendineae defined, (b) model of closed mitral valve with leaflet regions defined, (c) model of an open tricuspid valve with annulus, leaflets, and chordae tendineae defined, and (d) model of a closed tricuspid valve with leaflets defined. Mitral valve annular circumference was 12.3 cm and annular area projected onto the least squares annular plane was 11.0 cm2. Tricuspid valve annular circumference was 13.1 cm and annular area projected onto the least squares annular plane was 12.0 cm2.
Mitral valve stress and strain responses: (a) stress profile on the mitral valve at steady-state, (b) strain profile on the mitral valve at steady-state, (c) stress responses with coarse, medium, and fine meshes (shaded areas indicate standard deviations), (d) strain responses with coarse, medium, and fine meshes (shaded areas indicate standard deviations), (e) 95th percentile 1st principal stress responses on various mitral valve regions, and (f) 95th percentile 1st strain responses on various mitral valve regions. Results suggested that the anterior leaflet experiences higher stress and strain concentrations than the posterior leaflet.
Fig. 4
Mitral valve stress and strain responses: (a) stress profile on the mitral valve at steady-state, (b) strain profile on the mitral valve at steady-state, (c) stress responses with coarse, medium, and fine meshes (shaded areas indicate standard deviations), (d) strain responses with coarse, medium, and fine meshes (shaded areas indicate standard deviations), (e) 95th percentile 1st principal stress responses on various mitral valve regions, and (f) 95th percentile 1st strain responses on various mitral valve regions. Results suggested that the anterior leaflet experiences higher stress and strain concentrations than the posterior leaflet.
Mitral valve closing profiles: (a) location at which the slices were made (red line), and (b) valve closure configurations for coarse, medium, and fine meshes at the anterior-posterior coaptation. Nearly identical closing profiles suggested that all of the tested mesh densities were sufficient to capture valve closing behavior.
Fig. 5
Mitral valve closing profiles: (a) location at which the slices were made (red line), and (b) valve closure configurations for coarse, medium, and fine meshes at the anterior-posterior coaptation. Nearly identical closing profiles suggested that all of the tested mesh densities were sufficient to capture valve closing behavior.
Tricuspid valve stress and strain responses: (a) stress profile on the tricuspid valve at steady-state, (b) strain profile on the tricuspid valve at steady-state, (c) stress responses with coarse, medium, and fine meshes (shaded areas indicate standard deviations), (d) strain responses with coarse, medium, and fine meshes (shaded areas indicate standard deviations), (e) 95th percentile 1st principal stress responses on various tricuspid valve leaflets, (f) 95th percentile 1st principal strain responses on various tricuspid valve regions. While results suggested that the anterior leaflet experienced higher stress concentrations than the posterior and septal leaflets, 95th percentile 1st principal strains were nearly identical among the leaflets.
Fig. 6
Tricuspid valve stress and strain responses: (a) stress profile on the tricuspid valve at steady-state, (b) strain profile on the tricuspid valve at steady-state, (c) stress responses with coarse, medium, and fine meshes (shaded areas indicate standard deviations), (d) strain responses with coarse, medium, and fine meshes (shaded areas indicate standard deviations), (e) 95th percentile 1st principal stress responses on various tricuspid valve leaflets, (f) 95th percentile 1st principal strain responses on various tricuspid valve regions. While results suggested that the anterior leaflet experienced higher stress concentrations than the posterior and septal leaflets, 95th percentile 1st principal strains were nearly identical among the leaflets.
Tricuspid valve closing profiles: (a) locations at which the slices were made (red lines); valve closure configurations for coarse, medium, and fine meshes at the (b) anterior-posterior coaptation, (c) anterior-septal coaptation, and (d) posterior-septal coaptation. Septal leaflet deformation with the coarse mesh showed significantly different characteristics in comparison to the two finer meshes, suggesting that the mesh density played an important role in capturing complex curvatures, as demonstrated in the tricuspid model.
Fig. 7
Tricuspid valve closing profiles: (a) locations at which the slices were made (red lines); valve closure configurations for coarse, medium, and fine meshes at the (b) anterior-posterior coaptation, (c) anterior-septal coaptation, and (d) posterior-septal coaptation. Septal leaflet deformation with the coarse mesh showed significantly different characteristics in comparison to the two finer meshes, suggesting that the mesh density played an important role in capturing complex curvatures, as demonstrated in the tricuspid model.
The uni-axial stress–strain response comparison between the mitral and tricuspid properties. The mitral tissue displays a quadratic stress–strain relationship, whereas the tricuspid tissue displays an exponential relationship.
Fig. 8
The uni-axial stress–strain response comparison between the mitral and tricuspid properties. The mitral tissue displays a quadratic stress–strain relationship, whereas the tricuspid tissue displays an exponential relationship.
The resulting sensitivity in the 95th percentile 1st principal stresses and strains from various modeling parameters: (a) sensitivity of stress in the mitral valve, (b) sensitivity of strain in the mitral valve, (c) sensitivity of stress in the tricuspid valve, and (d) sensitivity of strain in the tricuspid valve. The main box-plots demonstrate the spread of skewness of the stresses and strains for each individual modeling parameter. The line plots display the relations between the modeling parameters and the stresses/strains. Results suggested that the mitral valve stresses and strains were most sensitive to material coefficients c1 and c2, with c0 displaying additional influence on strains; tricuspid valve stresses and strains were most sensitive to material coefficient c2. For the mitral valve, increased chordal displacement threshold led to higher stress/strain and increased chordal tension led to lower stress/strain, whereas the tricuspid valve displayed the opposite responses for stress and negligible responses for strain. Note: In (a) and (b), the curve for c1 is beneath the curve for c2.
Fig. 9
The resulting sensitivity in the 95th percentile 1st principal stresses and strains from various modeling parameters: (a) sensitivity of stress in the mitral valve, (b) sensitivity of strain in the mitral valve, (c) sensitivity of stress in the tricuspid valve, and (d) sensitivity of strain in the tricuspid valve. The main box-plots demonstrate the spread of skewness of the stresses and strains for each individual modeling parameter. The line plots display the relations between the modeling parameters and the stresses/strains. Results suggested that the mitral valve stresses and strains were most sensitive to material coefficients c1 and c2, with c0 displaying additional influence on strains; tricuspid valve stresses and strains were most sensitive to material coefficient c2. For the mitral valve, increased chordal displacement threshold led to higher stress/strain and increased chordal tension led to lower stress/strain, whereas the tricuspid valve displayed the opposite responses for stress and negligible responses for strain. Note: In (a) and (b), the curve for c1 is beneath the curve for c2.
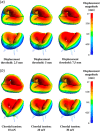
The 1st principal stress profiles at steady-state on the mitral and tricuspid valves: (a) and (b) demonstrate the differences in the stress profiles due to varying chordal displacement threshold (i.e., chordal slack length). (c) and (d) demonstrate the differences in the stress profiles due to varying chordal tension. Higher displacement threshold and lower chordal tension led to high stress on the mitral valve, but lower stress on the tricuspid valve.
Fig. 10
The 1st principal stress profiles at steady-state on the mitral and tricuspid valves: (a) and (b) demonstrate the differences in the stress profiles due to varying chordal displacement threshold (i.e., chordal slack length). (c) and (d) demonstrate the differences in the stress profiles due to varying chordal tension. Higher displacement threshold and lower chordal tension led to high stress on the mitral valve, but lower stress on the tricuspid valve.
Mitral valve systolic configurations resulting from variations in chordae modeling parameters: (a) systolic configurations subject to various displacement threshold with a fixed chordal tension at 30 mN and (b) systolic configurations subject to various chordal tension with a fixed displacement threshold at 5 mm. Higher displacement threshold or lower chordal tension force led to models with noticeable billowing.
Fig. 11
Mitral valve systolic configurations resulting from variations in chordae modeling parameters: (a) systolic configurations subject to various displacement threshold with a fixed chordal tension at 30 mN and (b) systolic configurations subject to various chordal tension with a fixed displacement threshold at 5 mm. Higher displacement threshold or lower chordal tension force led to models with noticeable billowing.
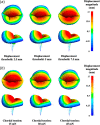
Tricuspid valve systolic configurations resulting from variations in chordae modeling parameters: (a) systolic con- figurations subject to various displacement threshold with a fixed chordal tension at 20 mN and (b) systolic configurations subject to various chordal tension with a fixed displacement threshold at 5 mm. Higher displacement threshold or lower chordal tension force led to models with noticeable billowing.
Fig. 12
Tricuspid valve systolic configurations resulting from variations in chordae modeling parameters: (a) systolic con- figurations subject to various displacement threshold with a fixed chordal tension at 20 mN and (b) systolic configurations subject to various chordal tension with a fixed displacement threshold at 5 mm. Higher displacement threshold or lower chordal tension force led to models with noticeable billowing.
The main sensitivity of the stresses and strains as a function of material constants using UncertainSCI: (a) Uncertainty in mitral valve stress, (b) uncertainty in mitral valve strain, (c) uncertainty in tricuspid valve stress, and (d) uncertainty in tricuspid valve strain. Bar plots denote the first-order Sobel indices and box plots depict the spread of stresses and strains of 45 UncertainSCI samples with fixed polynomial chaos expansion order 4 and fixed random number generator seed 0. Results were consistent with the traditional approach, with c1 and c2 influencing mitral valve stresses and strains (with additional influence of c0 on strains), and c2 influencing tricuspid valve stresses and strains.
Fig. 13
The main sensitivity of the stresses and strains as a function of material constants using UncertainSCI: (a) Uncertainty in mitral valve stress, (b) uncertainty in mitral valve strain, (c) uncertainty in tricuspid valve stress, and (d) uncertainty in tricuspid valve strain. Bar plots denote the first-order Sobel indices and box plots depict the spread of stresses and strains of 45 UncertainSCI samples with fixed polynomial chaos expansion order 4 and fixed random number generator seed 0. Results were consistent with the traditional approach, with c1 and c2 influencing mitral valve stresses and strains (with additional influence of c0 on strains), and c2 influencing tricuspid valve stresses and strains.
Biaxial testing setup: (a) The geometry and loading condition of the square specimen. The black arrows are spaced 5 mm apart on each edge and indicate the direction of the applied loads. A 2.5 N nodal force was applied at the starting point of each arrow. The 5 mm by 5 mm green patch situated at the center of the specimen denotes the region of interest (ROI) for the stress and strain response. (b) The mean stress and strain curve in the x-direction at the ROI. FEBio's approximation displays excellent alignment compared with IGA approximation. Note: stress and strain in the y-direction were identical to those in the x-direction.
Fig. 14
Biaxial testing setup: (a) The geometry and loading condition of the square specimen. The black arrows are spaced 5 mm apart on each edge and indicate the direction of the applied loads. A 2.5 N nodal force was applied at the starting point of each arrow. The 5 mm by 5 mm green patch situated at the center of the specimen denotes the region of interest (ROI) for the stress and strain response. (b) The mean stress and strain curve in the x-direction at the ROI. FEBio's approximation displays excellent alignment compared with IGA approximation. Note: stress and strain in the y-direction were identical to those in the x-direction.
The main sensitivity of the mitral valve stresses and strains as a function of material constants with varying polynomial chaos expansion (PCE) orders using UncertainSCI: (a) uncertainty in valve stress with 30 samples and PCE order 3, (b) uncertainty in valve stress with 45 samples and PCE order 4, (c) uncertainty in valve stress with 66 samples and PCE order 5, (d) uncertainty in valve strain with 30 samples and PCE order 3, (e) uncertainty in valve strain with 45 samples and PCE order 4, and (f) uncertainty in valve strain with 66 samples and PCE order 5. Bar plots denote the first-order Sobel indices and box plots depict the spread of stresses and strains of UncertainSCI samples with a fixed random seed of 0. We did not observe significant differences in the first-order Sobel indices.
Fig. 15
The main sensitivity of the mitral valve stresses and strains as a function of material constants with varying polynomial chaos expansion (PCE) orders using UncertainSCI: (a) uncertainty in valve stress with 30 samples and PCE order 3, (b) uncertainty in valve stress with 45 samples and PCE order 4, (c) uncertainty in valve stress with 66 samples and PCE order 5, (d) uncertainty in valve strain with 30 samples and PCE order 3, (e) uncertainty in valve strain with 45 samples and PCE order 4, and (f) uncertainty in valve strain with 66 samples and PCE order 5. Bar plots denote the first-order Sobel indices and box plots depict the spread of stresses and strains of UncertainSCI samples with a fixed random seed of 0. We did not observe significant differences in the first-order Sobel indices.
The main sensitivity of the mitral valve stresses and strains as a function of material constants with varying random number generator seeds using UncertainSCI: (a) uncertainty in valve stress with random seed 10, (b) uncertainty in valve stress with random seed 20, (c) uncertainty in valve stress with random seed 40, (d) uncertainty in valve strain with random seed 10, (e) uncertainty in valve strain with random seed 20, and (f) uncertainty in valve strain with random seed 40. Bar plots denote the first-order Sobel indices and box plots depict the spread of stresses and strains of 45 UncertainSCI samples with fixed polynomial chaos expansion order 4. We did not observe significant differences in the first-order Sobel indices.
Fig. 16
The main sensitivity of the mitral valve stresses and strains as a function of material constants with varying random number generator seeds using UncertainSCI: (a) uncertainty in valve stress with random seed 10, (b) uncertainty in valve stress with random seed 20, (c) uncertainty in valve stress with random seed 40, (d) uncertainty in valve strain with random seed 10, (e) uncertainty in valve strain with random seed 20, and (f) uncertainty in valve strain with random seed 40. Bar plots denote the first-order Sobel indices and box plots depict the spread of stresses and strains of 45 UncertainSCI samples with fixed polynomial chaos expansion order 4. We did not observe significant differences in the first-order Sobel indices.
The main sensitivity of the tricuspid valve stresses and strains as a function of material constants with varying polynomial chaos expansion (PCE) orders using UncertainSCI: (a) uncertainty in valve stress with 30 samples and PCE order 3, (b) uncertainty in valve stress with 45 samples and PCE order 4, (c) uncertainty in valve stress with 66 samples and PCE order 5, (d) uncertainty in valve strain with 30 samples and PCE order 3, (e) uncertainty in valve strain with 45 samples and PCE order 4, and (f) uncertainty in valve strain with 66 samples and PCE order 5. Bar plots denote the first-order Sobel indices and box plots depict the spread of stresses and strains of UncertainSCI samples with a fixed random seed of 0. We did not observe significant differences in the first-order Sobel indices.
Fig. 17
The main sensitivity of the tricuspid valve stresses and strains as a function of material constants with varying polynomial chaos expansion (PCE) orders using UncertainSCI: (a) uncertainty in valve stress with 30 samples and PCE order 3, (b) uncertainty in valve stress with 45 samples and PCE order 4, (c) uncertainty in valve stress with 66 samples and PCE order 5, (d) uncertainty in valve strain with 30 samples and PCE order 3, (e) uncertainty in valve strain with 45 samples and PCE order 4, and (f) uncertainty in valve strain with 66 samples and PCE order 5. Bar plots denote the first-order Sobel indices and box plots depict the spread of stresses and strains of UncertainSCI samples with a fixed random seed of 0. We did not observe significant differences in the first-order Sobel indices.
The main sensitivity of the tricuspid valve stresses and strains as a function of material constants with varying random number generator seeds using UncertainSCI: (a) uncertainty in valve stress with random seed 10, (b) uncertainty in valve stress with random seed 20, (c) uncertainty in valve stress with random seed 40, (d) uncertainty in valve strain with random seed 10, (e) uncertainty in valve strain with random seed 20, and (f) uncertainty in valve strain with random seed 40. Bar plots denote the first-order Sobel indices and box plots depict the spread of stresses and strains of 45 UncertainSCI samples with fixed polynomial chaos expansion order 4. We did not observe significant differences in the first-order Sobel indices.
Fig. 18
The main sensitivity of the tricuspid valve stresses and strains as a function of material constants with varying random number generator seeds using UncertainSCI: (a) uncertainty in valve stress with random seed 10, (b) uncertainty in valve stress with random seed 20, (c) uncertainty in valve stress with random seed 40, (d) uncertainty in valve strain with random seed 10, (e) uncertainty in valve strain with random seed 20, and (f) uncertainty in valve strain with random seed 40. Bar plots denote the first-order Sobel indices and box plots depict the spread of stresses and strains of 45 UncertainSCI samples with fixed polynomial chaos expansion order 4. We did not observe significant differences in the first-order Sobel indices.

Similar articles

Cited by

References

    1. Salgo, I. S. , Gorman, J. H. , Gorman, R. C. , Jackson, B. M. , Bowen, F. W. , Plappert, T. , St John Sutton, M. G. , and Edmunds, L. H. , 2002, “ Effect of Annular Shape on Leaflet Curvature in Reducing Mitral Leaflet Stress,” Circulation, 106(6), pp. 711–717.10.1161/01.CIR.0000025426.39426.83 - DOI - PubMed
    1. Grewal, J. , Suri, R. , Mankad, S. , Tanaka, A. , Mahoney, D. W. , Schaff, H. V. , Miller, F. A. , and Enriquez-Sarano, M. , 2010, “ Mitral Annular Dynamics in Myxomatous Valve Disease,” Circulation, 121(12), pp. 1423–1431.10.1161/CIRCULATIONAHA.109.901181 - DOI - PubMed
    1. Levack, M. M. , Jassar, A. S. , Shang, E. K. , Vergnat, M. , Woo, Y. J. , Acker, M. A. , Jackson, B. M. , Gorman, J. H. , and Gorman, R. C. , 2012, “ Three-Dimensional Echocardiographic Analysis of Mitral Annular Dynamics,” Circulation, 126(11_suppl_1), pp. S183–S188.10.1161/CIRCULATIONAHA.111.084483 - DOI - PMC - PubMed
    1. Lee, C. H. , Oomen, P. J. , Rabbah, J. P. , Yoganathan, A. , Gorman, R. C. , Gorman, J. H. , Amini, R. , and Sacks, M. S. , 2013, “ A High-Fidelity and Micro-Anatomically Accurate 3D Finite Element Model for Simulations of Functional Mitral Valve,” LNCS, 7945, pp. 416–424.10.1007/978-3-642-38899-6_49 - DOI - PMC - PubMed
    1. Kong, F. , Pham, T. , Martin, C. , McKay, R. , Primiano, C. , Hashim, S. , Kodali, S. , and Sun, W. , 2018, “ Finite Element Analysis of Tricuspid Valve Deformation From Multi-Slice Computed Tomography Images,” Ann. Biomed. Eng., 46(8), pp. 1112–1127.10.1007/s10439-018-2024-8 - DOI - PMC - PubMed

Publication types