. 2022 Jun 29;10(3):e0109122.
doi: 10.1128/spectrum.01091-22. Epub 2022 May 5.

SARS-CoV-2 Infection of Microglia Elicits Proinflammatory Activation and Apoptotic Cell Death

Affiliations

SARS-CoV-2 Infection of Microglia Elicits Proinflammatory Activation and Apoptotic Cell Death

Gi Uk Jeong et al. Microbiol Spectr. .

Abstract

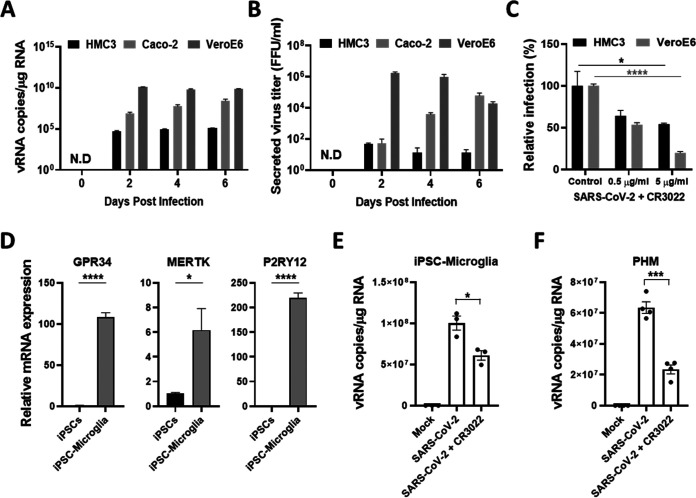
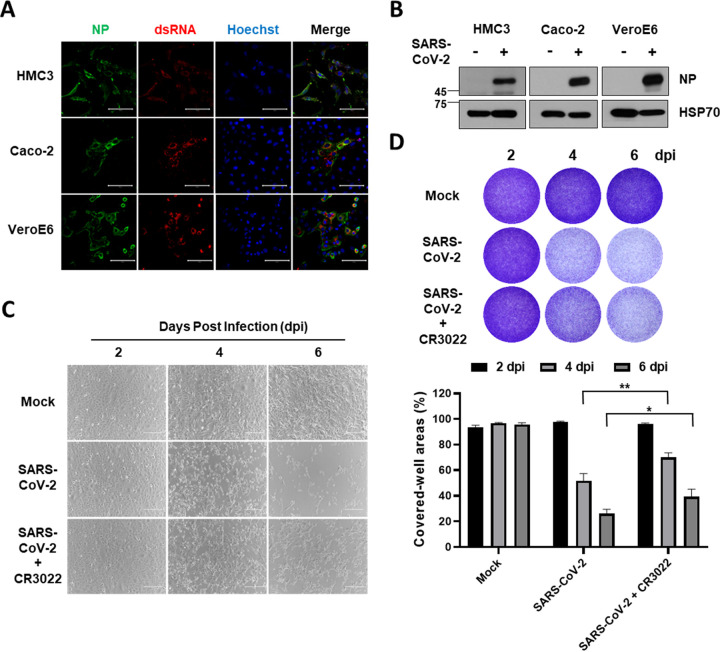
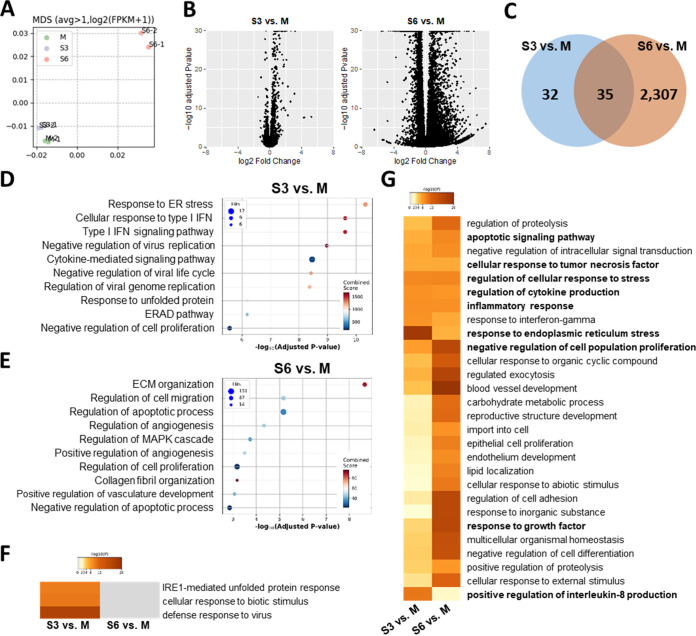
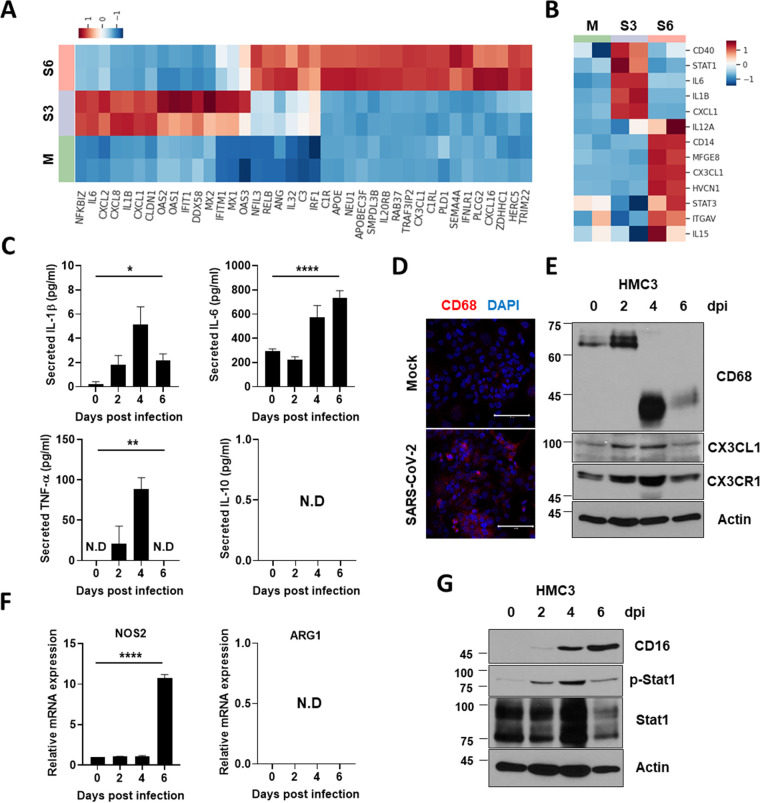
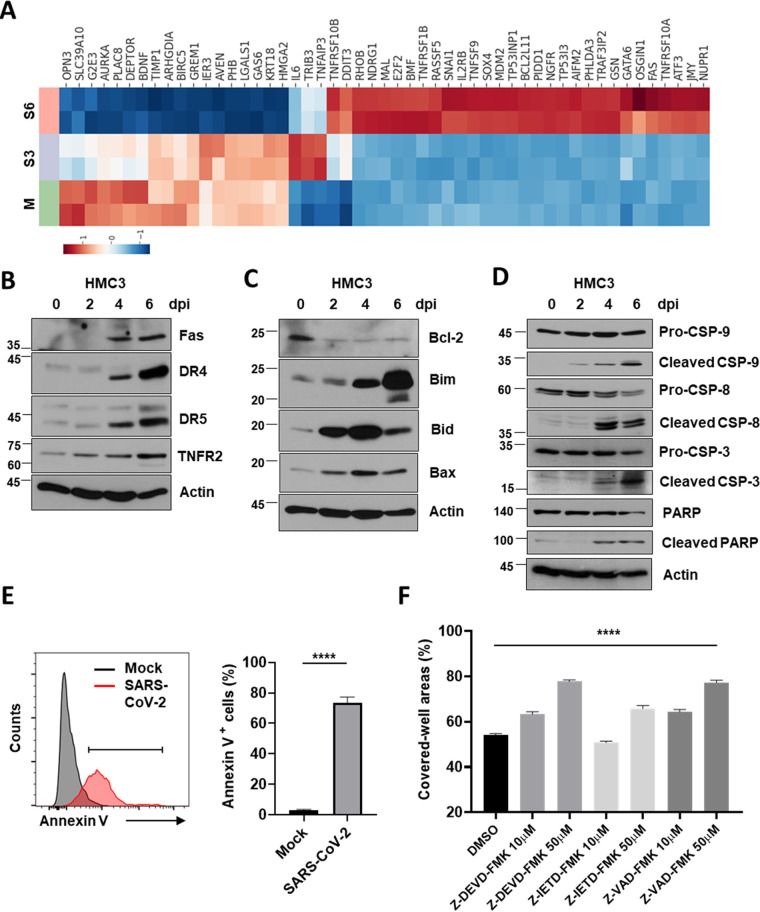
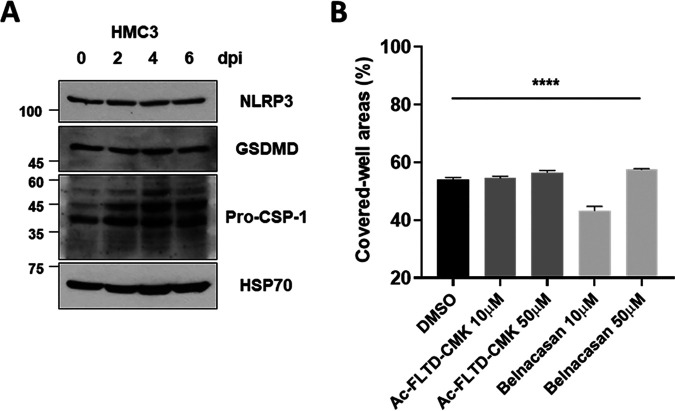
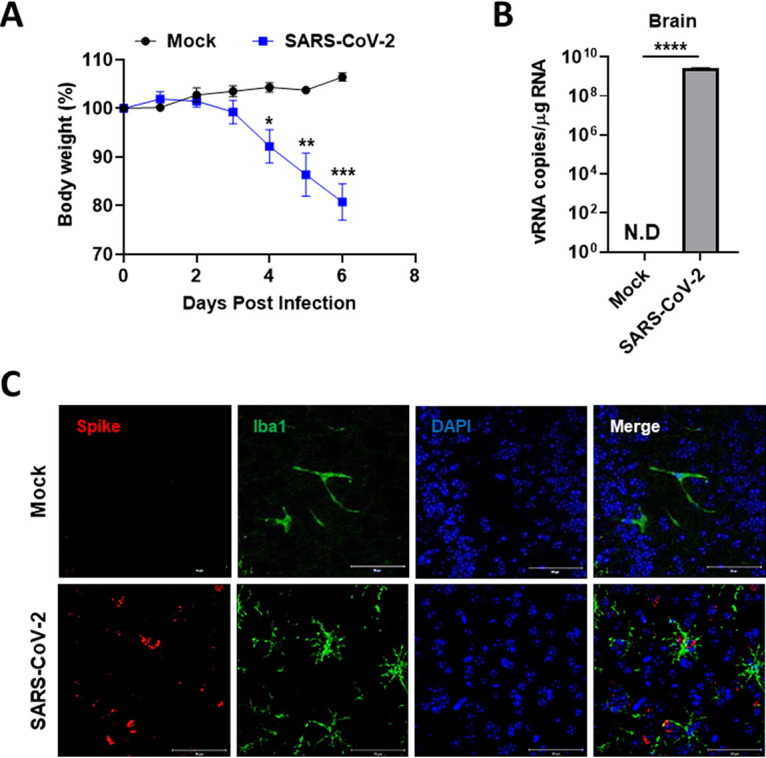
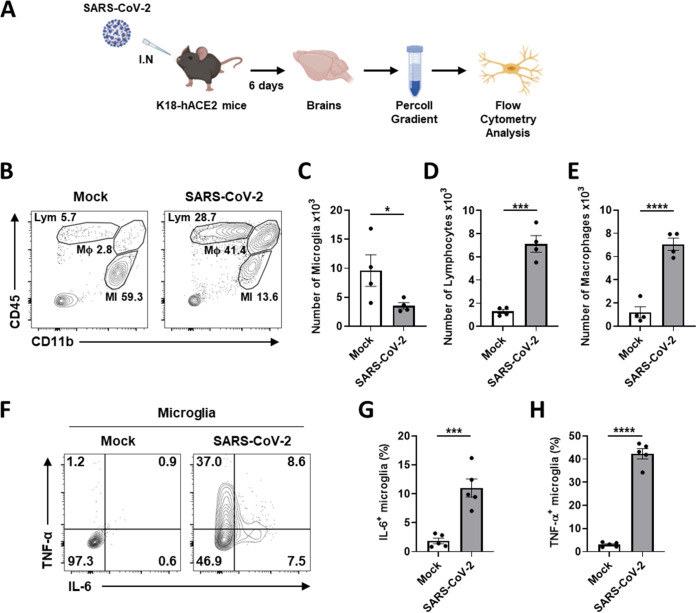
Accumulating evidence suggests that severe acute respiratory syndrome coronavirus 2 (SARS-CoV-2) infection causes various neurological symptoms in patients with coronavirus disease 2019 (COVID-19). The most dominant immune cells in the brain are microglia. Yet, the relationship between neurological manifestations, neuroinflammation, and host immune response of microglia to SARS-CoV-2 has not been well characterized. Here, we reported that SARS-CoV-2 can directly infect human microglia, eliciting M1-like proinflammatory responses, followed by cytopathic effects. Specifically, SARS-CoV-2 infected human microglial clone 3 (HMC3), leading to inflammatory activation and cell death. RNA sequencing (RNA-seq) analysis also revealed that endoplasmic reticulum (ER) stress and immune responses were induced in the early, and apoptotic processes in the late phases of viral infection. SARS-CoV-2-infected HMC3 showed the M1 phenotype and produced proinflammatory cytokines, such as interleukin (IL)-1β, IL-6, and tumor necrosis factor α (TNF-α), but not the anti-inflammatory cytokine IL-10. After this proinflammatory activation, SARS-CoV-2 infection promoted both intrinsic and extrinsic death receptor-mediated apoptosis in HMC3. Using K18-hACE2 transgenic mice, murine microglia were also infected by intranasal inoculation of SARS-CoV-2. This infection induced the acute production of proinflammatory microglial IL-6 and TNF-α and provoked a chronic loss of microglia. Our findings suggest that microglia are potential mediators of SARS-CoV-2-induced neurological problems and, consequently, can be targets of therapeutic strategies against neurological diseases in patients with COVID-19. IMPORTANCE Recent studies reported neurological and cognitive sequelae in patients with COVID-19 months after the viral infection with several symptoms, including ageusia, anosmia, asthenia, headache, and brain fog. Our conclusions raise awareness of COVID-19-related microglia-mediated neurological disorders to develop treatment strategies for the affected patients. We also indicated that HMC3 was a novel human cell line susceptible to SARS-CoV-2 infection that exhibited cytopathic effects, which could be further used to investigate cellular and molecular mechanisms of neurological manifestations of patients with COVID-19.

Keywords: M1 polarization; SARS-CoV-2; apoptosis; microglia; neuroinflammation.


Conflict of interest statement

The authors declare no conflict of interest.

Figures

FIG 1
FIG 1
SARS-CoV-2 directly infects human microglia cells. (A) HMC3, Caco-2, and Vero E6 cells were infected with one MOI of SARS-CoV-2. The total cellular RNA was extracted at 2, 4, and 6 dpi to detect the viral RNA of the SARS-CoV-2 NP gene by quantitative real-time PCR (RT-qPCR). The graph shows viral RNA copies per microgram of total cellular RNA each day. (B) The culture media derived from SARS-CoV-2-infected cells were serially diluted and used for focus forming assay. The graph shows the secreted virus titer as focus forming units (FFU). (C) The graph shows viral RNA copies per microgram of total cellular RNA at 2 dpi after treatment with the increasing amount of CR3022 neutralizing antibody. (D) RT-qPCR analysis of the expression of microglial signature genes (GPR34, MERTK, and P2RY12) in iPSC and iPSC-Microglia for the characterization of iPSC-Microglia. (E and F) Viral RNA levels of SARS-CoV-2-infected iPSC-Microglia (E) and PHM (F) in the absence/presence of CR3022 neutralizing antibody at 1 dpi. Statistically significant differences between the groups were determined by one-way analysis of variance (ANOVA; C) and Student's t test (D, E, F); *, P < 0.05; ***, P < 0.001; ****, P < 0.0001. Symbols represent mean ± SEM.
FIG 2
FIG 2
SARS-CoV-2 infection of human microglia cells elicits the cytopathic effects (CPE). (A) Confocal images of SARS-CoV-2-infected HMC3 (top row), Caco-2 (middle row), and Vero E6 (bottom row) demonstrate infection of these cells by immunofluorescence assay with anti-SARS-CoV-2 NP and anti-dsRNA antibodies. Scale bar = 100 μm. (B) Western blotting of SARS-CoV-2 NP in each infected cell. The 70-kDa heat shock protein (Hsp70) served as the loading control. (C) Phase-contrast images of the mock or SARS-CoV-2-infected HMC3 in the absence/presence of CR3022 neutralizing antibody at 2, 4, and 6 dpi, indicating cell death as the CPE by microscopy. Scale bar = 200 μm. (D) Images of crystal violet staining of the mock or SARS-CoV-2-infected HMC3 in the absence/presence of CR3022 neutralizing antibody, plated in the 12-well (upper). The graph shows the percent measurements of crystal violet-stained cell covered areas by the ImmunoSpot reader (lower). Statistically significant differences between the groups were determined by Student's t test; *, P < 0.05; **, P < 0.01. Symbols represent mean ± SEM.
FIG 3
FIG 3
RNA-sequencing analysis of SARS-CoV-2-infected HMC3 cells. (A) Multidimensional analysis of genes expressed over one mean fragment per kilobase per million mapped fragments (FPKM). (B) Volcano plots of SARS-CoV-2-infected HMC3 cells at 3 dpi (S3; left) and 6 dpi (S6; right) compared to mock (M). (C) Venn diagram of differently expressed genes (DEGs) at S3 and S6. (D and E) Top 10 gene ontology (GO) enrichment terms for (D) S3 and (E) S6 DEGs. (F and G) Heatmaps showing GO enrichment terms for S3 and S6 significantly changed in both (F) S3 and (G) S6.
FIG 4
FIG 4
Proinflammatory activation and M1 polarization of HMC3 by SARS-CoV-2 infection. (A and B) Heat maps of significantly upregulated genes during SARS-CoV-2 infection enriched in (A) immune response and (B) microglial M1 polarization. (C) The graphs show the measurements of secreted proinflammatory cytokines, including IL-1β, IL-6, and TNF-α, and anti-inflammatory cytokine IL-10 by enzyme-linked immunosorbent assay (ELISA). (D) Confocal immunofluorescence images of mock or SARS-CoV-2-infected HMC3 with anti-CD68 antibody. (E) Quantitative analysis of microglial activation markers, including CD68, CX3CL1, and CX3CR1 using Western blotting. Actin served as the loading control. (F) RT-qPCR analysis of the representative M1 (NOS2; left) and M2 markers (Arginase-1; right). (G) Assessment of proteins of M1 markers, including CD16, phopho-Stat1, and Stat1 by Western blotting. Actin served as the loading control. Statistically significant differences between the groups were determined using ANOVA; *, P < 0.05; **, P < 0.01; ****, P < 0.0001. Symbols represent mean ± SEM.
FIG 5
FIG 5
Intrinsic and death receptor (DR)-mediated extrinsic apoptosis in SARS-CoV-2-infected HMC3. (A) A heat map of significantly upregulated and downregulated genes during SARS-CoV-2 infection enriched in the apoptotic process. (B to D) Extrinsic apoptosis-related proteins, including Fas, Death receptors (DRs), and tumor necrosis factor receptor 2 (TNFR2) (B); intrinsic apoptosis-associated proteins, such as Bcl-2, Bim, Bid, and Bax (C); and caspases and poly (ADP-ribose) polymerase (PARP) (D), which are downstream of both intrinsic and extrinsic apoptosis, were quantitatively analyzed using Western blotting. Actin served as the loading control. (E) At 3 d postinfection (dpi), the cell surface of the mock or SARS-CoV-2-infected HMC3 was bound with recombinant human Annexin V to detect cells that are in progress of apoptosis by flow cytometry analysis. The histogram peaks indicate mock (gray) and infected (red) cells (left). The percentage of Annexin V positive cells is shown in the bar graph (right). (F) The infected HMC3 cells were treated with Z-DEVD-FMK (caspase-3 inhibitor), Z-IETD-FMK (Caspase-8 inhibitor), and Z-VAD-FMK (pan-caspase inhibitor) for 6 days at the indicated concentrations. The surviving cells were stained with crystal violet and then the percent measurements of the stained cell covered areas were obtained using an ImmunoSpot reader. Statistically significant differences between the groups were determined by Student's t test (E) or one-way ANOVA (F); ****, P < 0.0001. Symbols represent means ± SEM.
FIG 6
FIG 6
Pyroptosis might not be promoted by SARS-CoV-2 infection in HMC3. (A) After SARS-CoV-2 infection in HMC3, NLRP3, GSDMD, and caspase-1 proteins were analyzed by Western blotting. Hsp70 served as a loading control. (B) The SARS-CoV-2-infected HMC3 cells were treated with caspase-1 inhibitors (Ac-FLTD-CMK and Belnacasan) for 6 days at the indicated concentrations. The surviving cells were stained with crystal violet, and then the percent measurements of the stained cell covered areas were determined by the ImmunoSpot reader. Statistically significant differences between the groups were determined by one-way ANOVA; ****, P < 0.0001. Symbols represent means ± SEM.
FIG 7
FIG 7
Microglia of K18-hACE2 mice were infected by intranasally administered SARS-CoV-2. (A) The SARS-CoV-2 inoculum (50 μL, 100 MLD50) was intranasally administered to a susceptible mouse model (K18-hACE2, n = 4). Their body weight was measured every day (Mock: black; Infected: blue). (B) At 6 d postinfection (dpi), the brain homogenates of the mock or infected mice were used to detect the viral RNA by quantitative real-time PCR (RT-qPCR), and the graph indicates viral RNA copies per microgram of total RNA. (C) The colocalization of SARS-Cov-2 spike protein and microglial Iba1 at 6 dpi in the infected mice by immunofluorescence staining. Scale bars = 50 μm. Statistically significant differences between the groups were determined by multiple Student's t test (A) and Student's t test (B); *, P < 0.05; **, P < 0.01; ***, P < 0.001; ****, P < 0.0001. Symbols represent mean ± SEM.
FIG 8
FIG 8
Microglial proinflammatory activation and depopulation by SARS-CoV-2 infection in K18-hACE2 mice. (A) Schematic of the experiment for B to H, created with BioRender.com. After 6 days, brains of mock or SARS-CoV-2-infected mice were extracted and used for Percoll gradient centrifugation to isolate mononuclear cells containing microglia for the flow cytometry analysis. The cellular surface of isolated mononuclear cells was stained with CD11b and CD45 antibodies. (B) Representative flow plot gated on leukocytes shows gating for microglia (MI, CD11b+, CD45low), macrophages (Mϕ, CD11b+, CD45high), and lymphocytes (Lym, CD11b, CD45high). (C to E) Bar graphs show the number of microglia (C), lymphocytes (D), and macrophages (E) isolated per brain at 6 dpi. (F) Representative flow plot gated on microglia shows activated microglia with highly expressed IL-6 and TNF-α to separate activated from ramified microglia. (G and H) Bar graphs indicate the percentage of activated microglia, highly expressing IL-6 (G) and TNF-α (H). Statistically significant differences between the groups were determined using Student's t test; *, P < 0.05; ***, P < 0.001; ****, P < 0.0001. Symbols represent the mean ± standard error of the mean (SEM).

Similar articles

Cited by

References

    1. V'kovski P, Kratzel A, Steiner S, Stalder H, Thiel V. 2021. Coronavirus biology and replication: implications for SARS-CoV-2. Nat Rev Microbiol 19:155–170. doi:10.1038/s41579-020-00468-6. - DOI - PMC - PubMed
    1. Hu B, Guo H, Zhou P, Shi Z-L. 2021. Characteristics of SARS-CoV-2 and COVID-19. Nat Rev Microbiol 19:141–154. doi:10.1038/s41579-020-00459-7. - DOI - PMC - PubMed
    1. Fotuhi M, Mian A, Meysami S, Raji CA. 2020. Neurobiology of COVID-19. Jad : 76:3–17. doi:10.3233/JAD-200581. - DOI - PMC - PubMed
    1. Varatharaj A, Thomas N, Ellul MA, Davies NWS, Pollak TA, Tenorio EL, Sultan M, Easton A, Breen G, Zandi M, Coles JP, Manji H, Al-Shahi Salman R, Menon DK, Nicholson TR, Benjamin LA, Carson A, Smith C, Turner MR, Solomon T, Kneen R, Pett SL, Galea I, Thomas RH, Michael BD, Allen C, Archibald N, Arkell J, Arthur-Farraj P, Baker M, Ball H, Bradley-Barker V, Brown Z, Bruno S, Carey L, Carswell C, Chakrabarti A, Choulerton J, Daher M, Davies R, Di Marco Barros R, Dima S, Dunley R, Dutta D, Ellis R, Everitt A, Fady J, Fearon P, Fisniku L, Gbinigie I, et al. . 2020. Neurological and neuropsychiatric complications of COVID-19 in 153 patients: a UK-wide surveillance study. Lancet Psychiatry 7:875–882. doi:10.1016/S2215-0366(20)30287-X. - DOI - PMC - PubMed
    1. Politi LS, Salsano E, Grimaldi M. 2020. Magnetic resonance imaging alteration of the brain in a patient with coronavirus disease 2019 (COVID-19) and anosmia. JAMA Neurol 77:1028–1029. doi:10.1001/jamaneurol.2020.2125. - DOI - PubMed

Publication types