

Unsuspected Clonal Spread of Methicillin-Resistant Staphylococcus aureus Causing Bloodstream Infections in Hospitalized Adults Detected Using Whole Genome Sequencing
- PMID: 35510945
- PMCID: PMC10200302
- DOI: 10.1093/cid/ciac339
Unsuspected Clonal Spread of Methicillin-Resistant Staphylococcus aureus Causing Bloodstream Infections in Hospitalized Adults Detected Using Whole Genome Sequencing
Abstract
Background: Though detection of transmission clusters of methicillin-resistant Staphylococcus aureus (MRSA) infections is a priority for infection control personnel in hospitals, the transmission dynamics of MRSA among hospitalized patients with bloodstream infections (BSIs) has not been thoroughly studied. Whole genome sequencing (WGS) of MRSA isolates for surveillance is valuable for detecting outbreaks in hospitals, but the bioinformatic approaches used are diverse and difficult to compare.
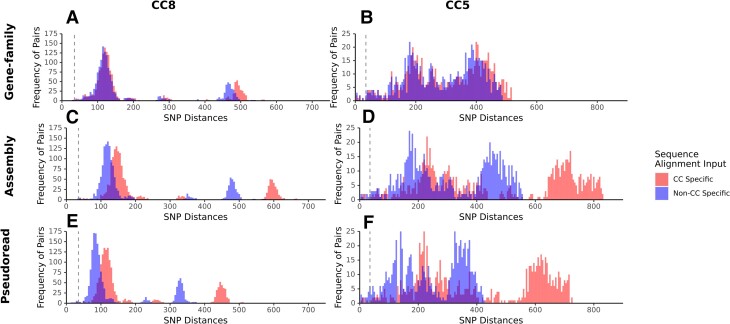
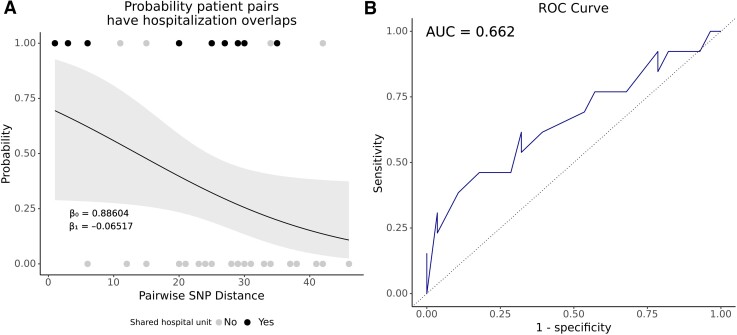
Methods: We combined short-read WGS with genotypic, phenotypic, and epidemiological characteristics of 106 MRSA BSI isolates collected for routine microbiological diagnosis from inpatients in 2 hospitals over 12 months. Clinical data and hospitalization history were abstracted from electronic medical records. We compared 3 genome sequence alignment strategies to assess similarity in cluster ascertainment. We conducted logistic regression to measure the probability of predicting prior hospital overlap between clustered patient isolates by the genetic distance of their isolates.
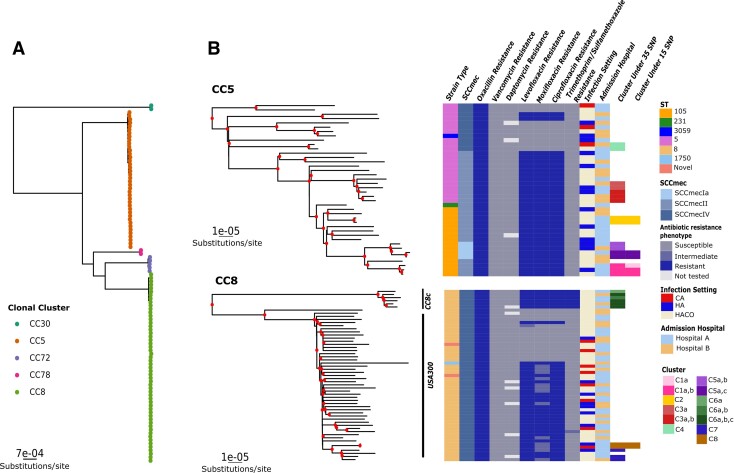
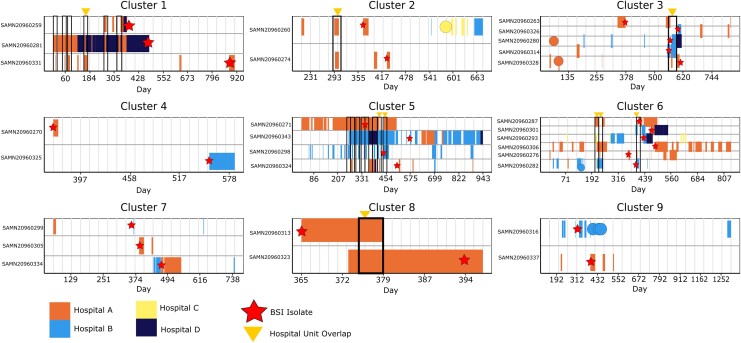
Results: While the 3 alignment approaches detected similar results, they showed some variation. A gene family-based alignment pipeline was most consistent across MRSA clonal complexes. We identified 9 unique clusters of closely related BSI isolates. Most BSIs were healthcare associated and community onset. Our logistic model showed that with 13 single-nucleotide polymorphisms, the likelihood that any 2 patients in a cluster had overlapped in a hospital was 50%.
Conclusions: Multiple clusters of closely related MRSA isolates can be identified using WGS among strains cultured from BSI in 2 hospitals. Genomic clustering of these infections suggests that transmission resulted from a mix of community spread and healthcare exposures long before BSI diagnosis.
Keywords: Staphylococcus aureus; bloodstream infections; hospital epidemiology; infection prevention; outbreak detection.
© The Author(s) 2022. Published by Oxford University Press on behalf of the Infectious Diseases Society of America. All rights reserved. For permissions, please e-mail: journals.permissions@oup.com.
Conflict of interest statement
Potential conflicts of interest. D. A. P. is an associate editor for Clinical Infectious Diseases. M. Z. D. reports grants unrelated to this work from Johnson & Johnson and ContraFect (clinical trial); consulting fees from GSK; support from GSK for travel and lodging costs for a lecture given at GSK in Siena, Italy, December 2019; and participation on advisory board for GSK. T. D. R. reports payment or honoraria as an NIH peer reviewer; unpaid position on the editorial board for the Journal of Clinical Microbiology; and position as editor of PeerJ. All other authors report no potential conflicts. All authors have submitted the ICMJE Form for Disclosure of Potential Conflicts of Interest. Conflicts that the editors consider relevant to the content of the manuscript have been disclosed.
Figures
Similar articles
-
Prospective genomic surveillance of methicillin-resistant Staphylococcus aureus (MRSA) associated with bloodstream infection, England, 1 October 2012 to 30 September 2013.Euro Surveill. 2019 Jan;24(4):1800215. doi: 10.2807/1560-7917.ES.2019.24.4.1800215. Euro Surveill. 2019. PMID: 30696529 Free PMC article.
-
Emergence of community-associated methicillin-resistant Staphylococcus aureus strains as a cause of healthcare-associated bloodstream infections in Korea.Infect Control Hosp Epidemiol. 2009 Feb;30(2):146-55. doi: 10.1086/593953. Infect Control Hosp Epidemiol. 2009. PMID: 19128184
-
Investigation of a Cluster of Sequence Type 22 Methicillin-Resistant Staphylococcus aureus Transmission in a Community Setting.Clin Infect Dis. 2017 Nov 29;65(12):2069-2077. doi: 10.1093/cid/cix539. Clin Infect Dis. 2017. PMID: 29077854 Free PMC article.
-
Whole-genome sequencing analysis of molecular epidemiology and silent transmissions causing meticillin-resistant Staphylococcus aureus bloodstream infections in a university hospital.J Hosp Infect. 2023 Sep;139:141-149. doi: 10.1016/j.jhin.2023.05.014. Epub 2023 Jun 8. J Hosp Infect. 2023. PMID: 37301229 Review.
-
Contribution of whole-genome sequencing to understanding of the epidemiology and control of meticillin-resistant Staphylococcus aureus.J Hosp Infect. 2019 Jun;102(2):189-199. doi: 10.1016/j.jhin.2019.01.025. Epub 2019 Feb 2. J Hosp Infect. 2019. PMID: 30721732 Review.
Cited by
-
Rapid whole genome characterization of antimicrobial-resistant pathogens using long-read sequencing to identify potential healthcare transmission.Infect Control Hosp Epidemiol. 2024 Dec 27;46(2):1-7. doi: 10.1017/ice.2024.202. Online ahead of print. Infect Control Hosp Epidemiol. 2024. PMID: 39727230 Free PMC article.
-
Genomic investigation of MRSA bacteremia relapse reveals diverse genomic profiles but convergence in bacteremia-associated genes.medRxiv [Preprint]. 2025 Mar 28:2025.03.24.25324140. doi: 10.1101/2025.03.24.25324140. medRxiv. 2025. Update in: J Infect Dis. 2025 Jul 25:jiaf352. doi: 10.1093/infdis/jiaf352. PMID: 40196254 Free PMC article. Updated. Preprint.
-
Demographic fluctuations in bloodstream Staphylococcus aureus lineages configure the mobile gene pool and antimicrobial resistance.NPJ Antimicrob Resist. 2024;2(1):14. doi: 10.1038/s44259-024-00032-9. Epub 2024 May 7. NPJ Antimicrob Resist. 2024. PMID: 38725655 Free PMC article.
-
Clinical presentation, treatment, and antimicrobial susceptibility of 155 sequential Staphylococcus lugdunensis infections.Microbiol Spectr. 2025 Apr;13(4):e0274924. doi: 10.1128/spectrum.02749-24. Epub 2025 Mar 10. Microbiol Spectr. 2025. PMID: 40062747 Free PMC article.
-
Comparison of genomic diversity between single and pooled Staphylococcus aureus colonies isolated from human colonization cultures.Microb Genom. 2023 Nov;9(11):001111. doi: 10.1099/mgen.0.001111. Microb Genom. 2023. PMID: 37934072 Free PMC article.
References
-
- Yang ES, Tan J, Eells S, Rieg G, Tagudar G, Miller LG. Body site colonization in patients with community-associated methicillin-resistant Staphylococcus aureus and other types of S. aureus skin infections. Clin Microbiol Infect 2010; 16:425–31. - PubMed
-
- Centers for Disease Control and Prevention . Methicillin-resistant Staphylococcus aureus infections among competitive sports participants—Colorado, Indiana, Pennsylvania, and Los Angeles County, 2000–2003. MMWR Morb Mortal Wkly Rep 2003; 52:793–5. - PubMed
Publication types
MeSH terms
Grants and funding
LinkOut - more resources
Full Text Sources
Medical
Molecular Biology Databases
