. 2022 May 1;29(Pt 3):908-915.
doi: 10.1107/S1600577522003551. Epub 2022 Apr 26.

The meV XUV-RIXS facility at UE112-PGM1 of BESSY II

Affiliations

The meV XUV-RIXS facility at UE112-PGM1 of BESSY II

Karl Bauer et al. J Synchrotron Radiat. .

Abstract

Resonant inelastic X-ray scattering in the XUV-regime has been implemented at BESSY II, pushing for a few-meV bandwidth in inelastic X-ray scattering at transition metal M-edges, rare earth N-edges and the K-edges of light elements up to carbon with full polarization control. The new dedicated low-energy beamline UE112-PGM1 has been designed to provide 1 µm vertical and 20 µm horizontal beam dimensions that serve together with sub-micrometre solid-state sample positioning as the source point for a high-resolution plane grating spectrometer and a high-transmission Rowland spectrometer for rapid overview spectra. The design and commissioning results of the beamline and high-resolution spectrometer are presented. Helium autoionization spectra demonstrate a resolving power of the beamline better than 10 000 at 64 eV with a 300 lines mm-1 grating while the measured resolving power of the spectrometer in the relevant energy range is 3000 to 6000.

Keywords: BESSY II; X-ray photoelectron spectroscopy; XUV; resonant inelastic X-ray scattering; soft X-ray spectroscopy.


Figures

Figure 1
Figure 1
Optical layout of the beamline UE112-PGM1 at BESSY II. Distances are design parameters and are given in millimetres.
Figure 2
Figure 2
Photon flux of the beamline for horizontally polarized light and the first, third and fifth harmonics of the undulator with the 300 lines mm−1 grating at c ff = 2.25 and open front-end apertures. The dashed lines indicate the flux measured at an exit slit of 10 µm. Note that, for energies below 50 eV, the photon flux has an increasing contribution of higher harmonics which can be suppressed with an Al or Mg foil.
Figure 3
Figure 3
(a) Vertical beam profile at the sample position. Shown is the differentiated data from knife-edge scans. The positive (right-hand) side is the low signal (low noise) part of the scan. (b) Vertical beam size (FWHM) along the beam measured with knife-edge scans (dots) and simulated using RAY-UI (line).
Figure 4
Figure 4
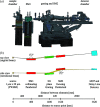
(a) Sketch of the sample chamber and meV-RIXS spectrometer. (b) Optical layout of the meV-RIXS spectrometer. Distances are design parameters and are given in millimetres.
Figure 5
Figure 5
Simulated energy ranges of the spectrometer at 100 eV using the 1050 lines mm−1 grating for three angles at different c S values. The smaller bar in the middle of each range indicates the range where the energy resolution dE is within a factor of 2 of its lowest value.
Figure 6
Figure 6
Measured combined resolving power of the beamline and spectrometer at c S = 0.05 and a detector angle of 4°. The spectrometer pass energy has been adjusted for each data point and the energy calibrations were performed using the elastic peak from NiO.
Figure 7
Figure 7
Scaling of the transmission and energy resolution as a function of c S value. The FWHM of the elastic line from Au at 100 eV and the sum of the count rates over this peak were used to determine these values. The detector angle was 15°.
Figure 8
Figure 8
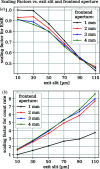
Scaling of the transmission and energy resolution as a function of the front-end aperture and exit slit sizes. The front-end aperture size given here is the vertical and horizontal width of the gap. The FWHM of the elastic line from hBN at 192 eV and the sum of the count rates over this peak were used to determine these values. The c S value was 0.3 and the detector angle was 4°.
Figure 9
Figure 9
Spectra of SrLaAlO4 using the low-resolution Rowland-type spectrometer XES350 and meV-RIXS at a c S value of 2 and a detector angle of 15°. The incidence energy was 101.8 eV. The energy ranges of the meV-RIXS and XES350 are 8.75 eV and 23 eV, respectively. The spectra have been normalized to the 3 D 1 3 D 2 peak.

References

    1. Ament, L. J. P., van Veenendaal, M., Devereaux, T. P., Hill, J. P. & van den Brink, J. (2011). Rev. Mod. Phys. 83, 705–767.
    1. Bahrdt, J., Follath, R., Frentrup, W., Gaupp, A., Scheer, M., Garrett, R., Gentle, I., Nugent, K. & Wilkins, S. (2010). AIP Conf. Proc. 1234, 335–338.
    1. Baumgärtel, P., Grundmann, P., Zeschke, T., Erko, A., Viefhaus, J., Schäfers, F. & Schirmacher, H. (2019). AIP Conf. Proc. 2054, 060034.
    1. Baumgärtel, P., Witt, M., Baensch, J., Fabarius, M., Erko, A., Schäfers, F. & Schirmacher, H. (2016). AIP Conf. Proc. 1741, 040016.
    1. Chiuzbăian, S. G., Schmitt, T., Matsubara, M., Kotani, A., Ghiringhelli, G., Dallera, C., Tagliaferri, A., Braicovich, L., Scagnoli, V., Brookes, N. B., Staub, U. & Patthey, L. (2008). Phys. Rev. B, 78, 245102.