Racial and Ethnic Differences in Hysterectomy-Corrected Uterine Corpus Cancer Mortality by Stage and Histologic Subtype
- PMID: 35511145
- PMCID: PMC9073658
- DOI: 10.1001/jamaoncol.2022.0009
Racial and Ethnic Differences in Hysterectomy-Corrected Uterine Corpus Cancer Mortality by Stage and Histologic Subtype
Abstract
Importance: Uterine cancer incidence has been increasing, particularly rates of aggressive, nonendometrioid subtypes, which are disproportionately higher among non-Hispanic Black women. The association of subtype-specific trends with uterine cancer mortality and with the role of tumor subtype and stage at diagnosis with racial disparities in uterine cancer deaths at the population-based level are not known.
Objective: To estimate histologic subtype- and stage-specific uterine cancer mortality rates by race and ethnicity, corrected for hysterectomy.
Design, setting, and participants: This cohort study used the US Surveillance, Epidemiology, and End Results-18 Incidence-Based Mortality database, representing approximately 26% of the US population and including deaths that occurred from 2000 to 2017. Hysterectomy correction was based on hysterectomy prevalence data from the Behavioral Risk Factor Surveillance System. Uncorrected and corrected rates associated with uterine corpus cancer cases diagnosed between 2000 and 2017 and uterine corpus cancer deaths occurring between 2010 and 2017 were age-adjusted to the 2000 US standard population and are expressed per 100 000 person-years, and annual percent changes in rates were calculated using log-linear regression. Data analysis was performed from March 10 to May 20, 2021.
Exposures: Tumor histologic subtype, cancer stage at diagnosis, and race and ethnicity.
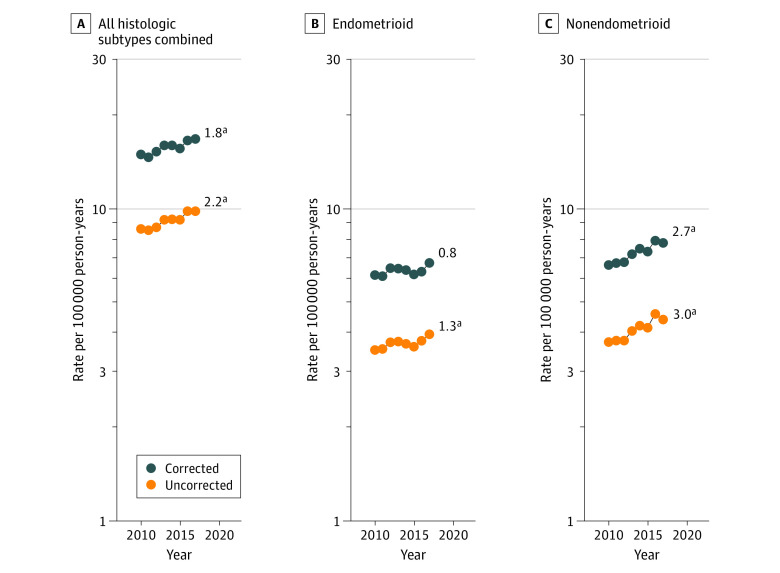
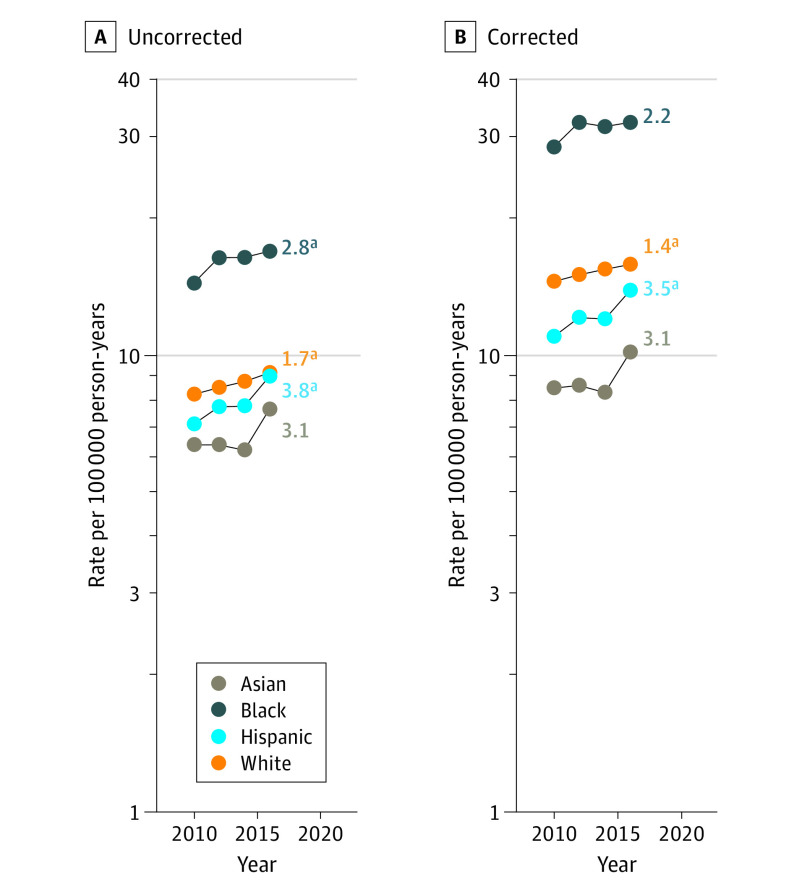
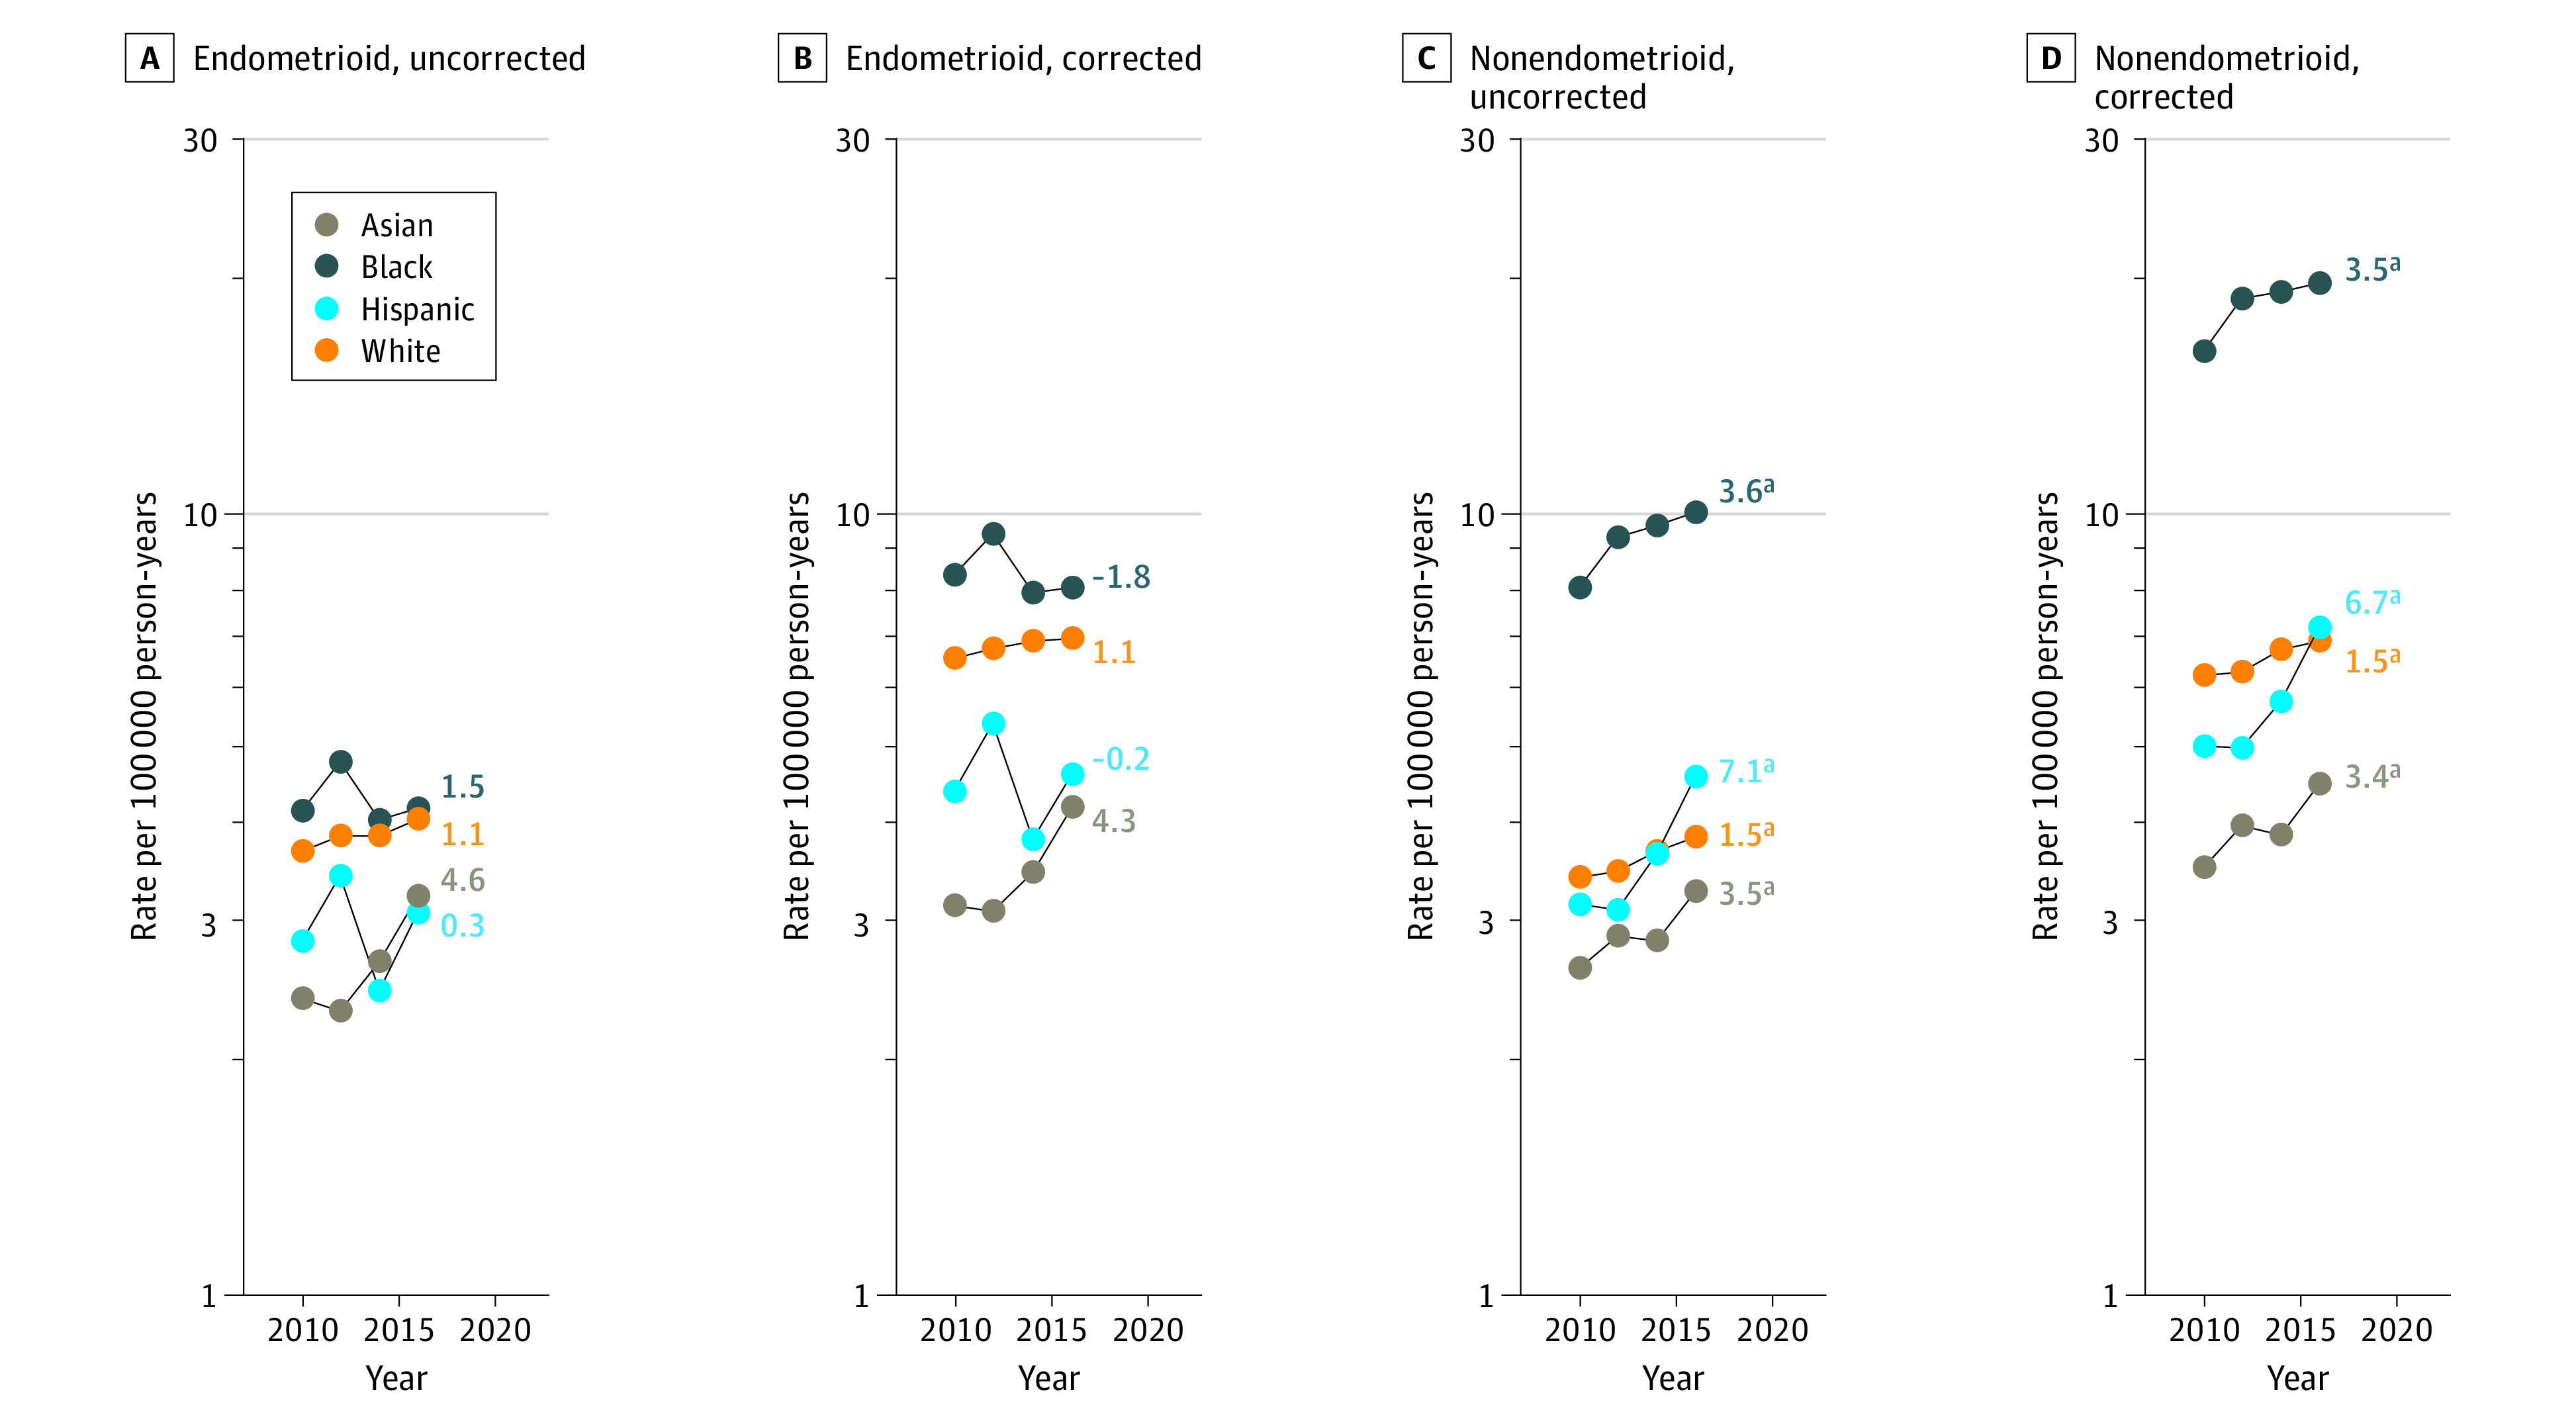
Results: Among 208 587 women diagnosed with uterine cancer during 2000-2017 (15 983 [7.7%] were Asian; 20 302 [9.7%] Black; 23 096 [11.1%] Hispanic; and 149 206 [71.5%] White individuals), there were 16 797 uterine cancer deaths between 2010 and 2017, corresponding to a hysterectomy-corrected mortality rate of 15.7 per 100 000 person-years. Hysterectomy-corrected rates were highest among Black women, overall, by histologic subtype and stage at diagnosis. Among all women, uterine corpus cancer mortality rates increased significantly by 1.8% (95% CI, 1.5%-2.9%) per year from 2010 to 2017, as did rates of nonendometrioid carcinomas (2.7%; 95% CI, 1.8%-3.6%), with increases occurring in Asian (3.4%; 95% CI, 0.3%-6.6%), Black (3.5%; 95% CI, 2.2%-4.9%), Hispanic (6.7%; 95% CI, 1.9%-11.8%), and White women (1.5%; 95% CI, 0.6%-2.4%). In contrast, endometrioid carcinoma mortality rates remained stable.
Conclusions and relevance: The findings of this cohort study suggest a significant increase of nonendometrioid uterine carcinoma mortality rates, aligning with recent incidence trends. The factors associated with these trends are not well understood and require more investigation of possible mechanisms. Despite stable incidence rates, endometrioid cancer mortality rates have not decreased over the past decade at the population level, suggesting limited progress in treatment for these cancers. The substantial disparities in uterine corpus cancer mortality rates among non-Hispanic Black women cannot be fully explained by subtype distribution and stage at diagnosis.
Conflict of interest statement
Figures
References
-
- Clarke MA, Devesa SS, Harvey SV, Wentzensen N. Hysterectomy-corrected uterine corpus cancer incidence trends and differences in relative survival reveal racial disparities and rising rates of nonendometrioid cancers. J Clin Oncol. 2019;37(22):1895-1908. doi: 10.1200/JCO.19.00151 - DOI - PMC - PubMed
Publication types
MeSH terms
Grants and funding
LinkOut - more resources
Full Text Sources
Medical
Miscellaneous