. 2022 Jul 6;12(7):jkac111.
doi: 10.1093/g3journal/jkac111.

Demographic history differences between Hispanics and Brazilians imprint haplotype features

Affiliations

Demographic history differences between Hispanics and Brazilians imprint haplotype features

Pedro Rodrigues Sousa da Cruz et al. G3 (Bethesda). .

Abstract

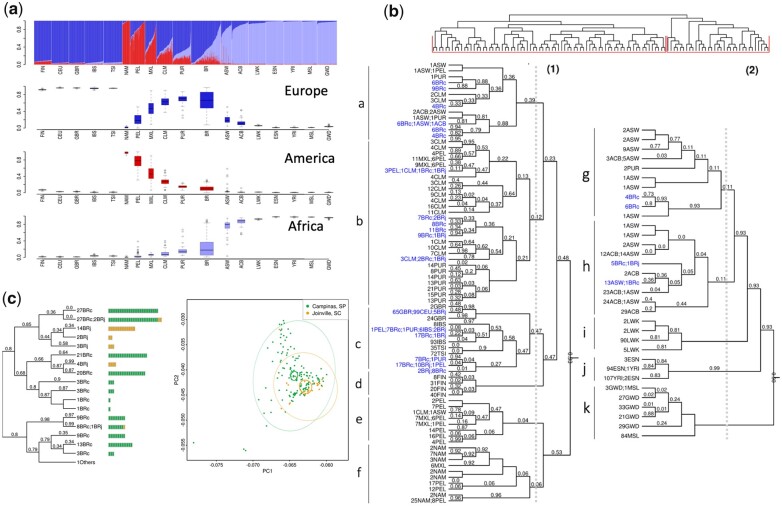
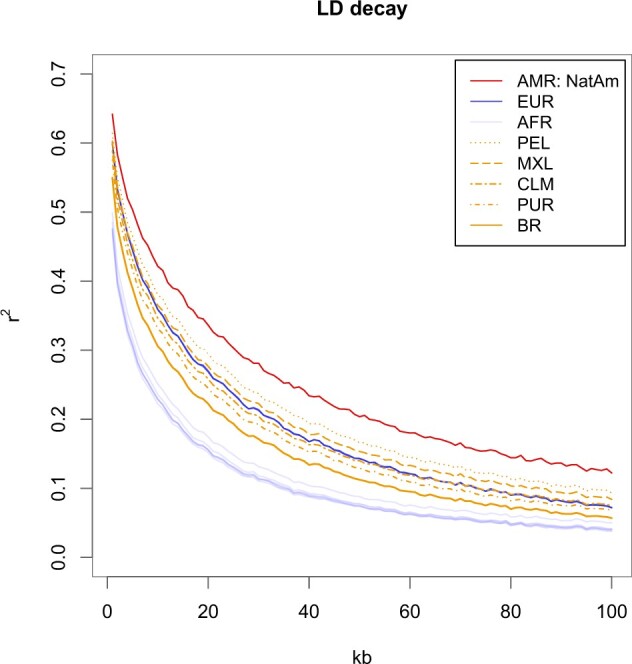
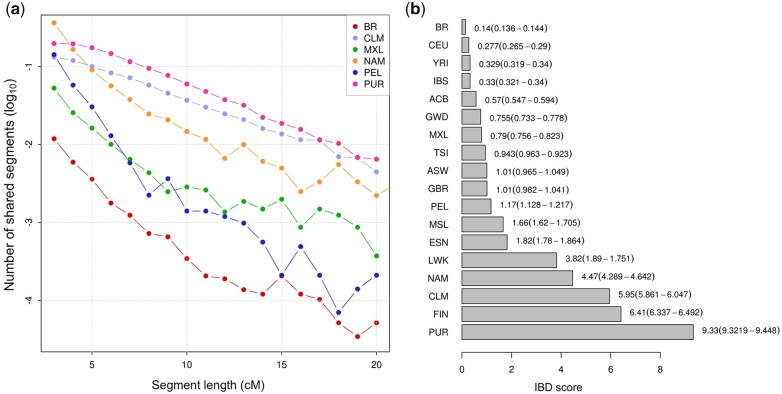
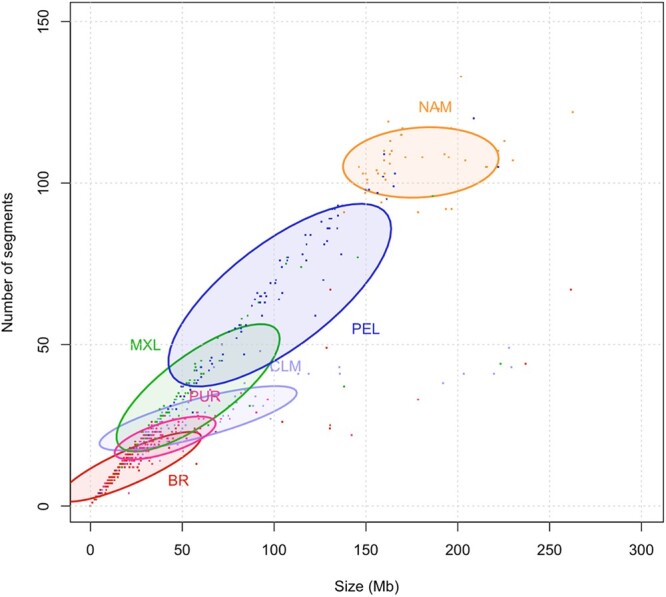
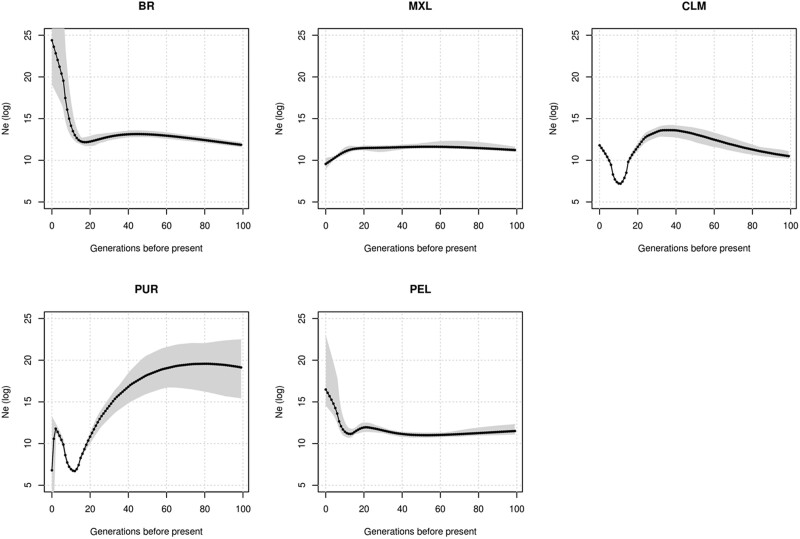
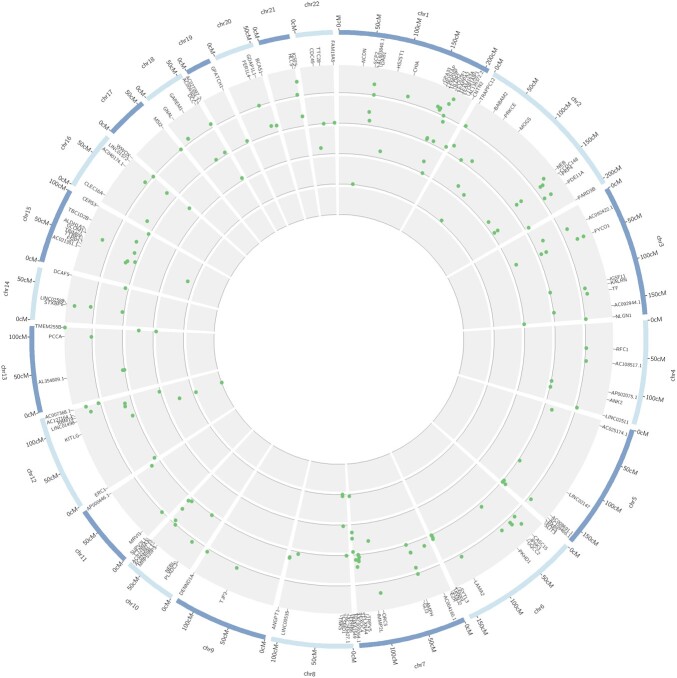
Admixture is known to greatly impact the genetic landscape of a population and, while genetic variation underlying human phenotypes has been shown to differ among populations, studies on admixed subjects are still scarce. Latin American populations are the result of complex demographic history, such as 2 or 3-way admixing events, bottlenecks and/or expansions, and adaptive events unique to the American continent. To explore the impact of these events on the genetic structure of Latino populations, we evaluated the following haplotype features: linkage disequilibrium, shared identity by descent segments, runs of homozygosity, and extended haplotype homozygosity (integrated haplotype score) in Latinos represented in the 1000 Genome Project along with array data from 171 Brazilians sampled in the South and Southeast regions of Brazil. We found that linkage disequilibrium decay relates to the amount of American and African ancestry. The extent of identity by descent sharing positively correlates with historical effective population sizes, which we found to be steady or growing, except for Puerto Ricans and Colombians. Long runs of homozygosity, a particular instance of autozygosity, was only enriched in Peruvians and Native Americans. We used simulations to account for random sampling and linkage disequilibrium to filter positive selection indexes and found 244 unique markers under selection, 26 of which are common to 2 or more populations. Some markers exhibiting positive selection signals had estimated time to the most recent common ancestor consistent with human adaptation to the American continent. In conclusion, Latino populations present highly divergent haplotype characteristics that impact genetic architecture and underlie complex phenotypes.

Keywords: IBD sharing; Latinos; ROH; diversity; haplotypes; linkage disequilibrium; population; selection.


Figures

Fig. 1.
Fig. 1.
Admixture in Latino populations. a) ADMIXTURE analysis. Top panel: K = 3. Individuals are represented by vertical bars, the colors represent the estimated proportion of each cluster amounts to. Boxplots: genomic membership to each cluster: top: European ancestry; middle: Native American ancestry; and bottom: African ancestry. b) FineStructure tree of relationship across samples in the complete dataset. Posterior probability values below 1 are shown as branch labels. Dotted gray lines represent the cuts on the tree used to generate groups of distal clusters (a–k, see text). Edge labels show population membership and the number of individuals in each leaf. The dataset splits into 2 major clusters, according to non-African (1) and African (2) genomic predominance. Brazilians and Puerto Ricans are represented in both major clusters. Brazilians (in blue), however, are also more dispersed in distal clusters when compared to any other Latino Population, being the most dispersed admixed population, followed by ASW. BRc: samples from Campinas; BRj: samples from Joinville. c) Substructure in the Brazilian population. Left panel: FineStructure tree of relationship for Brazilian samples. Each colored bar corresponds to an individual, colors represent sample collection sites: green—Campinas (São Paulo State) and orange—Joinville (Santa Catarina State). Brazilian samples were subdivided into 18 leaves. Other populations were averaged and shown as super-individual (“1Others”). Right panel: PCA for PC1 and. PC2 on Brazilians. Inner ellipses are the 95% confidence ellipses for the barycenters of the groups. Outer ellipses are the 95% confidence ellipses for the groups.
Fig. 2.
Fig. 2.
LD-decay plot. LD (r2) was estimated with PLINK software and plotted by population as a function of physical distance in kb. Latino populations are represented in yellow, the Native American population is represented in red, South European populations are represented in blue, and African populations are represented in purple. North-Europeans were not plotted to allow Latino populations to be better visualized.
Fig. 3.
Fig. 3.
IBD sharing in Latinos and IBD scores for the whole dataset. a) Log10 of the number of pairwise IBD segments shared within each Latin American and Native American population by segment length, ranging from 2 to 20 cM. The values were normalized by the total number of pairwise comparisons. Segment lengths were approximated to the nearest integer number. b) IBD scores for all populations considered in the present study. Scores were calculated by computing the total length of all IBD segments between 3 and 20 cM and normalizing values by sample sizes. A total of 95% confidence intervals are depicted under parenthesis.
Fig. 4.
Fig. 4.
ROH in American populations. The number and the length sum of all ROH segments (Mb) per individual. Ellipses correspond to 50% confidence intervals for each population.
Fig. 5.
Fig. 5.
Effective population sizes (Ne) in Latinos. IBDNe software was used to infer effective population size over the last 3,000 years. A total of 50% confidence intervals are represented as shaded regions. CLM and PUR show severe bottlenecks approximately 500 years ago and do not recover from these events. PUR effective size also shows a recent variation toward lower effective size, although estimates nearer the present tend to be inaccurate.
Fig. 6.
Fig. 6.
Circular plot of extended haplotype scores (iHS) in Latino populations. Internal to the human karyogram (blue) are the standardized iHS values represented by scatterplots. From the inner to outer circles: Brazilian, Puerto Rican, Colombian, Peruvian, and Mexican populations. Only genic iHS values surpassing the simulation thresholds for each population are displayed (see Supplementary Table 3 for detailed information on the markers).

References

    1. 1000 Genomes Project Consortium; Abecasis GR, Altshuler D, Auton A, Brooks LD, Durbin RM, Gibbs RA, Hurles ME, McVean GA, A map of human genome variation from population-scale sequencing. Nature. 2010;467(7319):1061–1073. - PMC - PubMed
    1. 1000 Genomes Project Consortium; Auton A, Brooks LD, Durbin RM, Garrison EP, Kang HM, Korbel JO, Marchini JL, McCarthy S, McVean GA, Abecasis GR, et al.A global reference for human genetic variation. Nature. 2015;526(7571):68–74. - PMC - PubMed
    1. Adhikari K, Chacón-Duque JC, Mendoza-Revilla J, Fuentes-Guajardo M, Ruiz-Linares A.. The genetic diversity of the Americas. Annu Rev Genomics Hum Genet. 2017;18:277–296. - PubMed
    1. Affymetrix. BRLMM: an improved genotype calling method for the GeneChip® human mapping 500K array set [White paper]. 2006:1–18. http://tools.thermofisher.com/content/sfs/brochures/brlmm_whitepaper.pdf
    1. Akey JM, Eberle MA, Rieder MJ, Carlson CS, Shriver MD, Nickerson DA, Kruglyak L.. Population history and natural selection shape patterns of genetic variation in 132 genes. PLoS Biol. 2004;2(10):e286. - PMC - PubMed

Publication types

LinkOut - more resources