Meta-Analysis
. 2022 Aug 8;114(8):1159-1166.
doi: 10.1093/jnci/djac087.

Genetic Analysis of Lung Cancer and the Germline Impact on Somatic Mutation Burden

Affiliations
Meta-Analysis

Genetic Analysis of Lung Cancer and the Germline Impact on Somatic Mutation Burden

Aurélie A G Gabriel et al. J Natl Cancer Inst. .

Abstract

Background: Germline genetic variation contributes to lung cancer (LC) susceptibility. Previous genome-wide association studies (GWAS) have implicated susceptibility loci involved in smoking behaviors and DNA repair genes, but further work is required to identify susceptibility variants.

Methods: To identify LC susceptibility loci, a family history-based genome-wide association by proxy (GWAx) of LC (48 843 European proxy LC patients, 195 387 controls) was combined with a previous LC GWAS (29 266 patients, 56 450 controls) by meta-analysis. Colocalization was used to explore candidate genes and overlap with existing traits at discovered susceptibility loci. Polygenic risk scores (PRS) were tested within an independent validation cohort (1 666 LC patients vs 6 664 controls) using variants selected from the LC susceptibility loci and a novel selection approach using published GWAS summary statistics. Finally, the effects of the LC PRS on somatic mutational burden were explored in patients whose tumor resections have been profiled by exome (n = 685) and genome sequencing (n = 61). Statistical tests were 2-sided.

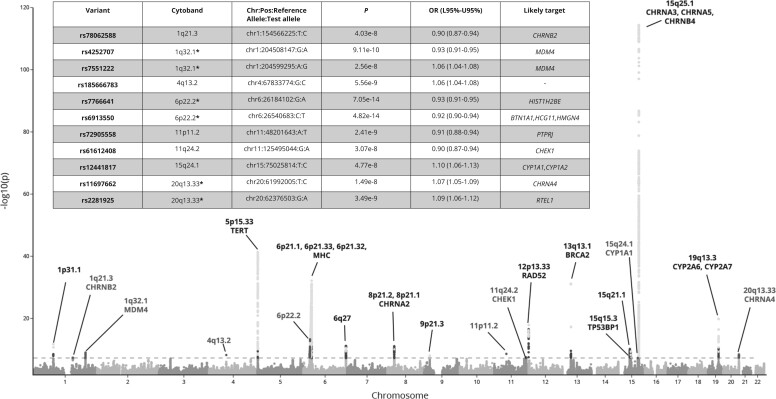
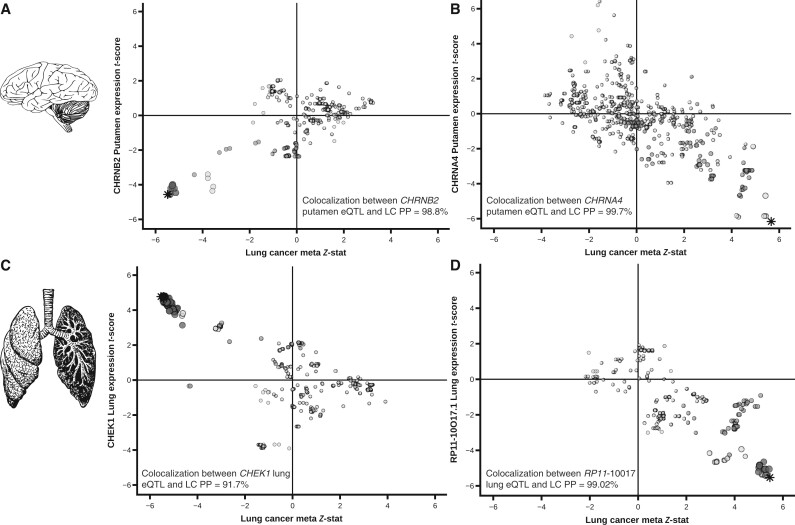
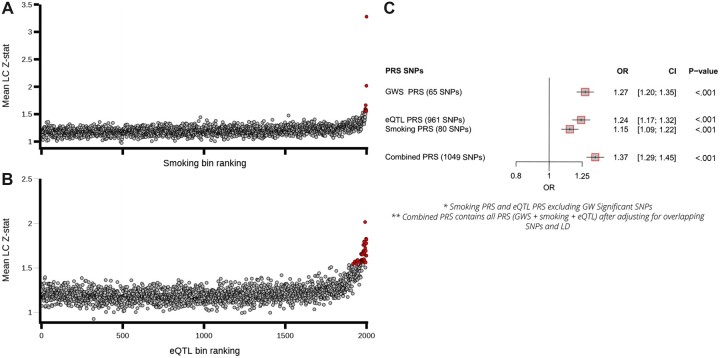
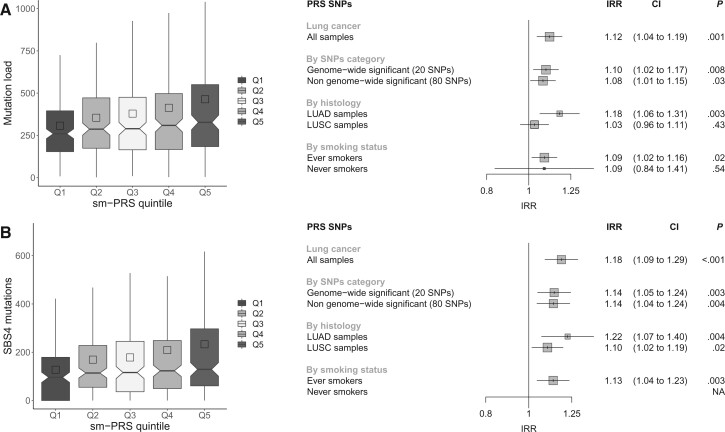
Results: The GWAx-GWAS meta-analysis identified 8 novel LC loci. Colocalization implicated DNA repair genes (CHEK1), metabolic genes (CYP1A1), and smoking propensity genes (CHRNA4 and CHRNB2). PRS analysis demonstrated that these variants, as well as subgenome-wide significant variants related to expression quantitative trait loci and/or smoking propensity, assisted in LC genetic risk prediction (odds ratio = 1.37, 95% confidence interval = 1.29 to 1.45; P < .001). Patients with higher genetic PRS loads of smoking-related variants tended to have higher mutation burdens in their lung tumors.

Conclusions: This study has expanded the number of LC susceptibility loci and provided insights into the molecular mechanisms by which these susceptibility variants contribute to LC development.


Figures

Figure 1.
Figure 1.
Manhattan plot of the meta-analysis of the genome-wide by proxy (GWAx) with genome-wide association study (GWAS) into lung cancer. The Manhattan plot displays the results of the meta-analysis of the GWAx (48 843 proxy patients and 195 387 controls without a family history of any cancer) and the Transdisciplinary Research In Cancer of the Lung GWAS (29 266 patients and 56 450 controls) with already identified and novel loci noted with the likely candidate gene name presented. The table represents the newly 11 independent loci across 8 distinct cytoband regions (sites with 2 independent hits are denoted by * within the cytoband column). The x-axis is the chromosome position across the autosomal chromosomes, and the y-axis contains the association level displayed as the -log10(P value), derived by a multivariate logistic regression model. The dotted line displays the genome-wide significance threshold (5 x 10⁻⁸). L95% = lower bound confidence interval; OR = odds ratio; U95% = upper bound confidence interval.
Figure 2.
Figure 2.
Brain and lung eQTLs discovered within the 8 novel loci. Colocalization plots between lung cancer (x-axis) and CHRNB2 putamen expression (1q21.3) A)CHRNA4 putamen expression (20q13.33); (B)CHEK1 lung expression (11q24.2); (C)RP11-10O17.1 lung gene expression (15q24); (D) (y-axis). Each variant and eQTL status were compared using COLOC for colocalization to confirm that the lung cancer SNP was the same SNP driving the eQTL effect in both brain and lung tissues, the Bayesian posterior probability (PP4) of each gene was tested. Stars indicate the variant of interest and shading scaled representing the level of LD shared between other markers with sentinel variant (r2 > 0.8; r2 > 0.4; r2 > 0.1). eQTL = expression quantitative trait loci; LC = lung cancer; LD = linkage disequilibrium; SNP = single nucleotide polymorphism.
Figure 3.
Figure 3.
Germline polygenic risk score construction using smoking and eQTL related SNPs and performance testing within the UK Biobank lung cancer cohort. A) The mean lung cancer association statistics calculated by variant bins (100 variants per bin) ranked by partial least squares (PLS) components. Variants (clumped on LD based on lung cancer P values) were ranked based on PLS components for smoking propensity (Component1_smoking, top) and eQTLs (Component1_eQTL, [B]) (x-axis) and plotted against the mean lung cancer Z statistics calculated across variants in each bin (y-axis). Bin values that exceed 3 SDs from the mean are noted, with the excess observed (number of bins smoking propensity = 9, number of bins eQTL = 37) implying that the variants within these bins are enriched for LC-susceptibility alleles. C) A forest plot of the performance of the constructed PRSs in comparison to the PRS based on the 65 GWS independent loci as a baseline which included array type, sex, age of recruitment and the first 5 principal components from genetic-inferred ancestry). CI = confidence interval; eQTL = expression quantitative trait loci; LC = lung cancer; LD = linkage disequilibrium; GWS = genome-wide significant; OR = odds ratio; PRS = polygenic risk scores; SNP = single nucleotide polymorphism.
Figure 4.
Figure 4.
Polygenic risk scores for smoking (smPRS) associations with total number of mutations and mutations attributable to SBS4 in TCGA cohort. A) Associations with total number of mutations. B) Associations with SBS4 mutations. The left panels represent the distribution of the number of mutations in the smPRS quintiles. The right panels correspond, respectively, to the forest plots of smPRS associations with total mutational burden (panel A) and SBS4 mutations (panel B). For each PRS, the association was tested 1) in all lung cancer patients when considering all SNPs in the smPRS SNPs selection, 2) in all lung cancer patients when considering different subsets of SNPs in the PRS computation, 3) stratifying by histology, and 4) stratifying by smoking status. CI = confidence interval; IRR = incidence rate ratios; LUAD = Lung adenocarcinoma; LUSC = Lung Squamous Cell Carcinoma; NA = Not available; Q = quintile; TCGA = The Cancer Genome Atlas; SNP = single nucleotide polymorphism.

References

    1. Tokuhata GK, Lilienfeld AM.. Familial aggregation of lung cancer in humans. J Natl Cancer Inst. 1963;30(2):289-312. - PubMed
    1. Schwartz AG, Yang P, Swanson GM.. Familial risk of lung cancer among nonsmokers and their relatives. Am J Epidemiol. 1996;144(6):554-562. doi:10.1093/oxfordjournals.aje.a008965 - DOI - PubMed
    1. Ooi WL, Elston RC, Chen VW, Bailey-Wilson JE, Rothschild H.. Increased familial risk for lung cancer. J Natl Cancer Inst. 1986;76(2):217-222. doi:10.1093/jnci/76.2.217. - DOI - PubMed
    1. Sellers TA, Bailey-Wilson JE, Elston RC, et al.Evidence for mendelian inheritance in the pathogenesis of lung cancer. J Natl Cancer Inst. 1990;82(15):1272-1279. doi:10.1093/jnci/82.15.1272. - DOI - PubMed
    1. Mucci LA, Hjelmborg JB, Harris JR, et al.Familial risk and heritability of cancer among twins in Nordic countries. JAMA. 2016;315(1):68-76. doi:10.1001/jama.2015.17703. - DOI - PMC - PubMed

Publication types