. 2023 Feb 7;33(4):1504-1526.
doi: 10.1093/cercor/bhac153.

Organization and engagement of a prefrontal-olfactory network during olfactory selective attention

Affiliations

Organization and engagement of a prefrontal-olfactory network during olfactory selective attention

Hillary L Cansler et al. Cereb Cortex. .

Abstract

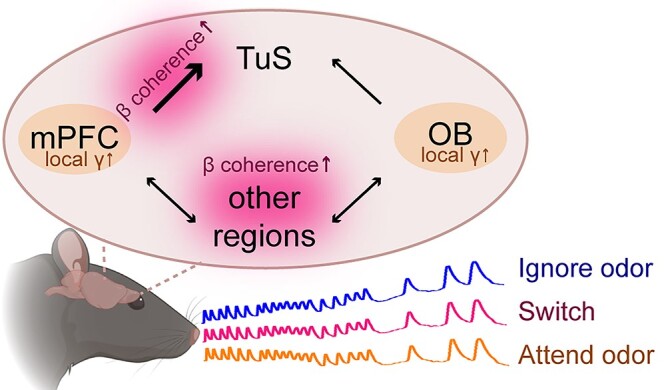
Background: Sensory perception is profoundly shaped by attention. Attending to an odor strongly regulates if and how it is perceived - yet the brain systems involved in this process are unknown. Here we report integration of the medial prefrontal cortex (mPFC), a collection of brain regions integral to attention, with the olfactory system in the context of selective attention to odors.

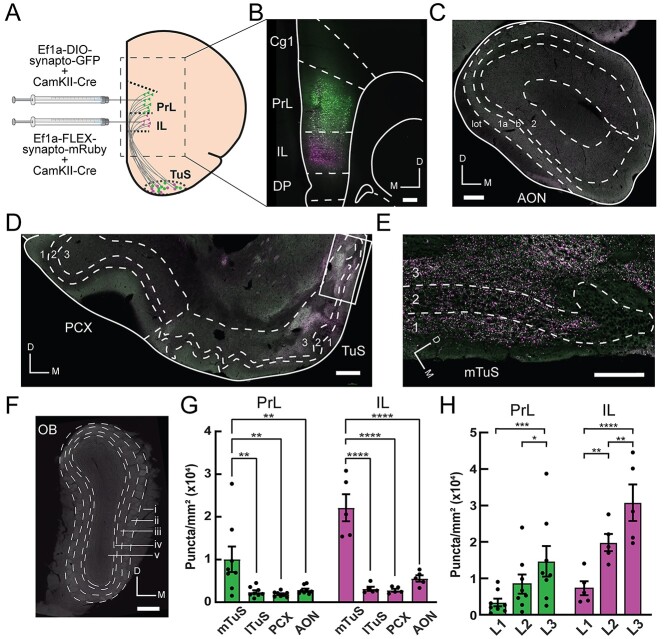
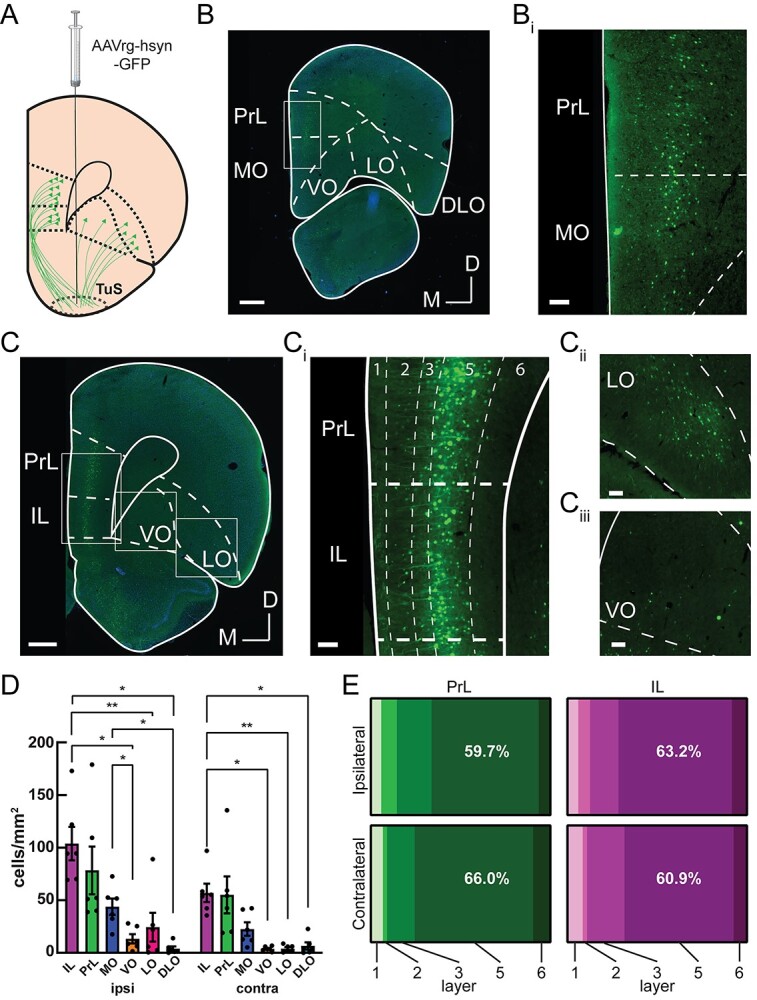
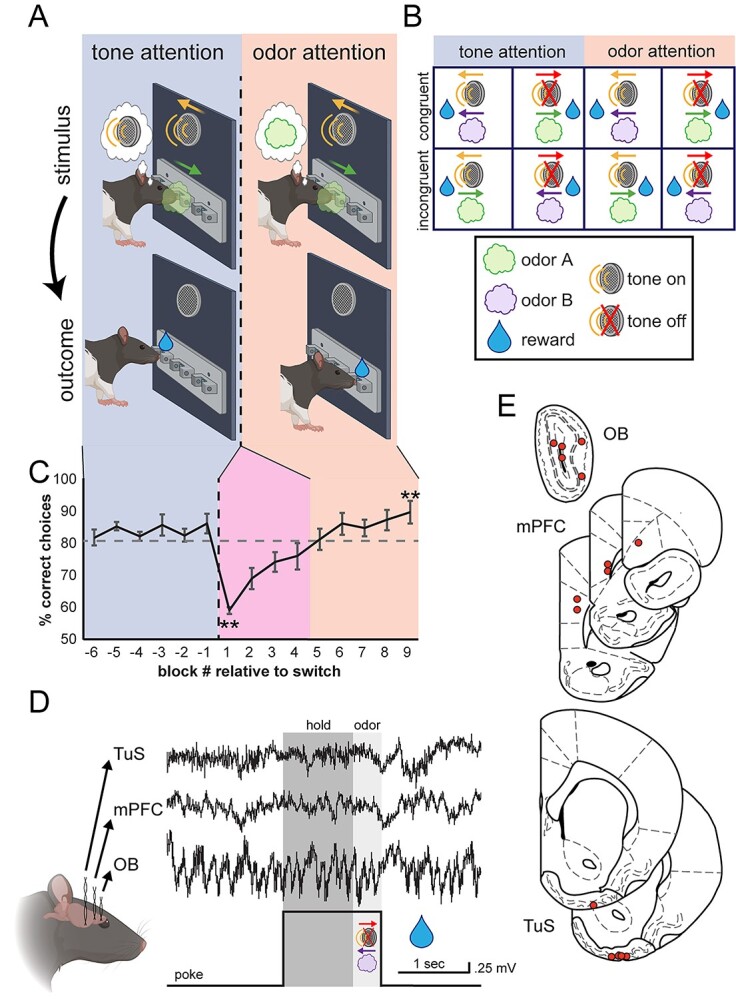
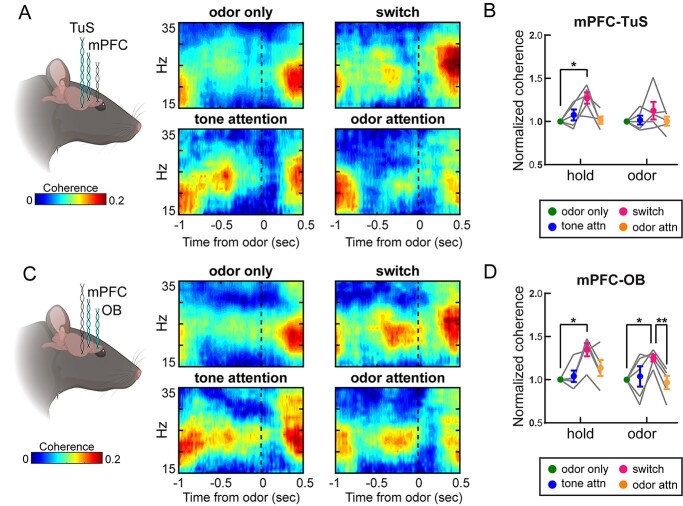
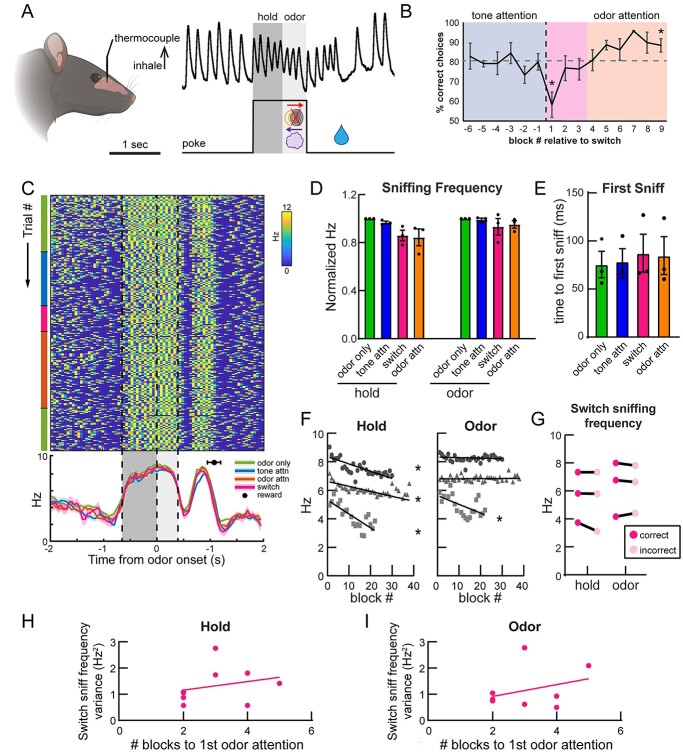
Methods: First, we used tracing methods to establish the tubular striatum (TuS, also known as the olfactory tubercle) as the primary olfactory region to receive direct mPFC input in rats. Next, we recorded (i) local field potentials from the olfactory bulb (OB), mPFC, and TuS, or (ii) sniffing, while rats completed an olfactory selective attention task.

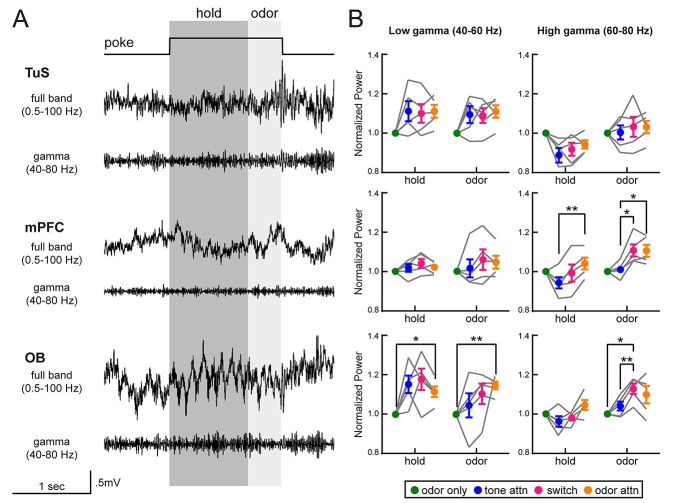
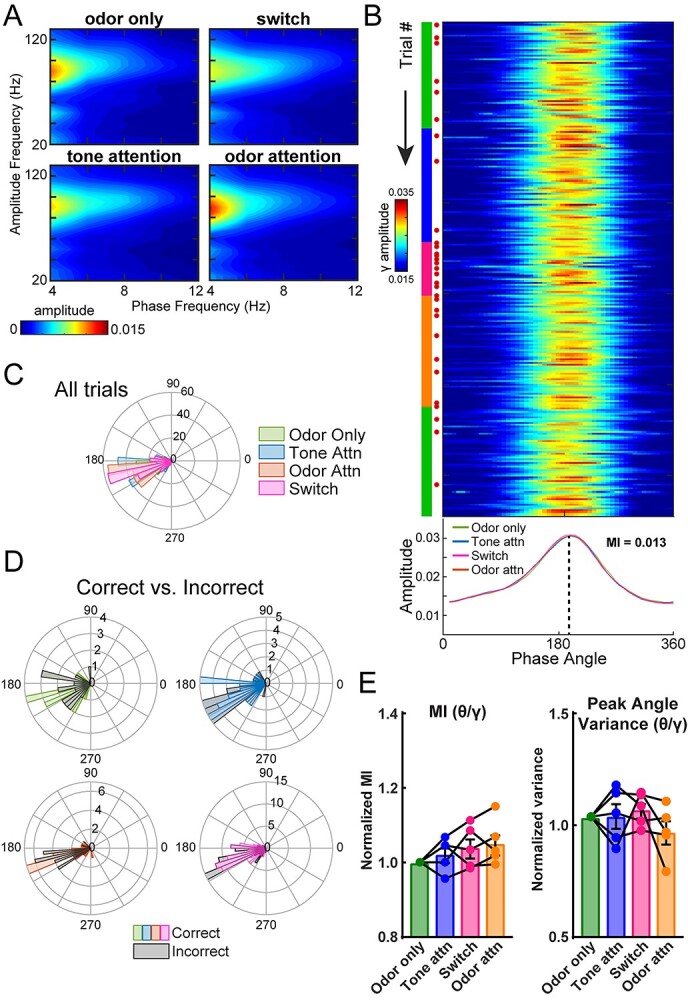
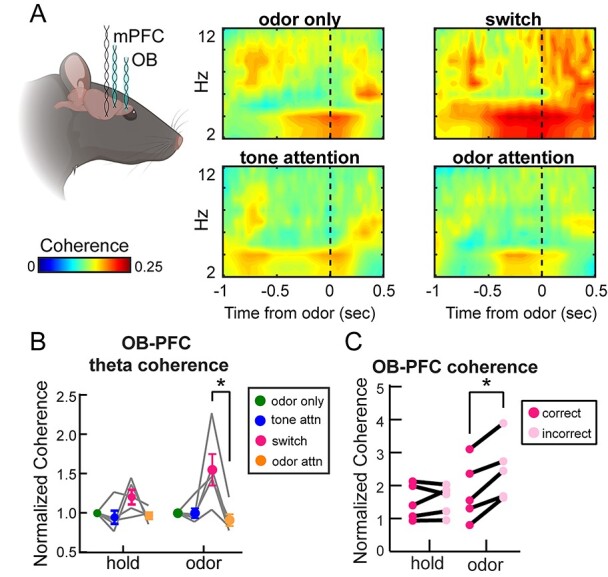
Results: Gamma power and coupling of gamma oscillations with theta phase were consistently high as rats flexibly switched their attention to odors. Beta and theta synchrony between mPFC and olfactory regions were elevated as rats switched their attention to odors. Finally, we found that sniffing was consistent despite shifting attentional demands, suggesting that the mPFC-OB theta coherence is independent of changes in active sampling.

Conclusions: Together, these findings begin to define an olfactory attention network wherein mPFC activity, as well as that within olfactory regions, are coordinated based upon attentional states.

Keywords: active sampling; neural circuits; neural oscillations; olfactory cortex; prefrontal cortex; sniffing.


Figures

Fig. 1
Fig. 1
The prelimbic mPFC and infralimbic mPFC preferentially target the tubular striatum compared to other major olfactory structures. A) The PrL and IL cortices were selectively targeted with 50/50 mixtures of Ef1a-DIO-synaptophysin-GFP/pENN-AAV9-CamKII-Cre-SV40 and Ef1a-FLEX-synaptophysin-mRuby/pENN-AAV9-CamKII-Cre-SV40, respectively. B) Representative mPFC image showing region-specific viral transduction within the same rat. Scale bar 250 μm. C) Representative image of the AON, showing few fluorescent puncta. Cell layers 1–2 and the lateral olfactory tract (lot) are indicated. Scale bar 250 μm. D) Representative image of the PCX and TuS. Note high fluorescence in the medial TuS and low fluorescence in the lateral TuS and PCX. Boxed region is shown in panel E. Scale bar 250 μm. E) Magnified view of boxed region shown in panel (D), showing high levels of fluorescent puncta, indicating synaptic terminals from TuS-projecting mPFC neurons. Scale bar 100 μm. F) Representative image of the OB absent of fluorescent puncta. Dashed lines indicate layers: (i) olfactory nerve layer; (ii) glomerular layer; (iii) external plexiform layer; (iv) mitral cell layer; (v) granule cell layer. Scale bar 250 μm. G) Quantification of fluorescent puncta across olfactory regions, normalized by area of quantified region. PrL: One-way analysis of variance (ANOVA), main effect of regions, F(3,21) = 7.82, P = 0.001. IL: One-way ANOVA, main effect of regions, F(3,12) = 37.08, P < 0.0001. Asterisks indicate results from Tukey’s multiple comparisons test, **P < 0.01, ****P < 0.0001. PrL mTuS versus IL mTuS, unpaired t-test, P = 0.02. H) Quantification of fluorescent puncta across layers in the mTuS. PrL: One-way ANOVA, main effect of layers, F(2,14) = 12.62, P = 0.0007. IL: One-way ANOVA, main effect of layers, F(2,8) = 43.04, P < 0.0001. Asterisks indicate results from Tukey’s multiple comparisons test, *P < 0.05, **P < 0.01, ***P < 0.001, ****P < 0.0001. PrL, prelimbic cortex; IL, infralimbic cortex; Cg1, cingulate area 1; DP, dorsal peduncular cortex; mTuS/lTuS, medial/lateral tubular striatum; PCX, piriform cortex; AON, anterior olfactory nucleus; OB, olfactory bulb; D, dorsal; M medial; L1–L3, layers 1–3. PrL injection, n = 8 rats; IL injection, n = 5 rats. All error bars represent SEM.
Fig. 2
Fig. 2
Among prefrontal cortex subregions, layer 5 prelimbic and infralimbic neurons provide the densest input to the tubular striatum. A) The TuS was injected with AAVrg-hsyn-GFP to identify TuS-projecting neurons throughout the prefrontal cortex. B) Representative mPFC image at Bregma +4.2 mm, showing GFP-labeled TuS-projecting neurons. Boxed region is indicated in panel Bi. Scale bar 500 μm. Bi). Magnified view of the boxed region in panel Bi. Scale bar 100 μm. C) Representative PFC image at Bregma +3.2 mm, showing GFP-labeled TuS-projecting neurons. Scale bar 500 μm. Ci) Magnified view of boxed region in panel C showing the PrL and IL cortices. Dotted lines indicate layers. Scale bar 100 μm. Cii) Magnified view of boxed region showing LO cortex. Scale bar 100 μm. Ciii) Magnified view of boxed region showing VO cortex. Scale bar 100 μm. n = 6 rats. D) Quantification of cell numbers across prefrontal cortex regions ipsilateral and contralateral to the injection site. Two-way ANOVA, main effect of hemisphere, F(1, 5) = 18.23, P = 0.0079, main effect of region, F(1.364, 6.818) = 15.74, P = 0.0041. Asterisks indicate results of Tukey’s multiple comparisons test, *P < 0.05, **P < 0.01. Error bars represent SEM. E) Distribution of cell bodies across PrL and IL layers, in both the contralateral and ipsilateral hemispheres, showing the majority of cell bodies are found in layer 5. PrL: Two-way ANOVA, main effect of layer F(1.15, 5.76) = 11.48, P = 0.014. IL: Two-way ANOVA, main effect of layer F(1.32, 6.61) = 42.55, P = 0.0003; main effect of hemisphere F(1,5) = 34.39, P = 0.002. n = 6 rats.
Fig. 3
Fig. 3
Investigating mPFC and olfactory network activity during odor-directed selective attention. A) Freely moving rats initiate a trial by nose poking in a center port, which triggers simultaneous delivery of 1 of 2 auditory cues and 1 of 2 odors (stimulus). These cues direct the rat to retrieve a fluid reward at either the left or the right port (outcome). Behavioral sessions begin with tone attention (auditory cues predict reward; blue shading) and switch to odor attention (odors predict reward; orange shading). B) All possible trial combinations in the CAT. Half of these are congruent (odor and tone indicate same reward port) and half are incongruent (odor and tone indicate opposite reward ports). C) Behavioral performance of all rats across behavioral sessions. After completing 6 blocks of tone attention at criterion (≥80% correct; blue shading), the task was switched to odor attention (orange shading). Rats then switched their attention to odors and completed 6 blocks at criterion. Block −1 versus 1 paired, two-tailed t-test, **P = 0.001. Block 1 versus 9 paired, two-tailed t-test, **P = 0.003. n = 5 rats, 4.6 ± 0.5 sessions per rat. Error bars represent SEM. D) All rats were implanted with bipolar recording electrodes in the OB, TuS, and mPFC, and LFPs were acquired during behavior. A sample trace is shown from a single trial, in which the rat pokes, holds in the center port for 1 s awaiting stimuli (dark gray shading), and remains for 400 ms to sample the stimuli (light gray shading). E) Electrode location summary. Red dots indicate tips of bipolar LFP electrodes.
Fig. 4
Fig. 4
Elevations in gamma power upon intermodal switching and selective attention to odors. A) Full band and gamma band filtered (40–80 Hz) traces from the TuS (top), the mPFC (middle), and the OB (bottom) on a single trial of the CAT. Analysis windows for 1-s hold and 400-ms odor periods are indicated in dark and light gray, respectively. B) Quantification of power in the low and high gamma ranges across all task types, normalized to odor only. For each region/frequency band, a 2-way ANOVA with Greenhouse-Geisser correction was completed. TuS, low gamma: main effect of task type, F(1.62, 6.5) = 6.04, P = 0.037. mPFC, high gamma: main effect of trial epoch, F(1.85, 7.38) = 13.66, P = 0.004. Interaction between trial epoch × task type, F(2.36, 9.44) = 5.91, P = 0.019. OB, high gamma: main effect of trial epoch, F(1.38, 5.52) = 9.47, P = 0.02. Main effect of task type, F(2.22, 8.88) = 7.60, P = 0.011. n = 5 rats, 4.6 ± 0.5 sessions per rat. On all graphs, asterisks indicate results from Tukey’s multiple comparisons *P < 0.05, **P < 0.01. All error bars represent SEM.
Fig. 5
Fig. 5
OB gamma oscillations couple with theta phase across attentional states. A) Mean comodulograms across rats showing strong coupling between high gamma and respiratory theta frequencies. n = 5 rats, 4.6 ± 0.5 sessions per rat. B) Trial-by-trial theta-gamma for one example session. Green, blue, pink, and orange markings on left side indicate current task type (odor only, tone attention, switch, and odor attention, respectively). Red dots indicate incorrect trials, which expectedly increase in frequency upon switch. The mean amplitude for the session, by task type, is plotted below. MI for the entire session = 0.013. C) Polar histogram of peak phase angles by task type for all trials across all sessions for an example rat (n = 4 sessions). All task types indicated significant periodicity (Rayleigh test, odor only P < 1e−18, tone attn P < 1e−24, switch P < 1e−27, odor attn P < 1e−31) and similar distributions (Kolmogorov–Smirnov tests, all comparisons P > 0.05). D) Polar histograms of correct and incorrect trials for each task type. For this example rat, incorrect trials were pooled across sessions and compared to a randomly selected equal number of correct trials. Peak phase angle distributions were statistically similar between correct and incorrect trials. (Kolmogorov–Smirnov tests, all comparisons P > 0.05). E) Left, theta-gamma MI across rats, normalized to MI for odor only trials. One-way ANOVA, F(2.37, 9.48) = 1.96, P = 0.019. Right, theta-gamma peak angle variance across rats, normalized to peak angle variance for odor-only trials. One-way ANOVA, F(2.03, 8.10) = 1.07, P = 0.387. n = 5 rats, 4.6 ± 0.5 sessions per rat. Error bars represent SEM.
Fig. 6
Fig. 6
Beta oscillations are more coherent between the mPFC and olfactory regions during intermodal attentional shifts. A) Coherogram showing coherence between the mPFC and TuS in the beta range (15–35 Hz) for one example rat across task types (n = 3 sessions). Nose poke begins at −1 s, dotted line indicates odor onset. B) Means for TuS-mPFC beta coherence across all rats, normalized to odor only. n = 5 rats, 4.6 ± 0.5 sessions per rat. Two-way ANOVA with Greenhouse-Geisser correction, main effect of task type, F(1.38, 5.41) = 6.54, P = 0.041. Error bars represent SEM. C) Coherogram showing coherence between the mPFC and the OB in the beta range (15–35 Hz) for one example rat across task types. Nose poke begins at −1 s, dotted line indicates odor onset. D) Means for OB-mPFC beta coherence across all rats, normalized to odor only. n = 5 rats, 4.6 ± 0.5 sessions per rat. Two-way ANOVA with Greenhouse-Geisser correction, main effect of task type, F(1.79, 7.15) = 13.06, P = 0.005. On all graphs, asterisks indicate results from Tukey’s multiple comparisons *P < 0.05, **P < 0.01. Error bars represent SEM.
Fig. 7
Fig. 7
OB and mPFC coherence in the respiratory theta range are strongly upregulated during an intermodal attentional shift to odor attention. A) Mean coherogram across rats showing coherence in the theta range (2–12 Hz) across task types. B) Mean theta coherence across rats for each trial epoch and each task type. Odor only, tone attention, and odor attention trials include only correct trials from criterion performance blocks. Switch quantification includes all trials from blocks below criterion performance. Two-way ANOVA with Greenhouse-Geisser correction, main effect of task type F(1.3, 5.2) = 7.07, P = 0.039. Asterisk on graph indicates results from Tukey’s multiple comparisons test, *P < 0.05. Error bars represent SEM. C) Theta coherence for correct and incorrect trials during the switch. While there were more correct than incorrect trials, randomly selected correct trials were excluded from this analysis to match the number of incorrect trials. n = 5 rats, 4.6 ± 0.5 sessions per rat. Two-way ANOVA with Greenhouse-Geisser correction, main effect of outcome F(1,4) = 76.81, P = 0.0009. Interaction between outcome and trial epoch F(1.56, 6.24) = 5.39, P = 0.048. Asterisk on graph indicates results from Sidak’s multiple comparisons test, *P < 0.05.
Fig. 8
Fig. 8
Rats maintain highly stereotyped sniffing strategies despite increased attentional demands. A) Sample trace of thermocouple signal from rat nasal cavity on a single trial. 600 ms hold and 400 ms odor epochs are indicated by dark and light gray shading, respectively. B) Behavioral performance. Block −1 versus 1 paired, two-tailed t-test, P = 0.049. Block 1 versus 9 paired, two-tailed t-test, P = 0.026. C) Instantaneous sniff frequency for one session, from one example rat (rat 137). Colored bars on the left-hand side indicate the current task type. Dotted lines and light and dark gray shading represent hold and odor epochs, respectively. Mean sniffing frequency ± SEM for each task type is plotted below, with the black circle indicating the mean time of reward acquisition (±SEM). D) Sniffing frequency means within each trial epoch. Two-way ANOVA with Greenhouse-Geisser correction, main effect of trial epoch F(1,2) = 29.47, P = 0.032. No main effect of task type, F(1.04, 2.09) = 3.2, P = 0.21. Error bars represent SEM. E) Time to the first sniff following odor onset. One-way ANOVA with Greenhouse-Geisser correction, F(1.19,2.38) = 1.91, P = 0.29. Error bars represent SEM. Similar results were seen when calculating time to second and third sniffs, as well as intervals between them (data not shown). F) Correlations between block # of the session and sniffing frequency. Rat 137 (circles) hold: R2 = 0.33, F(1,111) = 54.46, P < 0.0001, odor: R2 = 0.009, F(1,111) = 1.03, P = 0.31. Rat 138 (squares) hold: R2 = 0.61, F(1,18) = 28.61, P < 0.0001, odor: R2 = 0.32, F(1,18) = 8.406, P = 0.009. Rat 139 (triangles) hold: R2 = 0.3, F(1,168) = 73.14, P < 0.0001, odor: R2 = 0.0004, F(1,168) = 0.07, P = 0.79. G) Sniffing frequency for correct and incorrect trials in switch blocks only. Two-way ANOVA with Greenhouse-Geisser correction, main effect of trial epoch, F(1,2) = 57.65, P = 0.017. No main effect of trial outcome. n = 3 rats, 3.5 ± 2.5 sessions per rat. H) Relationship between switch sniff frequency variance during the hold period and number of blocks to first odor attention block at ≥80% correct. Each point represents one session. R2 = 0.068, F(1,7) = 0.51, P = 0.51. I) Relationship between switch sniff frequency variance during the odor period and number of blocks to first odor attention block at ≥80% correct. R2 = 0.11, F(1,7) = 0.84, P = 0.39.
Fig. 9
Fig. 9
Integrated model of odor-directed attention. In this model of odor-directed attention, the mPFC integrates with the olfactory system at early (OB) and late (TuS) stages of processing to form an olfactory attention network. Despite no state-dependent changes in sniffing behavior, odor-directed attention is accompanied by enhanced gamma oscillations in the OB and mPFC (orange labels). Similarly, while sniffing remains unchanged during a cognitively demanding switch to odor attention, beta band coherence is enhanced between the mPFC-OB and the mPFC-Tus (pink labels), suggesting it may aid attention-dependent odor processing.

Similar articles

Cited by

References

    1. Adrian ED. Olfactory reactions in the brain of the hedgehog. J Physiol. 1942:100:459–473. - PMC - PubMed
    1. Ährlund-Richter S, Xuan Y, van Lunteren JA, Kim H, Ortiz C, Pollak Dorocic I, Meletis K, Carlén M. A whole-brain atlas of monosynaptic input targeting four different cell types in the medial prefrontal cortex of the mouse. Nat Neurosci. 2019:22:657–668. - PubMed
    1. Arabkheradmand G, Zhou G, Noto T, Yang Q, Schuele SU, Parvizi J, Gottfried JA, Wu S, Rosenow JM, Koubeissi MZ, et al. Anticipation-induced delta phase reset improves human olfactory perception. PLoS Biol. 2020:18:e3000724. - PMC - PubMed
    1. de Araujo IE, Rolls ET, Kringelbach ML, McGlone F, Phillips N. Taste-olfactory convergence, and the representation of the pleasantness of flavour, in the human brain. Eur J Neurosci. 2003:18:2059–2068. - PubMed
    1. Bagur S, Lefort JM, Lacroix MM, de Lavilléon G, Herry C, Chouvaeff M, Billand C, Geoffroy H, Benchenane K. Breathing-driven prefrontal oscillations regulate maintenance of conditioned-fear evoked freezing independently of initiation. Nat Commun. 2021:12:2605. - PMC - PubMed

Publication types