. 2022 May 5;18(5):e1010178.
doi: 10.1371/journal.pgen.1010178. eCollection 2022 May.

Intestine-to-neuronal signaling alters risk-taking behaviors in food-deprived Caenorhabditis elegans

Affiliations

Intestine-to-neuronal signaling alters risk-taking behaviors in food-deprived Caenorhabditis elegans

Molly A Matty et al. PLoS Genet. .

Abstract

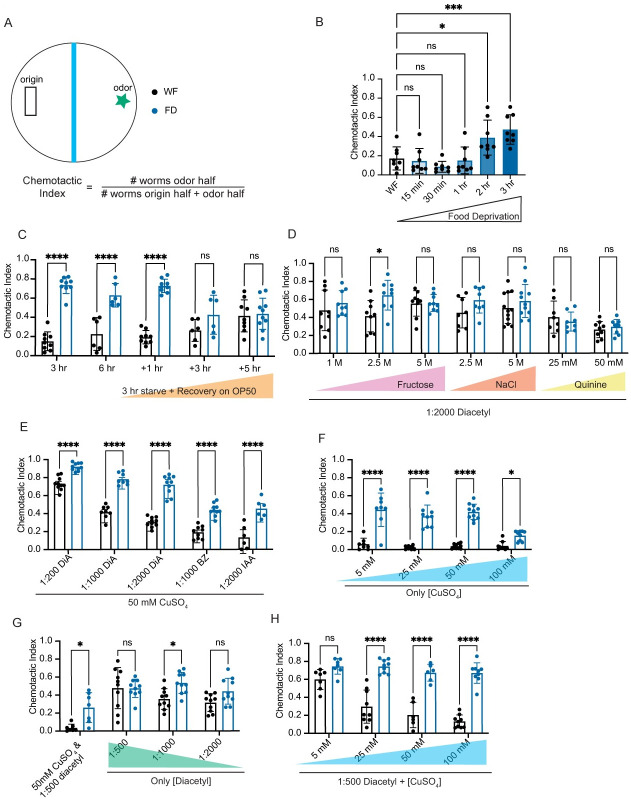
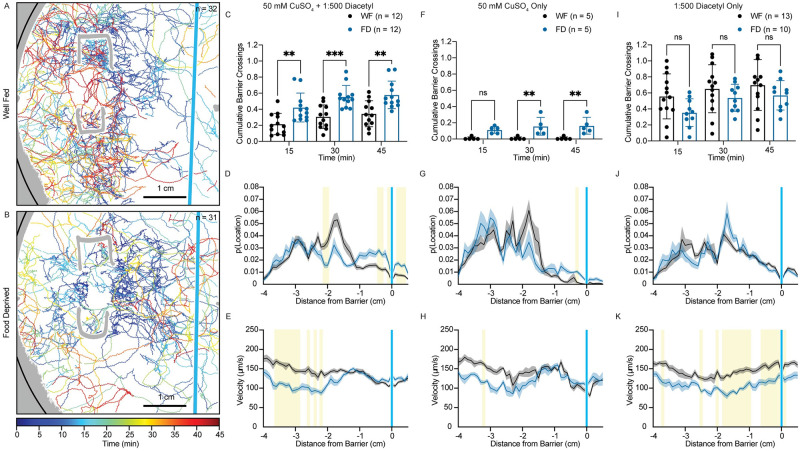
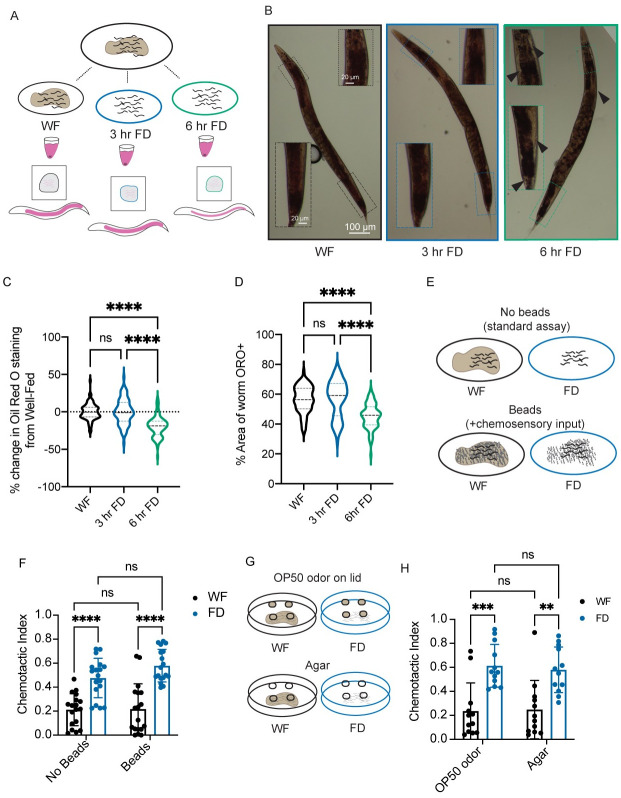
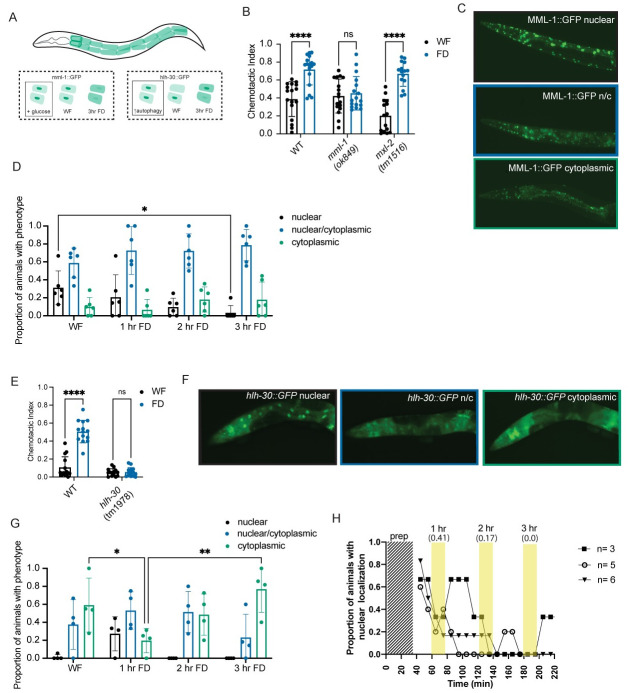
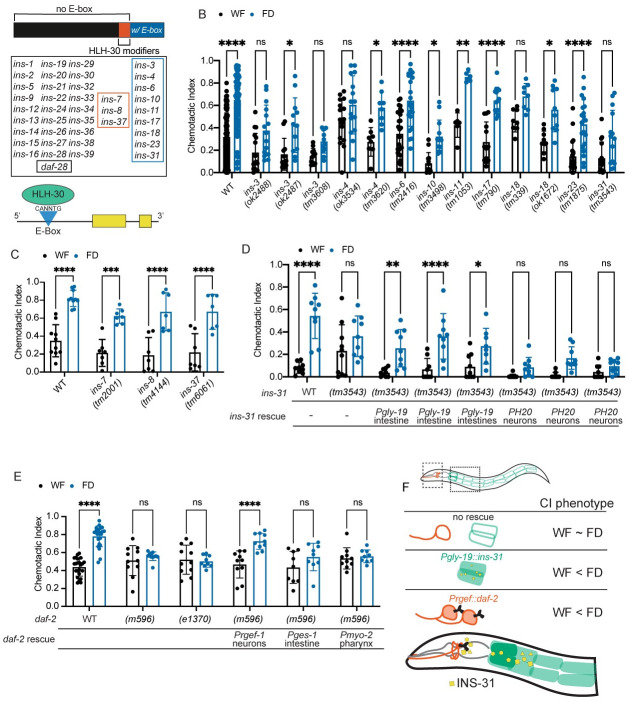
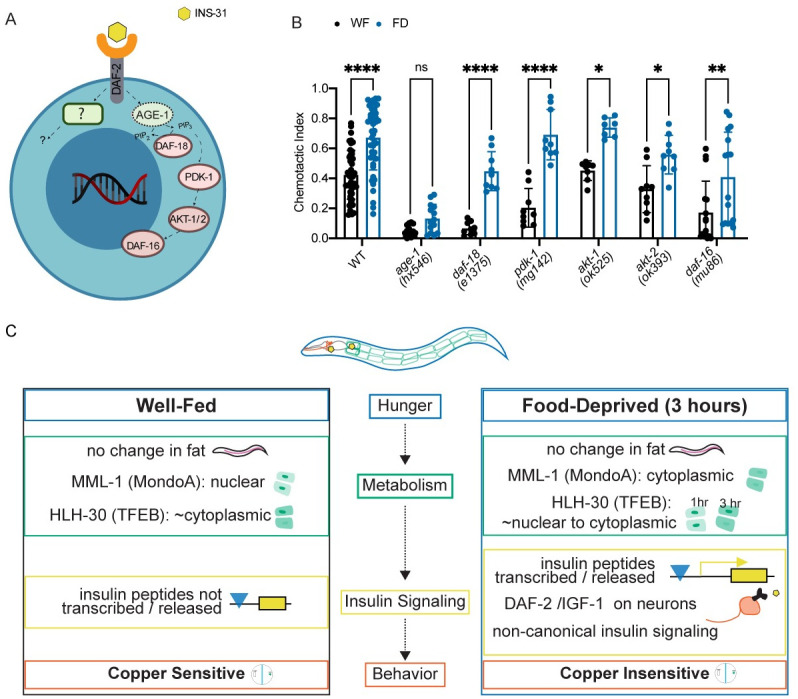
Animals integrate changes in external and internal environments to generate behavior. While neural circuits detecting external cues have been mapped, less is known about how internal states like hunger are integrated into behavioral outputs. Here, we use the nematode C. elegans to examine how changes in internal nutritional status affect chemosensory behaviors. We show that acute food deprivation leads to a reversible decline in repellent, but not attractant, sensitivity. This behavioral change requires two conserved transcription factors MML-1 (MondoA) and HLH-30 (TFEB), both of which translocate from the intestinal nuclei to the cytoplasm during food deprivation. Next, we identify the insulin-like peptide INS-31 as a candidate ligand relaying food-status signals from the intestine to other tissues. Further, we show that neurons likely use the DAF-2 insulin receptor and AGE-1/PI-3 Kinase, but not DAF-16/FOXO to integrate these intestine-released peptides. Altogether, our study shows how internal food status signals are integrated by transcription factors and intestine-neuron signaling to generate flexible behaviors via the gut-brain axis.


Conflict of interest statement

The authors have declared that no competing interests exist.

Figures

Fig 1
Fig 1. Starvation reduces copper avoidance.
A) Schematic of the sensory integration assay. ~100–200 day 1 adult animals (n) are placed in the black rectangle. Blue barrier represents copper barrier (or other repellant) and star represents diacetyl or other attractant. Chemotactic Index is the number of animals that have crossed the barrier (odor side) divided by the total number of animals on the plate (odor + origin sides). Experiments with well-fed (WF) animals will appear with black dots and those with food-deprived (FD) animals will be indicated with blue dots. Unless otherwise noted, FD is 3 hrs with no food. Each dot represents a single plate (N) of animals (n). B) Animals are deprived of food for increasing periods of time (15 mins, 30 mins, 2 hrs, 3 hrs). Animals are exposed to 50 mM CuSO4 repellant and 1:500 (0.2%) diacetyl attractant. N = 8. C) Sensory integration behaviors of animals that have been starved for 3 hrs and 6 hrs. Animals that have been starved for 3 hours are allowed to recover for 1, 3, or 5 hrs on OP50. Well-fed matched partners are kept on OP50 plates for the entire length of the experiment. Animals are exposed to 50 mM CuSO4 repellant and 1:500 (0.2%) diacetyl attractant. N≥6. D) Animals are exposed to increasing concentrations of other repellants (Fructose, NaCl, Quinine) with the attractant 0.05% diacetyl (1:2000) in each condition N≥7. E) Animals are exposed to decreasing concentrations of diacetyl (DiA) (0.2%, 0.1% and 0.05%, or 1:200, 1:1000, and 1:2000, respectively) and other volatile attractants 0.1% Benzaldehyde (BZ) and 0.05% Isoamyl Alcohol (IAA). 50 mM CuSO4 is the repellant in each condition N≥6. F) Animals are exposed to CuSO4 in increasing concentrations (5 mM, 25 mM, 50 mM, 100 mM) without any attractant N≥8. G) Animals are exposed to diacetyl alone in decreasing concentrations (0.2%, 0.1%, 0.05%). Full assay (0.2% diacetyl and 50 mM CuSO4) is included as a control N≥7. H) Animals are exposed to 1:500 diacetyl and increasing concentrations of CuSO4 (5 mM, 25 mM, 50 mM, 100 mM) N≥6. All graphs are analyzed using a two-way ANOVA, determined to have significant differences across well-fed and food-deprived conditions. WF/FD comparisons were then performed as pairwise comparisons within each genotype or treatment as t-tests with Bonferroni corrections for multiple comparisons. * p<0.5, ** p<0.01, *** p<0.001, **** p<0.0001, ns p>0.05. Error bars are S.D.
Fig 2
Fig 2. Riskier search strategies in food-deprived animals.
(A) Worm tracks (n = 32) are plotted for a representative sensory integration assay of well-fed animals behaving in the presence of 50mM CuSO4 (blue stripe) and 1 μl 0.2% diacetyl (1:500) (location out of view to the right). Regions of the plate that were not able to be tracked are in gray with the edge of the plate indicated in black. Tracks are plotted and color coded for time (0 to 45 minutes). (B) Worm tracks (n = 31) are plotted for a representative sensory integration assay of 3 hour food-deprived animals. Conditions and plotting the same as in A. (C, F, I) The fraction of mean cumulative net barrier crossings is plotted at three time points (15, 30, and 45 minutes). Well-fed (WF) animals appear with black dots and food-deprived (FD) animals are indicated with blue dots. Each dot represents a single plate of animals. C) 50 mM CuSO4 and 0.2% diacetyl F) 50 mM CuSO4, no diacetyl I) No copper, 0.2% (1:500) diacetyl. Graphs are analyzed using a two-way ANOVA to determine significant differences across well-fed and food-deprived conditions. WF/FD comparisons were then performed as pairwise comparisons within each time period as t-tests with Bonferroni corrections for multiple comparisons. * p<0.5, ** p<0.01, *** p<0.001, **** p<0.0001, ns p>0.05. (D, G, J) The probability of an animal being located at 1 mm binned distances from the barrier is plotted for well-fed (black) and food-deprived animals (blue). The dark line represents the mean probability of residence with the shaded areas representing the standard error of the mean. D) 50 mM CuSO4 and 0.2% diacetyl G) 50 mM CuSO4, no diacetyl J) No copper, 0.2% diacetyl. For each graph, multiple unpaired t-tests with Welch’s correction were performed with correction for multiple comparisons with Holm-Šídák post-hoc test. Corrected p values <0.05 are indicated by yellow shading. A comprehensive list of the statistics can be found in S2 Table. (E, H, K) The mean velocity of animals as a function of distance from the barrier is plotted for well-fed (black) and food-deprived animals (blue). Conditions, plotting, and statistics are the same as in D, G, and J.
Fig 3
Fig 3. Lack of food, not fat or physical interactions, drive behavioral changes.
(A) Schematic of Oil Red O experiments. Animals are raised together to day 1 of adulthood and separated into three groups: well-fed (on food), 3 hr food-deprived, and 6 hr food-deprived. Animals are stained using Oil Red O and then imaged using a color camera. (B) Representative images of well-fed (WF, black), 3 hour food-deprived (3hr FD, blue), and 6 hr food-deprived (6 hr FD, green). Inset images are shown, highlighting the regions where there is the most difference in staining. Black arrows highlight regions of no Oil Red O stain in 6 hr FD. (C) Graph showing the percent change in Oil Red O staining when compared to the average of the area of Oil Red O signal above a threshold value in the well-fed group within each independent experiment. N = 3, n>20 within each experimental treatment group. (D) Graph showing the percent of the animals’ area that contains Oil Red O signal above threshold N = 3, n>20 within each experimental treatment group. Same data as in C, shown as non-normalized values. (E) A schematic representing the experiment in F, in which populations of animals are either well-fed or food-deprived in the presence or absence of Sephadex beads before performing the sensory integration assay. (F) Prior to the sensory integration assay, animals are exposed to either standard OP50 (“no beads WF”) or empty plates (“no beads FD”), or Sephadex gel beads as chemosensory input. Alternatively, animals were exposed to beads and no food (“beads FD”) or OP50 with Sephadex beads on top (“beads WF”) for 3 hours. Animals were then exposed to standard Sensory Integration Assay set-up with 50 mM CuSO4 and 1 μl of 0.2% diacetyl. N≥18. (G) A schematic representing the experiment in H, in which populations of animals are either well-fed or food-deprived in the presence of OP50-containing agar plugs on the lid of the plate or agar alone plugs on the lid of the plate before performing the sensory integration assay. (H) Prior to the sensory integration assay, animals are exposed to either standard OP50 empty plates, covered with lids containing either agar plugs (agar) or agar plugs with OP50 lawns (OP50 odor) as a chemosensory input for 3 hours. Animals were then exposed to standard Sensory Integration Assay set-up with 50 mM CuSO4 and 1 μl of 0.2% diacetyl. N = 12 per condition. C and D were analyzed using Welch’s ANOVA test with Dunnett’s multiple comparisons test. * p<0.5, ** p<0.01, *** p<0.001, **** p<0.0001, ns p>0.05. F and G were analyzed using a full model two-way ANOVA, determined to have significant differences across well-fed and food-deprived conditions but no difference between “bead”/“no bead” groups or “odor”/”agar” groups. Those comparisons are shown to indicate no difference between “beads” and “no beads”. Pairwise comparisons within each treatment were performed as t-tests with Tukey’s multiple comparisons test. Error bars are S.D.
Fig 4
Fig 4. mml-1 and hlh-30 are required for sensory integration change upon food deprivation, correlated with shifts in their intestinal localization.
(A) Schematic showing the 20 intestinal cells in a day 1 adult C. elegans. Our findings for mml-1::gfp and hlh-30::gfp transgenic animals are shown in the dotted box, while previously published paradigms are within the solid line box. Addition of glucose has been shown to induce nuclear localization of MondoA. Autophagy has been shown to increase nuclear localization of HLH-30. (B) Standard sensory integration assay with mml-1(ok849) and mxl-2(tm1516) and wildtype controls. N = 20. (C) Representative images of MML-1::GFP localization in day 1 adult animals (data quantified in D). All images were collected with the same exposure time and laser power. (D) Intestinal MML-1::GFP expression in animals during static timepoints food deprivation. Only intestinal expression was characterized as “nuclear”, “nuclear/cytoplasmic”, or “cytoplasmic”. Each dot represents the proportion of animals within an experiment with the phenotype. N = 6, n = 296.(E) Standard sensory integration assay with hlh-30(tm1978) mutant animals and wildtype controls. N = 9. (F) Representative images of HLH-30::GFP localization in day 1 adult animals (data quantified in G). All images were collected with the same exposure time and laser power. (G) Intestinal HLH-30::GFP expression in animals during static timepoints of food deprivation. Only intestinal expression was characterized as “nuclear”, “nuclear/cytoplasmic”, or “cytoplasmic”. Each dot represents the proportion of animals within an experiment with the phenotype. N = 3, n = 149. (H) Intestinal HLH-30::GFP expression in animals during time lapse imaging. The proportion of animals (n = 3, n = 5, n = 6) with nuclear localization are plotted over time, with images taken every 10 minutes. The areas shaded in yellow correspond to the timepoints that match those in the separate experiments in Fig 4G, with the average of the timepoints within that period of time in parentheses. The shaded region labeled “prep” denotes time that the animals are off food but cannot be imaged due to preparation constraints. B and E were analyzed using two-way ANOVA, determined to have significant differences across well-fed and food-deprived conditions. WF/FD comparisons were then performed as pairwise comparisons within each genotype or treatment as t-tests with Bonferroni’s multiple comparisons test. D and G were analyzed using Two-Way ANOVA, determined to have significant differences across localization and an interaction between time of food deprivation and localization. Within each localization group, pairwise comparisons were performed across each time point and tested for significance using Tukey’s multiple comparisons test. * p<0.5, ** p<0.01, *** p<0.001, **** p<0.0001, ns p>0.05. Error bars are S.D.
Fig 5
Fig 5. Sensory integration changes require HLH-30-regulated insulin while daf-2 is required in neurons.
(A) HLH-30 interacts with C. elegans insulin peptides. Of the 40 insulin-like peptides encoded in the C. elegans genome, 22% have an HLH-30 binding motif (CANNTG E-box, blue) in the 5’ UTR (< 300bp upstream of start site) [52]. 7% of insulins have been shown to regulate the localization of HLH-30 but do not contain an E-box (orange, “HLH-30 modifiers”). An illustration of a representative insulin peptide with two yellow exons and an upstream E-box with HLH-30 initiating transcription. (B) All insulins known to contain an HLH-30 binding motif in the 5’ UTR were tested using the standard sensory integration assay. When available, more than one allele was tested (N≥8) for each insulin, with wildtype (N2) animals tested with each mutant. (C) Insulins previously shown to regulate HLH-30 localization (ins-7, ins-8, ins-37) were tested using the standard sensory integration assay alongside wildtype (N2) control. N≥7. (D) ins-31 mutants and tissue-specific rescues are tested in the standard sensory integration assay. N ≥8 for each strain tested alongside wildtype N2. ins-31 is rescued in neurons and intestines using tissue-specific promoters. (E) daf-2 mutants and tissue-specific rescues are tested in the standard sensory integration assay N ≥ 9 for each strain tested alongside wildtype N2. daf-2 is rescued in neurons, intestines, and pharynx using tissue-specific promoters. (F) Schematic showing requirement of ins-31 in the intestine and daf-2 in neurons. CI phenotype means Chemotactic Index phenotype, where wildtype animals display a chemotactic index of WF < FD. All graphs were analyzed using a two-way ANOVA, determined to have significant differences across well-fed and food-deprived conditions. WF/FD comparisons were then performed as pairwise comparisons within each genotype or treatment as t-tests with Bonferroni’s multiple comparisons test. * p<0.5, ** p<0.01, *** p<0.001, **** p<0.0001, ns p>0.05.
Fig 6
Fig 6. Insulin-signaling pathway acting downstream of DAF-2 receptors.
(A) Schematic of a neuron’s daf-2-mediated canonical and non-canonical insulin signaling. Summary of the findings in B. Created with Biorender.com (B) Standard sensory integration assay performed with mutants in the canonical insulin signaling pathway (age-1, daf-18, pdk-1, akt-1, akt-2, and daf-16,), alongside wildtype N2 N≥7. (C) Summary of data and proposed model through which food deprivation alters animal behavior. B was analyzed using two-way ANOVA, determined to have significant differences across well-fed and food-deprived conditions. WF/FD comparisons were then performed as pairwise comparisons within each genotype or treatment as t-tests with Bonferroni’s multiple comparisons test. * p<0.5, ** p<0.01, *** p<0.001, **** p<0.0001, ns p>0.05.

References

    1. Dugatkin LA. Principles of animal behavior: University of Chicago Press; 2020.
    1. Sternson SM, Nicholas Betley J, Cao ZF. Neural circuits and motivational processes for hunger. Curr Opin Neurobiol. 2013;23(3):353–60. doi: 10.1016/j.conb.2013.04.006 . - DOI - PMC - PubMed
    1. Taghert PH, Nitabach MN. Peptide neuromodulation in invertebrate model systems. Neuron. 2012;76(1):82–97. doi: 10.1016/j.neuron.2012.08.035 . - DOI - PMC - PubMed
    1. Atasoy D, Betley JN, Su HH, Sternson SM. Deconstruction of a neural circuit for hunger. Nature. 2012;488(7410):172–7. doi: 10.1038/nature11270 . - DOI - PMC - PubMed
    1. Gillette R, Huang RC, Hatcher N, Moroz LL. Cost-benefit analysis potential in feeding behavior of a predatory snail by integration of hunger, taste, and pain. Proc Natl Acad Sci U S A. 2000;97(7):3585–90. doi: 10.1073/pnas.97.7.3585 . - DOI - PMC - PubMed

Publication types

Substances