. 2022 May 6;376(6593):eabm9922.
doi: 10.1126/science.abm9922. Epub 2022 May 6.

The geometry of domain-general performance monitoring in the human medial frontal cortex

Affiliations

The geometry of domain-general performance monitoring in the human medial frontal cortex

Zhongzheng Fu et al. Science. .

Abstract

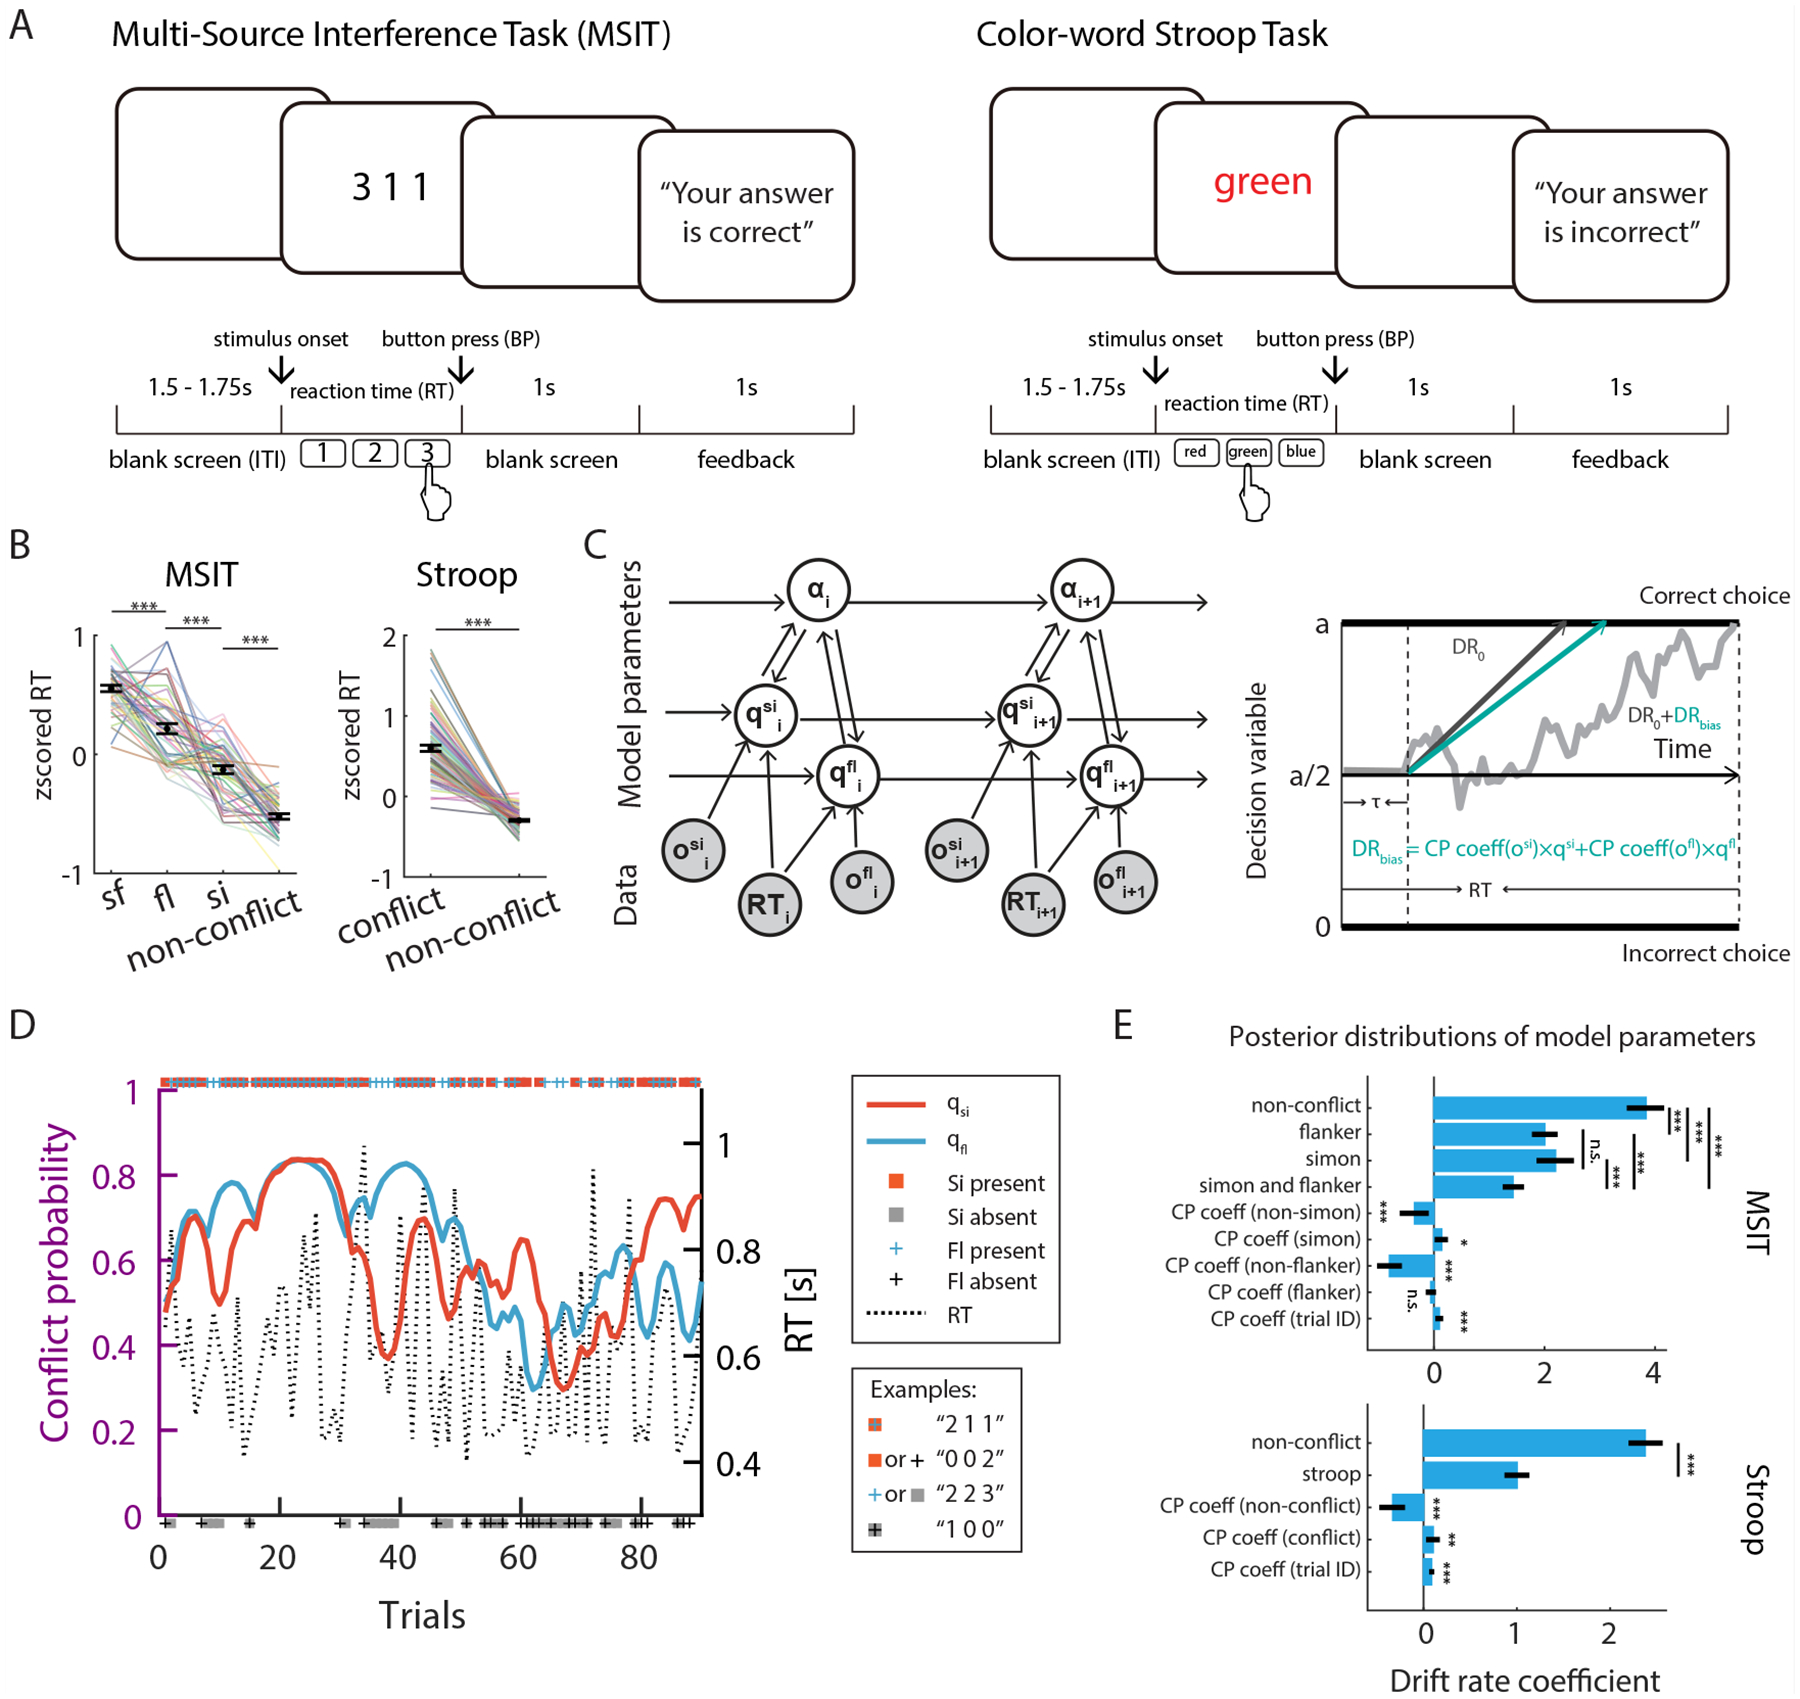
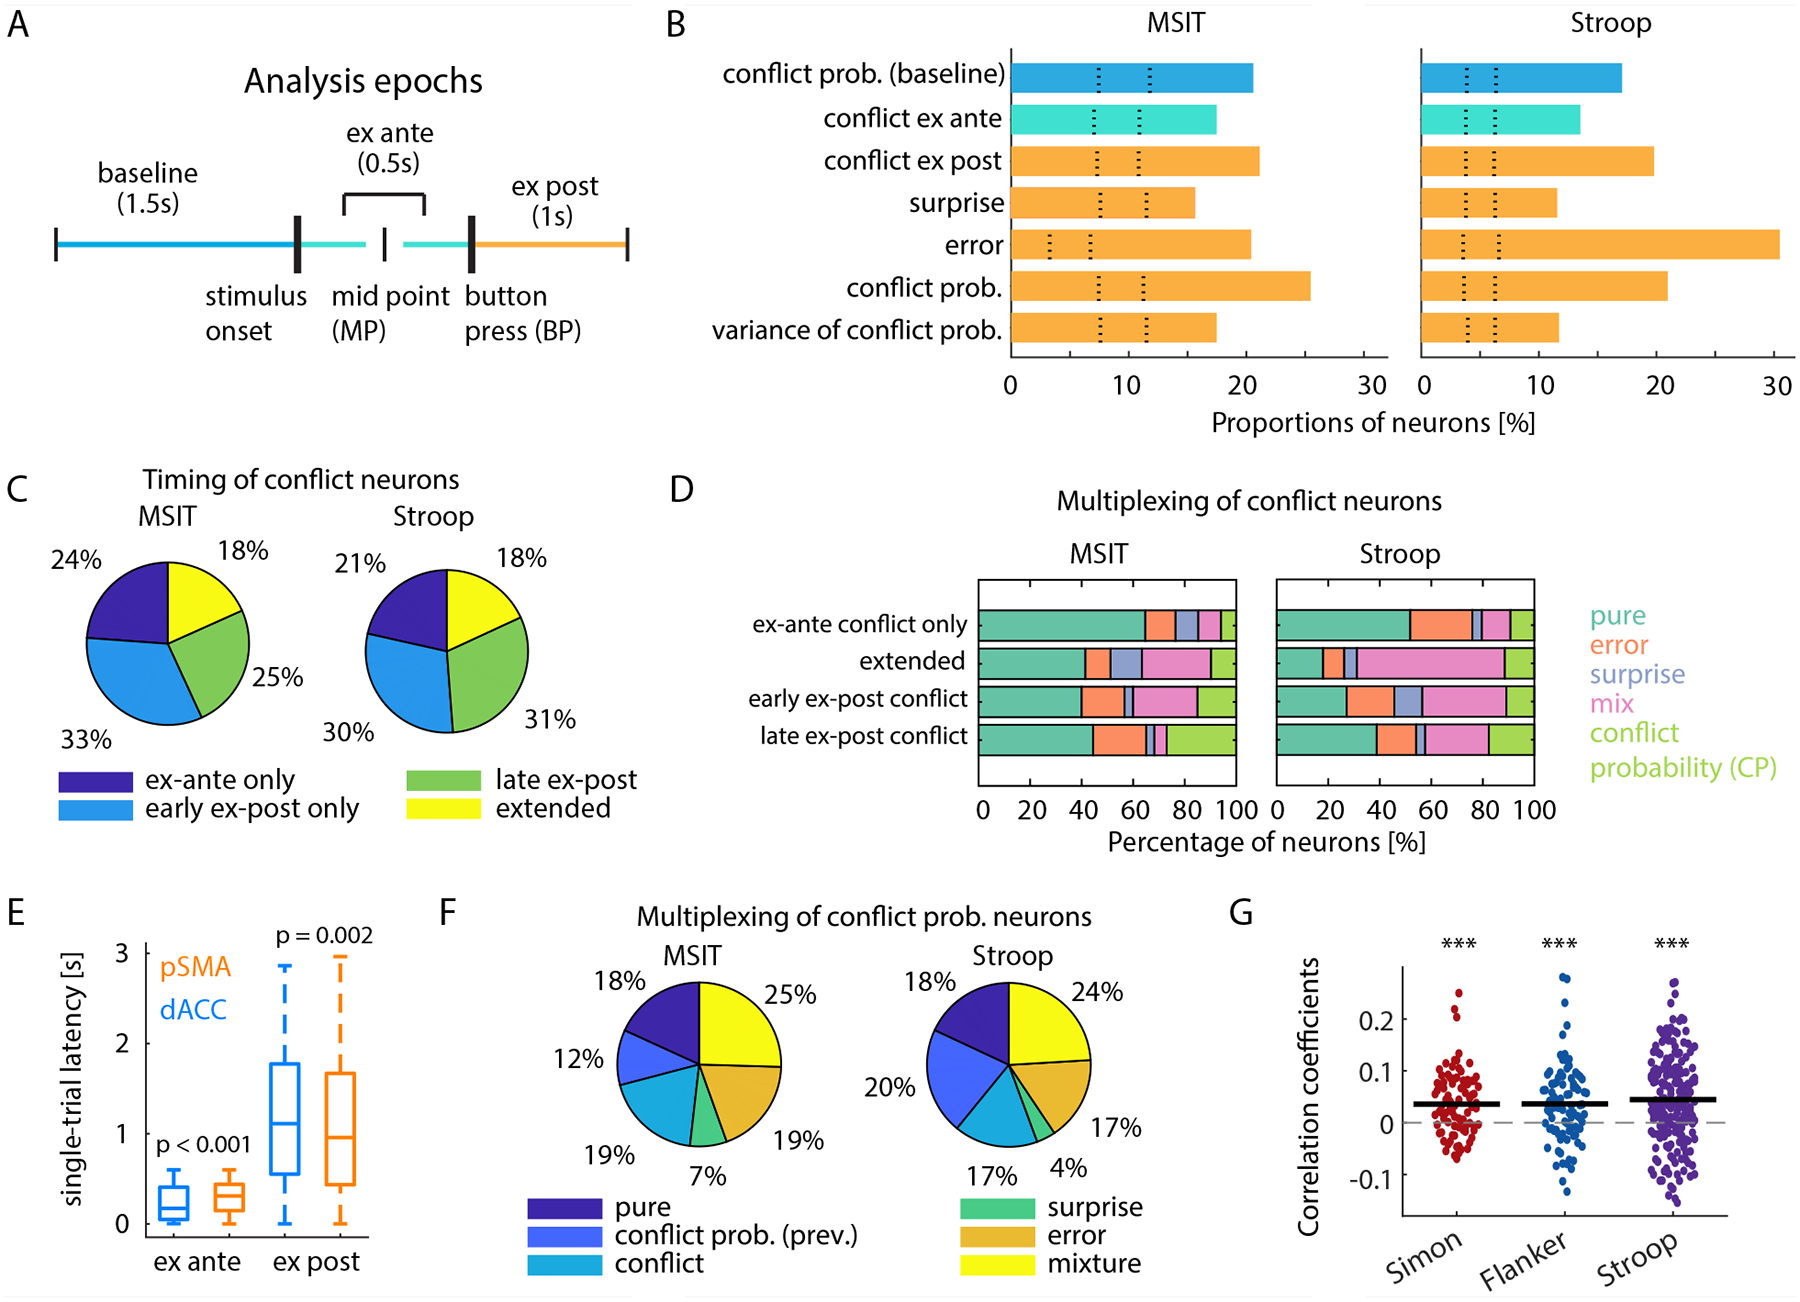
Controlling behavior to flexibly achieve desired goals depends on the ability to monitor one's own performance. It is unknown how performance monitoring can be both flexible, to support different tasks, and specialized, to perform each task well. We recorded single neurons in the human medial frontal cortex while subjects performed two tasks that involve three types of cognitive conflict. Neurons encoding conflict probability, conflict, and error in one or both tasks were intermixed, forming a representational geometry that simultaneously allowed task specialization and generalization. Neurons encoding conflict retrospectively served to update internal estimates of conflict probability. Population representations of conflict were compositional. These findings reveal how representations of evaluative signals can be both abstract and task-specific and suggest a neuronal mechanism for estimating control demand.


Conflict of interest statement

Competing interest: none

Figures

Fig. 1.
Fig. 1.. Tasks, Bayesian conflict learning model, reaction time analyses
(A) Task structure. (B) RTs were significantly prolonged by conflict in MSIT (left, N=41 sessions) and Stroop task (right, N=82 sessions). (C) The conflict probability estimation process (left) and the decision process modelled as a drift diffusion (right). Shown is the MSIT model, which has the six variables learning rate (α), Simon probability (qsi), Flanker probability (qfl), observed Simon conflict (osi), observed Flanker conflict (ofl), and RT. Observables (trial congruency, RT, and outcome) are shown in gray, model parameters are in white. Arrows indicate information flow. (D) Estimated Simon probability (red) and Flanker probability (blue) from an example MSIT session. Markers placed on the top indicated the type of conflict present. (E) Posterior distributions of model parameters after fitting to the behavior of all subjects. Black bars show high density intervals. Conflict probability (CP) had a significant effect on RT. Vertical bars with asterisks showed comparisons between posterior distribution, and singled asterisks marked comparisons with zero. *p < 0.05, ** p < 0.01, *** p < 0.001, n.s., not significant (p > 0.05).
Fig. 2.
Fig. 2.. Recording locations and example neurons.
(A) Recording locations shown on top of the CIT168 Atlas brain. Each dot indicates the location of a microwire bundle. (B-D) Activity of three example neurons that show similar response dynamics in both tasks. Shown is a neuron signaling action error (B), conflict by firing rate increase (C), and conflict by firing rate decrease (D). The black triangles mark stimulus onset. Trials are resorted by type and subsampled to equalize trial numbers for visualization only.
Fig. 3.
Fig. 3.. Single neuron tuning properties.
(A) Illustration of epochs used for analysis. Thick vertical bars represent physical events, the slim vertical bars demarcate epochs. (B) Percentage of neurons encoding the variable indicated in the two tasks. The color code is as indicated in (A). Dotted lines represent 2.5th and 97.5th percentiles of the null distribution obtained from permutation. For all groups shown, p < 0.001. (C) Percentage of conflict neurons that are selective in each time period. Early and late ex-post epochs denote 0–1s and 1–2s after button press. (D) Percentage of conflict neurons that were also selective for error, surprise, conflict probability (CP), or any combination of these factors (“mix”). (E) Comparison of single-trial neuronal response latency of conflict neurons in dACC and pre-SMA (correct trials only, t=0 is stimulus onset for ex-ante and button press for ex-post conflict neurons). (F) Percentage of conflict probability neurons that were also selective for conflict probability on the last trial, conflict, surprise, error, or all combinations of these variables (“mix”). (G) Neuronal signature of updating conflict probability estimation. Correlation is computed between the difference between current estimation and conflict probability on the last trial (behavioral update) and the difference between demeaned FRex-post and FRbaseline (neural update) for all conflict probability neurons. *** p < 0.001.
Fig. 4.
Fig. 4.. State-space representation of conflict and conflict probability.
(A) State-space representation of conflict (left, ex-ante; right, ex-post) in MSIT task visualized in PCA space. Dotted line is the vector used to classify pairs of conflict conditions in (B). (B) Decoding accuracy from classification of pairs of conflict conditions in MSIT. (C) Coding dimensions invariant between Simon and Flanker conflict. At each time point, a decoder is trained on Simon vs. non-Simon and tested on held out Flanker vs. non-Flanker trials (black), and vice-versa (grey). (D) Conflict representations are compositional. Decoders trained on one edge of the parallelogram were able to differentiate between conditions along the opposite parallel edge (orange and blue edges shown in A, respectively, shown on left and right). Dotted lines show 97.5th percentile of the null distribution. (E-G) State-space representation of conflict probability in MSIT and Stroop, visualized in PCA space. Green dots mark baseline start, the two cyan squares delineate the range of stimulus onsets, blue dots mark button press and red dots mark end of trial. Trials are aligned to button press. Color fades as the trial progresses. Numbers signify percentage of variance explained by each principal component (PC). *p < 0.05, ** p < 0.01, *** p < 0.001, n.s., not significant (p > 0.05). MP=mid point. BP=button press. Stim=Stim onset.
Fig. 5.
Fig. 5.. Domain-general representation of performance monitoring signals.
(A) Task-invariant decoding of errors. Bar on the right shows the variance explained by the different dPCA components. Data from the whole trial were used. (B) Task-invariant decoding of conflict. The bar on the right represents variance explained by the different dPCA components (color code see figure legend). Data from the whole trial were used. (C) Separability of conflict conditions along the domain-general conflict axis in both the ex-ante (left) and ex-post epochs (right). The dPCA coding dimension was constructed (separately for each epoch) using Stroop, SF conflict and no conflict trials and supported decoding of Stroop, Simon and Flanker conflicts (“task-invariant”) as well as separation of Simon and Flanker conditions. (D) Task-invariant decoding of conflict probability. The dPCA coding axis was constructed using Stroop and Simon conflict probability (binned by quartiles into four levels) and supported pairwise decoding of conflict probability levels in both tasks. Bar at the bottom shows variance explained of dPCA components. Data from single ROIs were used. (E-F) Relationship between task-invariant single neuron tuning strength of error (E), conflict ex post (F) and the corresponding dPCA weights. Pie charts show the percentages of “task-invariant” neurons (red slice) that had a significant main effect for performance monitoring variable and those that had significant effect only in either MSIT or Stroop (“task-dependent”, blue slice). Scatter plots (left) shows significant correlation between task-invariant coding strength and the corresponding dPCA weights. Y-axis shows correlation of firing rate of a neuron with the given variable, after removing task information by partial correlation (see Methods). *p < 0.05, ** p < 0.01, *** p <= 0.001, n.s., not significant (p > 0.05). MP = mid point. BP=button press. Stim=Stim onset.

References

    1. Koechlin E, Ody C, Kouneiher F, Science. 302, 1181–1185 (2003). - PubMed
    1. Badre D, D’Esposito M, J. Cogn. Neurosci 19, 2082–2099 (2007). - PubMed
    1. Badre D, Nee DE, Trends Cogn. Sci 22, 170–188 (2018). - PMC - PubMed
    1. Ullsperger M, Danielmeier C, Jocham G, Physiol. Rev 94, 35–79 (2014). - PubMed
    1. Passingham RE, Bengtsson SL, Lau HC, Trends Cogn. Sci 14, 16–21 (2010). - PMC - PubMed