. 2022 Jun 27;189(3):1814-1832.
doi: 10.1093/plphys/kiac171.

MicroRNA candidate miRcand137 in apple is induced by Botryosphaeria dothidea for impairing host defense

Affiliations

MicroRNA candidate miRcand137 in apple is induced by Botryosphaeria dothidea for impairing host defense

Xinyi Yu et al. Plant Physiol. .

Abstract

MicroRNA (miRNA)-mediated gene silencing is a master gene regulatory pathway in plant-pathogen interactions. The differential accumulation of miRNAs among plant varieties alters the expression of target genes, affecting plant defense responses and causing resistance differences among varieties. Botryosphaeria dothidea is an important phytopathogenic fungus of apple (Malus domestica). Malus hupehensis (Pamp.) Rehder, a wild apple species, is highly resistant, whereas the apple cultivar "Fuji" is highly susceptible. Here, we identified a 22-nt miRNA candidate named miRcand137 that compromises host resistance to B. dothidea infection and whose processing was affected by precursor sequence variation between M. hupehensis and "Fuji." miRcand137 guides the direct cleavage of and produced target-derived secondary siRNA against Ethylene response factor 14 (ERF14), a transcriptional activator of pathogenesis-related homologs that confers disease resistance to apple. We showed that miRcand137 acts as an inhibitor of apple immunity by compromising ERF14-mediated anti-fungal defense and revealed a negative association between miRcand137 expression and B. dothidea sensitivity in both resistant and susceptible apples. Furthermore, MIRCAND137 was transcriptionally activated by the invading fungi but not by the fungal elicitor, implying B. dothidea induced host miRcand137 as an infection strategy. We propose that the inefficient miRcand137 processing in M. hupehensis decreased pathogen-initiated miRcand137 accumulation, leading to higher resistance against B. dothidea.


Figures

Figure 1
Figure 1
Validation of miRcand137 and its MIR locus. A, Prediction of the transcription locus of miRcand137 in Apple Genome. R1 and R2 represent the first exon of LOC103403303 and LOC 103431855, respectively; P1 and P2 represent the 2,000-bp fragment upstream of R1 and R2. Predicted TSSs are indicated. B, The miRcand137 precursor transcription and the mature miRcand137 production in N. benthamiana transformed with predicted MIR fragments driven by the 35S promoter. 35SCaMV::GFP was taken as a control. C, The miRcand137 precursor transcription and the mature miRcand137 production in N. benthamiana transformed with predicted MIR fragments under the upstream regulatory sequence. NbActin was used as the loading control for transcripts and U6 for that of sRNA.
Figure 2
Figure 2
miRcand137 regulates apple sensitivity to B. dothidea infection. A, sRNA gel blotting showing the accumulation of mature miRcand137 in M. domestica “Fuji” and M. hupehensis under B. dothidea infection or mock inoculation (distilled water). B, Stem–loop RT-qPCR determining the abundance and changes of mature miRcand137 in “Fuji” and M. hupehensis inoculated with B. dothidea or the mock. C, Secondary structure of precursors for AtMIR319a skeleton and the modified aMIRCAND137. D, Schematic diagram of the TRV vector for miRcand137 overexpression (TRV: aMIRCAND137) and inhibition (TRV: STTMcand137). E, The abundance of miRcand137 in “Gala” of WT, TRV: 00, TRV: aMIRCAND137, and TRV: STTMcand137 determined by sRNA gel blotting. F, Typical leaves of different types of TRV-infiltrated “Gala” infected with B. dothidea. Photos were taken at 24 hpi. Scale bars, 1 cm. G, The percentages of leaves with different grades of disease progression from apple plants infiltrated with different TRV vectors upon B. dothidea infection. H, The calculated pathogen colonization coefficient (biomass ratio of fungus and host as determined by RT-qPCR) of leaves from different TRV-infiltrated “Gala.” Random 20 leaves from three biological replicates were sampled for each type of TRV vector. For the boxplot, centerline, median; box limits, upper and lower quartiles; whiskers, 1.5× interquartile range. Leaves of apple plants were all collected at 24 hpi. U6 was used as an internal control for determining sRNA expression. Data shown in (B) and (G) are means ± sd (n = 3). Asterisks indicate significant differences from the WT or as indicated in the figure. **P ≤ 0.01; *P ≤ 0.05 (Student’s t test).
Figure 3
Figure 3
Differential bases in the miRcand137 foldback affect the processing of mature miRNA. A, The abundance of miRcand137 transcript was determined for “Fuji” and M. hupehensis inoculated with B. dothidea or distilled water (Mock) by northern blotting. EF-1α served as a loading control. B, RT-qPCR determining the transcription level and change of miRcand137 precursor in “Fuji” and M. hupehensis with or without B. dothidea infection. The expression levels were normalized against that of EF-1α. C, Predicted secondary structure of miRcand137 precursors of “Fuji” and M. hupehensis. Base variations at position +4 (T to C), position +46 (A to T), and position +89 (A to G) are indicated by arrows. Shannon’s entropy values calculated by RNAfold reflect the probability of the base-pair states and are color-coded. Positional entropy values (Bits) range from 0 (red) to 1.9 (purple). D, The schematic diagram of miRcand137 precusor. The base mutations in the foldback of MhMIRCAND137 are shown. E, Northern blot assay for mature miRcand137 and its transcript generated in N. benthamiana by MdMIRCAND137 and series of mutated MhMIRCAND137, along with GFP as a negative control. Actin and U6 were shown as a loading control for the transcript and sRNA, respectively. F, The abundance of miRcand137 in N. benthamiana expressing various versions of MIRCAND137 determined by RT-qPCR normalized with U6. Data are shown as means ± sd (n = 3). Asterisks indicate significant differences. **P ≤ 0.01; *P ≤ 0.05 (Student’s t test).
Figure 4
Figure 4
miRcand137 mediates the direct cleavage of ERF14 mRNA. A, The abundance of miRcand137 and ERF14 in “Fuji” and M. hupehensis during B. dothidea infection determined by RT-qPCR normalized by EF-1α and U6, respectively. Lines represent the relative expression level of mature miRcand137 and the bars indicate the transcription level of ERF14. B, 5′-RACE products obtained from the purified mRNA of “Fuji” and M. hupehensis in agarose gel. The band of “a” and “b” indicate two different products derived from different cleavage sites. M, DNA Marker DL2000. C, The structure diagram of ERF14 mRNA. Nucleotide sequences of miRcand137 TS in WT and mutated (m) ERF14 were aligned against miRcand137. D, Schematic diagram of constructs used in the co-expression assay. WT or mutated (m) ERF14 fragments from M. hupehensis or “Fuji” were fused with GUS to generate GUS-(wt or m) ERF14 reporters. Three tandem TSs completely base complementary pairing with miRcand137 were used as the positive control (3×TS), and three mutated TS (mTS) that did not bind with miRcand137 in tandem were used as the negative control. E, Co-expression analysis for miRcand137 and WT (or m) ERF14 fused with GUS reporter. The abundance of the recombinant mRNA and miRcand137 in transiently transformed N. benthamiana were detected by northern blot assay with probe derived from ERF14. NbActin and U6 were used as the loading control. F, Histochemical staining of GUS shows the expression of recombinant GUS in N. benthamiana co-expressing miRcand137. The schematic diagram of constructs are shown in (D). Images of stained leaves were digitally extracted for comparison. Scale bars, 1 cm. G, Quantification of GUS activity in co-transformed N. benthamiana. Different letters indicate significant difference P < 0.05 (one-way ANOVA followed by post hoc Tukey test). All data are shown as means ± sd (n = 3).
Figure 5
Figure 5
The RDR6-dependent siRNA biosynthesis pathway contributed to the miRcand137-mediated silencing of ERF14. A, The schematic diagram of GFP-miRcand137 sensor (GFPcand137). The stop codon of GFP is underlined, and the adaptor is indicated in red. The TS of miRcand137 was aligned with the miRNA. B, The abundance of full-length GFPcand137 mRNA (F-GFPcand137), miRcand137, GFPcand137-derived sRNA in SDE1-silenced N. benthamiana and the TRV: 00 control upon GFPcand137 and miRcand137 co-expression. TRV-infiltrated plants transformed with none (N) or empty vector served as control. The full-length GFPcand137 mRNA was determined by a probe spanning the miRcand137TS. The location of probes for detecting sRNA generated by the miRcand137 cleavage products in LMW RNA are shown. NbActin and U6 was used as the loading control. C, Expression of GFPcand137 in the presence of miRcand137 in TRV-mediated SDE1-silenced N. benthamiana and TRV: 00 control as determined by GFP fluorescence under UV illumination. D, The location of PCR primers for amplifying apple RDR6 fragment used in TRV-VIGS of “Gala” is shown. E, sRNA gel blotting showing the abundance of two apple tasiRNAs derived from ARF and MYB, respectively, along with miRcand137, in TRV: ΔRDR6 (RDR6-silenced) and TRV: 00. U6 served as a loading control. F, 5′-RACE products obtained from the purified mRNA of TRV: ΔRDR6 and TRV: 00 were in agarose gel. The band of “a” and “b” indicate two products of different cleavage sites. M, DNA Marker DL500. G, The transcript levels of RDR6 and ERF14 in TRV: ΔRDR6 and TRV: 00 are determined by RT-qPCR with the normalization with EF-1α. Data are shown as means ± sd (n = 3). Asterisks indicate significant differences. **P ≤ 0.01; *P ≤ 0.05 (Student’s t test).
Figure 6
Figure 6
ERF14 directly regulates the transcription of PR homologs and confers B. dothidea immunity to apple. A, The structure diagram of ERF14 protein. The conserved motif in the APETAL2 (AP2) DNA binding domain was analyzed for ERF14 from apple and various plant species using MEME (http://meme-suite.org/tools/meme). B, EMSA showing the DNA binding affinity of ERF14 to GCC-box and DRE/CRT. ERF14 was tagged with GST and prokaryotic expressed by E. coli strain BL21. Lane 1, free probe; Lane 2, free probe with GST protein; Lanes 3 to 10, recombinant GST-ERF14 protein. For competition assays, the GST-ERF14 protein was incubated with the indicated amount of either the cold DRE/CRT or GCC before the labeled probe being added. Sequence of the oligonucleotides used in the DNA-binding assay is shown. C, Schematic diagram of GCC-box and DRE/CRT cis-elements in the upstream regulatory region of apple PRs. D, Analysis for the activation ability of ERF14 to apple PR promoters by Y1H assay. The combination of p53His2 and pGADT7-Rec2-53 works as a positive control. E, GUS reporter system to test the transcriptional activation ability of ERF14wt and ERF14mut to PR promoters isolated from “Fuji.” The schematic diagrams of the WT and mutated DNA binding site in ERF14wt and ERF14mut proteins are shown. The activity of GUS was quantified by a fluorometric 4-methyl-lumbelliferyl-β-d-glucuronide method. GFP acts as a negative control. Data are shown as means ± sd (n = 3). Different letters labeled significant difference P < 0.05 (one-way ANOVA followed by post hoc Tukey test). F, RT-qPCR determining the transcript abundance of PR genes in WT, TRV: 00, TRV:ΔERF14, TRV: ERF14 and TRV: mERF14 “Gala.” The transcript level was normalized against that of EF-1α. Data are shown as means ± sd (n = 3). Asterisks indicate significant differences. **P ≤ 0.01; (Student’s t test). G, Typical leaves of WT, TRV: 00, TRV:ΔERF14, TRV: ERF14 and TRV: mERF14 “Gala” infected by B. dothidea. Photos were taken at 24 hpi. Images of infected leaves have been digitally extracted for comparison. Scale bars, 1 cm. H, The percentages of leaves with different grades of disease progression from apple plants infiltrated with different TRV vectors upon B. dothidea infection. Data are shown as means ± sd (n = 3). I, Calculated pathogen colonization coefficient of leaves from indicated TRV-infiltrated “Gala.” Random 20 leaves from three biological replicates were sampled for each TRV type. For the boxplot, centerline, median; box limits, upper and lower quartiles; whiskers, 1.5× interquartile range. Asterisks indicate significant differences. **P ≤ 0.01; *P ≤ 0.05 (Student’s t test).
Figure 7
Figure 7
miRcand137 modulates apple immunity against B. dothidea through repressing ERF14-mediated immune response. A, GUS reporter system to test the transcriptional activation ability of ERF14 to the PR1 promoter influenced by co-transformed aMIRCAND137. AtMIR319a and GFP act as the negative control. The activity of GUS was quantified by a fluorometric 4-methyl-lumbelliferyl-β-d-glucuronide method. B, RT-qPCR determining the transcript abundance of PR genes in plants of WT, TRV: 00, TRV: aMIRCAND137, and TRV: STTMcand137. C, Typical leaves of TRV: 00, TRV: ΔERF14, TRV: ERF14, and TRV: mERF14 “Gala” transiently expressing aMIRCAND137 or STTMcand137 infected by B. dothidea. Photos were taken at 24 hpi. Images of infected leaves have been digitally extracted for comparison. Scale bars, 1 cm. D, The percentages of leaves with different disease progression grades from “Gala” infiltrated with different TRV vectors transiently transformed with different constructs under B. dothidea infection. E, The calculated pathogen colonization coefficient of leaves from different TRV-infiltrated “Gala” expressing the indicated constructs. Random 20 leaves from three biological replicates for each TRV type each transient expression vector. F, The percentages of B. dothidea-infected leaves with different disease progression grades from “Fuji” transformed with STTMcand137 and M. hupehensis with aMIRCAND137. G, The relative expression level (in a Log2 scale) of miRcand137 and ERF14 in leaves with different grades from “Fuji” expressing STTMcand137 or M. hupehensis expressing aMIRCAND137. Random 10 leaves for each grade, each transiently transformed apple species were detected. Images of typical leaves for different grades have been digitally extracted and shown below. Scale bars, 1 cm. GFP driven by 35SCaMV was served as a control for transient transformation, and the empty TRV carrying GFP was as that of TRV-infiltration (TRV: 00). U6 and EF-1α were used to normalize the expression level of sRNA and transcripts, respectively. Leaves of apple plants were all collected at 24 hpi. Data shown in the bar and column charts are means ± sd (n = 3). For boxplots, centerline, median; box limits, upper and lower quartiles; whiskers, 1.5× interquartile range. Different letters labeled significantly difference P < 0.05 (one-way ANOVA followed by the post hoc Tukey test). Asterisks indicate significant differences. **P ≤ 0.01; *P ≤ 0.05 (Student’s t test).
Figure 8
Figure 8
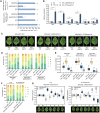
Botryosphaeria dothidea induced MIRCAND137 transcription through cis-elements in the promoter. A, Schematic diagram of pathogen-responsive cis-elements in the upstream regulatory region of MIRCAND137. B, GUS activity quantification for “Gala transiently expressed GUS reporter under the control of the MIRCAND137 promoter treated with B. dothidea mycelium suspension or the mock 12-h posttreatment. 35SCaMV-driven GUS served as a control. C, Time course analysis of transcript levels of GUS under the control of 35SCaMV, MdMIRCAND137pro, or MhMIRCAND137pro in transiently transformed “Gala” with mycelium suspension treatment by RT-qPCR. D, Time course analysis of transcript levels of mature miRcand137, miRcand137 transcript, and miR168 transcript driven by their self-promoter in “Gala” with mycelium suspension treatment by RT-qPCR. E, The schematic diagram of cis-elements deletions for the MIRCAND137 promoter is shown. F, Dual-LUC reporter system to test the transcriptional activation of LUC driven by indicated cis-elements-deleted MIRCAND137 promoter in “Gala” under mycelium suspension or mock treatment. The ratio of measured activities of firefly LUC and REN LUC was calculated as the final transcriptional activity. The 35SCaMV-driven LUC served as a control. G, The Schematic diagram showing the W-box element mutations for the MIRCAND137 promoter. H, The transcriptional activation activity of B. dothidea against LUC under the control of indicated W-box-deleted MIRCAND137 promoter for “Fuji.” The activities of firefly LUC and REN LUC were measured sequentially, and the LUC/REN ratio was calculated as the final transcriptional activity. U6 and EF-1α were used to normalize the expression level of sRNA and transcripts, respectively. All data shown are means ± sd (n = 3). Different letters labeled significantly difference P < 0.05 (one-way ANOVA followed by the post hoc Tukey test). Asterisks indicate significant differences. **P ≤ 0.01; *P ≤ 0.05 (Student’s t test).

Similar articles

Cited by

References

    1. Akagi A, Dandekar AM, Stotz HU (2011) Resistance of Malus domestica fruit to Botrytis cinerea depends on endogenous ethylene biosynthesis. Phytopathology 101: 1311–1321 - PubMed
    1. Allen E, Xie Z, Gustafson AM, Carrington JC (2005) microRNA-directed phasing during trans-acting siRNA biogenesis in plants. Cell 121: 207–221 - PubMed
    1. Axtell MJ, Meyers BC (2018) Revisiting criteria for plant microRNA annotation in the era of big data. Plant Cell 30: 272–284 - PMC - PubMed
    1. Axtell MJ (2008) Evolution of microRNAs and their targets: are all microRNAs biologically relevant? Biochim Biophys Acta 1779: 725–734 - PubMed
    1. Baldrich P, Kakar K, Sire C, Moreno AB, Berger A, García-Chapa M, López-Moya JJ, Riechmann JL, San Segundo B (2014) Small RNA profiling reveals regulation of Arabidopsis miR168 and heterochromatic siRNA415 in response to fungal elicitors. BMC Genom 15: 1–16 - PMC - PubMed

Publication types

Supplementary concepts