. 2022 May 10;119(19):e2121244119.
doi: 10.1073/pnas.2121244119. Epub 2022 May 5.

Autophagy induced by taurolidine protects against polymicrobial sepsis by promoting both host resistance and disease tolerance

Affiliations

Autophagy induced by taurolidine protects against polymicrobial sepsis by promoting both host resistance and disease tolerance

Jie Huang et al. Proc Natl Acad Sci U S A. .

Abstract

Sepsis, septic shock, and their sequelae are the leading causes of death in intensive care units, with limited therapeutic options. Disease resistance and tolerance are two evolutionarily conserved yet distinct defense strategies that protect the host against microbial infection. Here, we report that taurolidine administered at 6 h before septic challenge led to strong protection against polymicrobial sepsis by promoting both host resistance and disease tolerance characterized by accelerated bacterial clearance, ameliorated organ damage, and diminished vascular and gut permeability. Notably, taurolidine administered at 6 h after septic challenge also rescued mice from sepsis-associated lethality by enhancing disease tolerance to tissue and organ injury. Importantly, this in vivo protection afforded by taurolidine depends on an intact autophagy pathway, as taurolidine protected wild-type mice but was unable to rescue autophagy-deficient mice from microbial sepsis. In vitro, taurolidine induced light chain 3-associated phagocytosis in innate phagocytes and autophagy in vascular endothelium and gut epithelium, resulting in augmented bactericidal activity and enhanced cellular tolerance to endotoxin-induced damage in these cells. These results illustrate that taurolidine-induced autophagy augments both host resistance and disease tolerance to bacterial infection, thereby conferring protection against microbial sepsis.

Keywords: autophagy; disease tolerance; host resistance; microbial sepsis.


Conflict of interest statement

The authors declare no competing interest.

Figures

Fig. 1.
Fig. 1.
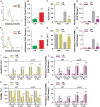
Administration of taurolidine (Tau) protects mice against CLP-induced polymicrobial sepsis with accelerated bacterial clearance. C57BL/6 mice were subjected to CLP-induced high-grade polymicrobial sepsis and treated with Tau at 6 h before CLP (−6 h) or at 6 h after CLP (+6 h). (A) The Kaplan–Meier survival curve shows significantly improved survivals in mice that received Tau at 6 h either before CLP (P = 0.0001) or after CLP (P = 0.0017) compared to mice that received PBS (n = 21 per group). (B and C) Data shown are the results of serum TNF-α and IL-6 levels at 2 and 6 h post-CLP. (D and E) Bacterial counts in the blood and visceral organs including the liver, spleen, and lungs were assessed at 12 and 24 h post-CLP and expressed as log CFU/mL (F and G) Data shown are subpopulations (%) of macrophages (CD11b+F4/80+CD11clo) and PMNs (CD11b+F4/80Gr1hi) in the peritoneal lavage collected at 0, 6, and 12 h post-CLP. Data in B to G are mean ± SD (n = 4 to 6 mice per group for each time point). *P < 0.05, **P < 0.01 versus PBS-treated mice.
Fig. 2.
Fig. 2.
Tau-afforded protection against microbial sepsis is associated with reduced organ damage and attenuated vascular and gut permeability. C57/BL6 mice were subjected to CLP-induced high-grade polymicrobial sepsis and treated with Tau at 6 h before CLP (−6 h) or at 6 h after CLP (+6 h). Mice subjected to sham-CLP were used as the control (Con). (A and B) Serum LDH, CK, ALT, and urea levels were assessed at 18 and 36 h post-CLP to reflect sepsis-induced tissue and organ injury. (C and D) Blood vascular permeability in the lungs, liver, and kidneys was assessed at 12 and 24 h post-CLP and expressed as nanograms of dye/milligram tissue. (E and F) Gut permeability was assessed at 12 and 24 h post-CLP and expressed as the fold change. Data are mean ± SD (n = 4 to 6 mice per group for each time point). *P < 0.05, **P < 0.01 versus PBS-treated mice.
Fig. 3.
Fig. 3.
Autophagy-deficient mice are susceptible to CLP-induced polymicrobial sepsis with impaired capacities in both host resistance and disease tolerance. Wild-type (WT) and LC3b−/− mice were subjected to CLP-induced midgrade polymicrobial sepsis. (A) The Kaplan–Meier survival curve shows that LC3b−/− mice were more vulnerable to microbial sepsis than their WT littermates (P = 0.0463) (n = 21 per group). (B) Data shown are the results of serum TNF-α and IL-6 levels at 2 and 6 h post-CLP. (C) Bacterial counts in the blood, liver, spleen, and lungs were assessed at 12 h post-CLP and expressed as log CFU/mL (D) Data shown are subpopulations (%) of macrophages (CD11b+F4/80+CD11clo) and PMNs (CD11b+F4/80Gr1hi) in the peritoneal lavage collected at 0, 6, and 12 h post-CLP. (E) Serum LDH, CK, ALT, and urea levels were assessed at 18 h post-CLP to reflect sepsis-induced tissue and organ injury. (F) Blood vascular permeability in the lungs, liver, and kidneys was assessed at 12 h post-CLP and expressed as nanograms of dye/milligram of tissue. (G) Gut permeability was assessed at 12 h post-CLP and expressed as fold change. Data in B to G are mean ± SD (n = 4 to 6 mice per group for each time point). *P < 0.05 versus CLP-challenged WT mice.
Fig. 4.
Fig. 4.
Tau-afforded protection against microbial sepsis depends on an intact autophagy pathway. WT and LC3b−/− mice were subjected to CLP-induced midgrade polymicrobial sepsis and treated with Tau at 6 h before CLP. Mice subjected to sham-CLP were used as the Con. (A and B) The Kaplan–Meier survival curves show that administration of Tau confers a 100% protection in WT mice (P = 0.0042) but fails to protect LC3b−/− mice from sepsis-associated lethality (P = 0.5921) (n = 21 per group). (C and D) Bacterial counts in the blood, liver, spleen, and lungs were assessed at 12 h post-CLP and expressed as log CFU/mL. (E and F) Serum LDH, CK, ALT, and urea levels were assessed at 18 h post-CLP to reflect sepsis-induced tissue and organ injury. (G and H) Blood vascular permeability in the lungs, liver, and kidneys was assessed at 12 h post-CLP and expressed as nanograms of dye/milligram of tissue. (I and J) Gut permeability was assessed at 12 h post-CLP and expressed as the fold change. Data in CJ are mean ± SD (n = 4 to 6 mice per group). *P < 0.05, **P < 0.01 versus PBS-treated WT or LC3b−/− mice.
Fig. 5.
Fig. 5.
Tau-induced autophagy in innate phagocytes enhances their resistance capacity with augmented bactericidal activity. (AD) Isolated macrophages were treated with CM or Tau (50 µM) for 12 h to induce autophagy (A and B) and further challenged with FITC-conjugated or live S. aureus and S. typhimurium to assess bacterial phagocytosis (C) and intracellular killing (D). (E and F) Macrophages isolated from WT and LC3b−/− mice were incubated with PBS or 3-MA (5.0 mM) for 2 h, then treated with CM or Tau for 12 h, and further challenged with FITC-conjugated or live S. aureus and S. typhimurium to assess bacterial phagocytosis (E) and intracellular killing (F). (G and H) WT and LC3b−/− mice were subjected to CLP-induced polymicrobial sepsis and treated with PBS or Tau at 6 h before CLP. Peritoneal macrophages isolated at 0, 3, and 6 h post-CLP were further challenged with FITC-conjugated or live S. aureus and S. typhimurium to assess bacterial phagocytosis (G) and intracellular killing (H). Autophagy induction and bacterial phagocytosis were expressed as the fold change and mean channel fluorescence (MCF) per cell, respectively. Data in B to H are mean ± SD (n = 4 to 6 in duplicate or in triplicate). *P < 0.05, **P < 0.01 versus PBS-incubated, CM-treated WT macrophages or macrophages isolated from PBS-treated WT mice; P < 0.05, ≠≠P < 0.01 versus PBS-incubated, Tau-treated WT macrophages or macrophages isolated from Tau-treated WT mice.
Fig. 6.
Fig. 6.
Tau-initiated LAP in innate phagocytes is critically required for an augmented bactericidal activity. (AC) Isolated BMMs were treated with CM or Tau (50 µM) for 12 h and further challenged with FITC-conjugated S. aureus and E. coli or live E. coli for 60 min. The recruitment of LC3 to FITC-S. aureus- or FITC-E. coli-containing phagosomes was detected after incubation with anti-LC3 antibody (A) and expressed as the percentage of LC3+ phagosomes (B). Phagosomes were purified from CM-treated or Tau-treated, live E. coli-challenged BMMs and analyzed by immunoblotting (C). Data in B are mean ± SD. **P < 0.01 versus CM-treated macrophages. (D and E) Isolated macrophages were transfected with siRubicon, siUlk1, or their scrRNA for 48 h and then treated with CM or Tau for 12 h (D), while macrophages isolated from WT and Nox2−/− mice were incubated with PBS or DPI (10 μM) for 2 h and then treated with CM or Tau for 12 h (E). All these cells were further challenged with live S. aureus and S. typhimurium for 2 h to assess intracellular killing. Data in D and E are mean ± SD (n = 4 to 6 in triplicate). **P < 0.01 versus scrRNA-transfected, Tau-treated WT macrophages or Tau-treated WT macrophages; P < 0.05, ≠≠P < 0.01 versus Tau-treated WT macrophages in the absence of DPI.
Fig. 7.
Fig. 7.
Tau-induced autophagy attenuates LPS-induced cellular damage in vascular endothelium and gut epithelium by boosting their disease tolerance capacity. (AH) Isolated primary PECs and IECs were treated with CM or Tau (50 µM) for 12 h to induce autophagy (A, B, E, and F), and further challenged with PBS or LPS (1.0 or 2.0 µg/mL) for 24 h to assess PEC apoptosis (C), IEC viability (G), and endothelial (D) or epithelial (H) monolayer permeability. (IL) Primary PECs and IECs isolated from WT and LC3b−/− mice were incubated with PBS or 3-MA (5.0 mM) for 2 h, then treated with CM or Tau (50 µM) for 12 h, and further challenged with PBS or LPS (1.0 or 2.0 µg/mL) for 24 h to assess PEC apoptosis (I), IEC viability (K), and endothelial (J) or epithelial (L) monolayer permeability. Autophagy induction and endothelial or epithelial monolayer permeability were expressed as the fold change. Data in BD, FH, and IL are mean ± SD (n = 4 to 6 in duplicate or in triplicate). **P < 0.01 versus PBS-incubated, CM-treated WT PECs or IECs; ≠≠P < 0.01 versus PBS-incubated, Tau-treated WT PECs or IECs.

Similar articles

Cited by

References

    1. Singer M., et al. , The third international consensus definitions for sepsis and septic shock (Sepsis-3). JAMA 315, 801–810 (2016). - PMC - PubMed
    1. Angus D. C., van der Poll T., Severe sepsis and septic shock. N. Engl. J. Med. 369, 840–851 (2013). - PubMed
    1. Nguyen H. B., Smith D., Sepsis in the 21st century: Recent definitions and therapeutic advances. Am. J. Emerg. Med. 25, 564–571 (2007). - PubMed
    1. Hotchkiss R. S., Karl I. E., The pathophysiology and treatment of sepsis. N. Engl. J. Med. 348, 138–150 (2003). - PubMed
    1. Martin G. S., Mannino D. M., Eaton S., Moss M., The epidemiology of sepsis in the United States from 1979 through 2000. N. Engl. J. Med. 348, 1546–1554 (2003). - PubMed

Publication types

LinkOut - more resources