. 2022 Aug 4;140(5):504-515.
doi: 10.1182/blood.2022015601.

Risk assessment with low-pass whole-genome sequencing of cell-free DNA before CD19 CAR T-cell therapy for large B-cell lymphoma

Affiliations

Risk assessment with low-pass whole-genome sequencing of cell-free DNA before CD19 CAR T-cell therapy for large B-cell lymphoma

Hua-Jay J Cherng et al. Blood. .

Abstract

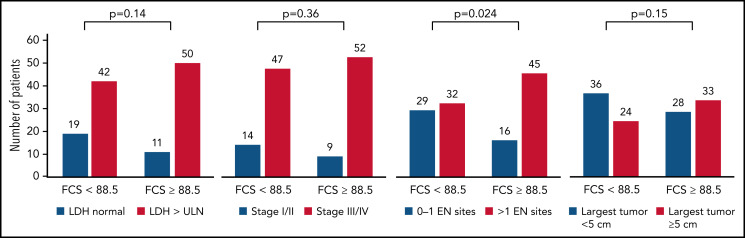
Patients with relapsed or refractory large B-cell lymphomas (rrLBCL) can achieve long-term remission after CD19 chimeric antigen receptor T-cell therapy (CART19). However, more than half of recipients will experience treatment failure. Thus, approaches are needed to identify high-risk patients who may benefit from alternative or consolidative therapy. We evaluated low-pass whole-genome sequencing (lpWGS) of cell-free DNA (cfDNA) before CART19 as a new approach for risk stratification. We performed lpWGS on pretreatment plasma samples from 122 patients at time of leukapheresis who received standard-of-care CART19 for rrLBCL to define DNA copy number alterations (CNAs). In multivariable selection, high focal CNA score (FCS) denoting genomic instability was the most significant pretreatment variable associated with inferior 3-month complete response rates (28% vs 56%, P = .0029), progression-free survival (PFS; P = .0007; hazard ratio, 2.11), and overall survival (OS; P = .0026; hazard ratio, 2.10). We identified 34 unique focal CNAs in 108 (89%) patients; of these, deletion 10q23.3 leading to loss of FAS death receptor was the most highly associated with poor outcomes, leading to inferior PFS (P < .0001; hazard ratio, 3.49) and OS (P = .0027; hazard ratio, 2.68). By combining FCS with traditional markers of increased tumor bulk (elevated lactate dehydrogenase and >1 extranodal site), we built a simple risk model that could reliably risk stratify patients. Thus, lpWGS of cfDNA is a minimally invasive assay that could rapidly identify high-risk patients and may guide patient selection for and targeted therapies to evaluate in future clinical trials.


Figures

None
Graphical abstract
Figure 1.
Figure 1.
Patient flow diagram. lpWGS was successfully performed on 131 of 135 (97%) plasma samples drawn from patients at time of leukapheresis. Nine patients subsequently died before CART19 infusion, leaving an evaluable cohort of 122 patients that were dichotomized by the median focal copy number alteration burden score of 88.5.
Figure 2.
Figure 2.
Focal copy number alteration burden score (FCS) and 3-month response rates after CART19. (A) Genome-wide copy number alteration profiles from lpWGS of cfDNA of 4 patients with FCS values from each quartile (A, blue = first quartile, red = second quartile, green = third quartile, purple = fourth quartile). Broad copy number alteration burden scores (BCSs) are also included. (B-C) Box plots comparing distribution of (B) FCS and (C) BCS in patients with complete response (blue) or without complete response (red) at the 3-month post-CART19 evaluation demonstrate that FCS and BCS were significantly higher in patients without 3-month complete response.
Figure 3.
Figure 3.
High FCS is associated with poor survival outcomes after CART19. Kaplan-Meier plots of PFS (A) and OS (B) stratified by FCS of 88.5 (median value) demonstrating that survival was significantly shorter in patients with “high” (>88.5) FCS. Median survival times are delineated by dashed lines.
Figure 4.
Figure 4.
Unique copy number alterations identified from lpWGS are associated with post-CART19 outcomes. (A) GISTIC analysis of copy number alteration profiles of 122 patients identified 11 peaks of DNA copy gain (red) and 23 peaks of DNA copy loss (blue). The green line denotes the significance threshold of q-value = 0.25. The number of patients harboring each lesion from the set of 108 patients included in the outcome analysis is shown. Hazard ratios with 95% confidence intervals from univariate Cox regression analysis of the association are shown for each CNA and PFS for the 108 patients with detected copy number alterations. False discovery rate (FDR) values after Bonferroni correction of Cox regression analysis. The dashed line denotes the significant threshold of FDR = 0.1. The 3 copy number alterations significantly associated with PFS (in order of increasing FDR value) were deletion 10q23.31, deletion 11q25, and deletion 14q32.2. (B-C) Kaplan Meier plots of PFS (B) and OS (C) stratified by presence or absence of deletion 10q23.31 as detected by GISTIC demonstrate that the patients with deletion 10q23.31 (n = 12, 11%) experienced significantly worse PFS and OS compared with those without 10q23.31 deletions (n = 96, 89%).
Figure 5.
Figure 5.
Association between FCS and markers of increased tumor burden. Bar plots depicting the association between elevated FCS (using cutoff of 88.5, median) with markers of elevated tumor burden including elevated LDH, advanced disease stage, >1 EN site of disease, and bulky disease by radiography (at least 5 cm or greater in diameter). P values depicted are from Fisher’s exact test. High FCS was only statistically associated with higher prevalence of >1 EN sites of disease.
Figure 6.
Figure 6.
Simple risk model incorporating FCS from lpWGS. (A) Sankey plot depicting the distribution of low-risk (green), intermediate-risk (blue), and high-risk (red) patients by the 3 variables of the risk model (FCS, LDH, and EN sites). (B-C) Kaplain-Meier plots of PFS (B) and OS (C) of patients divided into the 3 risk groups. Median PFS was not reached, 6.7 months, and 1.9 months with 1-year progression free survival rates of 73%, 43%, and 4% for low- to high-risk patients, respectively. Median OS was not reached, 20.3 months, and 5.0 months with 1-year overall survival rates of 80%, 70%, and 16% for low- to high-risk patients, respectively.

Comment in

References

    1. Crump M, Neelapu SS, Farooq U, et al. . Outcomes in refractory diffuse large B-cell lymphoma: results from the international SCHOLAR-1 study. Blood. 2017;130(16):1800-1808. - PMC - PubMed
    1. Neelapu SS, Locke FL, Bartlett NL, et al. . Comparison of 2-year outcomes with CAR T cells (ZUMA-1) vs salvage chemotherapy in refractory large B-cell lymphoma. Blood Adv. 2021;5(20):4149-4155. - PMC - PubMed
    1. Neelapu SS, Locke FL, Bartlett NL, et al. . Axicabtagene ciloleucel CAR T-cell therapy in refractory large B-cell lymphoma. N Engl J Med. 2017;377(26):2531-2544. - PMC - PubMed
    1. Schuster SJ, Bishop MR, Tam CS, et al. ; JULIET Investigators . Tisagenlecleucel in adult relapsed or refractory diffuse large B-cell lymphoma. N Engl J Med. 2019; 380(1):45-56. - PubMed
    1. Abramson JS, Palomba ML, Gordon LI, et al. . Lisocabtagene maraleucel for patients with relapsed or refractory large B-cell lymphomas (TRANSCEND NHL 001): a multicentre seamless design study. Lancet. 2020; 396(10254):839-852. - PubMed

Publication types