. 2022 May 3;39(5):msac094.
doi: 10.1093/molbev/msac094.

Genomic Impact of Whaling in North Atlantic Fin Whales

Affiliations

Genomic Impact of Whaling in North Atlantic Fin Whales

Magnus Wolf et al. Mol Biol Evol. .

Abstract

It is generally recognized that large-scale whaling in the 19th and 20th century led to a substantial reduction of the size of many cetacean populations, particularly those of the baleen whales (Mysticeti). The impact of these operations on genomic diversity of one of the most hunted whales, the fin whale (Balaenoptera physalus), has remained largely unaddressed because of the paucity of adequate samples and the limitation of applicable techniques. Here, we have examined the effect of whaling on the North Atlantic fin whale based on genomes of 51 individuals from Icelandic waters, representing three temporally separated intervals, 1989, 2009 and 2018 and provide a reference genome for the species. Demographic models suggest a noticeable drop of the effective population size of the North Atlantic fin whale around a century ago. The present results suggest that the genome-wide heterozygosity is not markedly reduced and has remained comparable with other baleen whale species. Similarly, there are no signs of apparent inbreeding, as measured by the proportion of long runs of homozygosity, or of a distinctively increased mutational load, as measured by the amount of putative deleterious mutations. Compared with other baleen whales, the North Atlantic fin whale appears to be less affected by anthropogenic influences than other whales such as the North Atlantic right whale, consistent with the presence of long runs of homozygosity and higher levels of mutational load in an otherwise more heterozygous genome. Thus, genome-wide assessments of other species and populations are essential for future, more specific, conservation efforts.

Keywords: bottleneck; demography; fin whales; genetic diversity; mutational load; runs of homozygosity; whaling.


Figures

Fig. 1.
Fig. 1.
Changes in Ne over the last 800 years for all analyzed fin whales combined (total, gray), or for the three fin whale cohorts 1989 (F89, red), 2009 (F09, blue) and 2018 (F18, green) separately, estimated by stairway  plot v2 (Liu and Fu 2020). Plots were scaled using a mutation rate of 1.54 × 10−9 per site per generation and a generation time of 25.9 years. All models show a wide variety of signals, including a steep reduction in Ne around 100–150 years ago (upper 2.5% confidence interval) or only a minor gradual decline over the past 800 years (lower 2.5% confidence interval). A bottleneck pattern is more prominent in the 1989 cohort, whereas a declining pattern is more prominent in the more recent cohorts.
Fig. 2.
Fig. 2.
Genome-wide heterozygosity, (y-axis) in percent of heterozygous sides in the SNP and SNV data sets, respectively. (A) Heterozygosity within the baleen whale SNV data set using the bowhead whales as a reference. Fin whales show a moderate heterozygosity of around 0.07%. The blue whale and North Atlantic right whale individuals had a higher He (0.11% and 0.15%), whereas sei, gray, and humpback whales were less heterozygous (0.05%, 0.03%, and 0.05%). (B) Box plot of the He distribution between three fin whale cohorts sampled in 1989 (red), 2009 (blue), and 2018 (green), respectively. A slight increase in He over the three cohorts was observed, with individuals sampled in 2018 differing significantly (P = 0.0051) from the 1989 and 2009 cohorts.
Fig. 3.
Fig. 3.
Inbreeding factors (FROH) based on the genome coverage of run of homozygosity (ROH) between different minimal lengths cutoffs of ROH: 100 kbp to 1 Mbp (x-axis in 100 kbp steps). (A) Comparison of FROH among genomes of different baleen whale species and the 51 fin whales. While sei, gray and humpback whale have similar patterns of gradually decreasing inbreeding coefficients in their ROH length bins from 0.6% to <0.1%, varying patterns of high FROH (∼0.2–0.4%) in the >1 Mbp bin and low FROH (<0.1–0.2%) in the 100 kbp bin were found in the genomes of blue and North Atlantic right whale indicating more recent inbreeding events. The fin whale population shows an overall similar pattern to the sei, gray and humpback whale but with potentially higher inbreeding coefficients on the >1 Mbp length bin in some of the individuals (∼0.2%). (B) Comparison of FROH between the three different fin whale cohorts 1989 (red), 2009 (blue), and 2018 (green). We found four outlier individuals with higher or lower inbreeding coefficients and a significantly higher amount of long >1 Mbp ROH (FROH up to 0.6%) in the 1989 cohort. In the other two cohorts, only the same gradually decreasing pattern of inbreeding coefficients was identified.
Fig. 4.
Fig. 4.
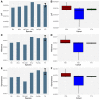
Abundances of three categories of functional mutations (LoF, missense and synonymous), measured as their relative proportion compared with the total number of SNPs or SNVs, respectively. Within the baleen whale data set (A, C and E), fin whales show a relatively high abundance of mutations in every category. By contrast, the North Atlantic right whale has a comparable high number of LoF mutations relative to the respective abundances of missense and synonymous mutations. No significant differences were found in the 51 fin whale genomes between the three sampling years 1989 (red), 2009 (blue), and 2018 (green) (B, D, and F). Fin whales from 1989 always have the most mutations in every category while whales from 2009 always have the least number of mutations. The overall variation in the 2018 cohort was, in general, lower compared with the other two cohorts. Yet, all cohorts had a similar medium number of mutations in every category.
Fig. 5.
Fig. 5.
Cross correlation analysis between genome-wide heterozygosity, inbreeding and mutational load showing the potential correlations between heterozygosity and FROH as well as FH (A and B) and between the relative frequency of LoF mutations (C and E) or total number of LoF mutations (D and F) against heterozygosity or FROH. We identified a lack of correlations between nearly all parameters. Only heterozygosity and FROH have a non-significant negative trend towards each other as indicated by a R = −0.81 and P = 0.053. Neither the relative frequency nor the total number of LoF mutations showed any such trends.
Fig. 6.
Fig. 6.
Population structure analyses of fin whales sampled in Icelandic waters in 1989 (red), 2009 (blue), and 2018 (green), respectively. (A) PCoA identified only one major fin whale population. (B) The admixture-like analysis (colors indicate clusters inferred by the algorithm) resulted in no clear structure, indicating free exchange of genetic material in this population over all three cohorts.

References

    1. Aguilar A, García-Vernet R. 2017. Fin Whale: Balaenoptera physalus. In: Würsig BG, Thewissen JGM, Kovacs KM, editors. Encyclopedia of marine mammals. Amsterdam: Academic Press.
    1. Archer FI, Brownell RL Jr, Hancock-Hanser BL, Morin PA, Robertson KM, Sherman KK, Calambokidis J, Urbán RJ, Rosel PE, Mizroch SA, et al. 2019. Revision of fin whale Balaenoptera physalus (Linnaeus, 1758) subspecies using genetics. Journal of Mammalogy. 100(5):1653–1670.
    1. Árnason Ú. 1981. Fin whales in the NE Atlantic; relationships between abundance and distribution. Ecography. 4(4):245–251.
    1. Árnason Ú, Lammers F, Kumar V, Nilsson MA, Janke A. 2018. Whole-genome sequencing of the blue whale and other rorquals finds signatures for introgressive gene flow. Sci Adv. 4(4):eaap9873. - PMC - PubMed
    1. Bérubé M, Aguilar A, Dendanto D, Larsen F, Di Notarbartolo Sciara G, Sears R, Sigurjónsson J, Urban-R J, Palsbøll PJ. 1998. Population genetic structure of North Atlantic, Mediterranean Sea and Sea of Cortez fin whales, Balaenoptera physalus (Linnaeus 1758). Analysis of mitochondrial and nuclear loci. Mol Ecol. 7(5):585–599. - PubMed

Publication types