. 2022 Sep 3;73(15):5306-5321.
doi: 10.1093/jxb/erac184.

N-dependent dynamics of root growth and nitrate and ammonium uptake are altered by the bacterium Herbaspirillum seropedicae in the cereal model Brachypodium distachyon

Affiliations

N-dependent dynamics of root growth and nitrate and ammonium uptake are altered by the bacterium Herbaspirillum seropedicae in the cereal model Brachypodium distachyon

Weiqi Kuang et al. J Exp Bot. .

Abstract

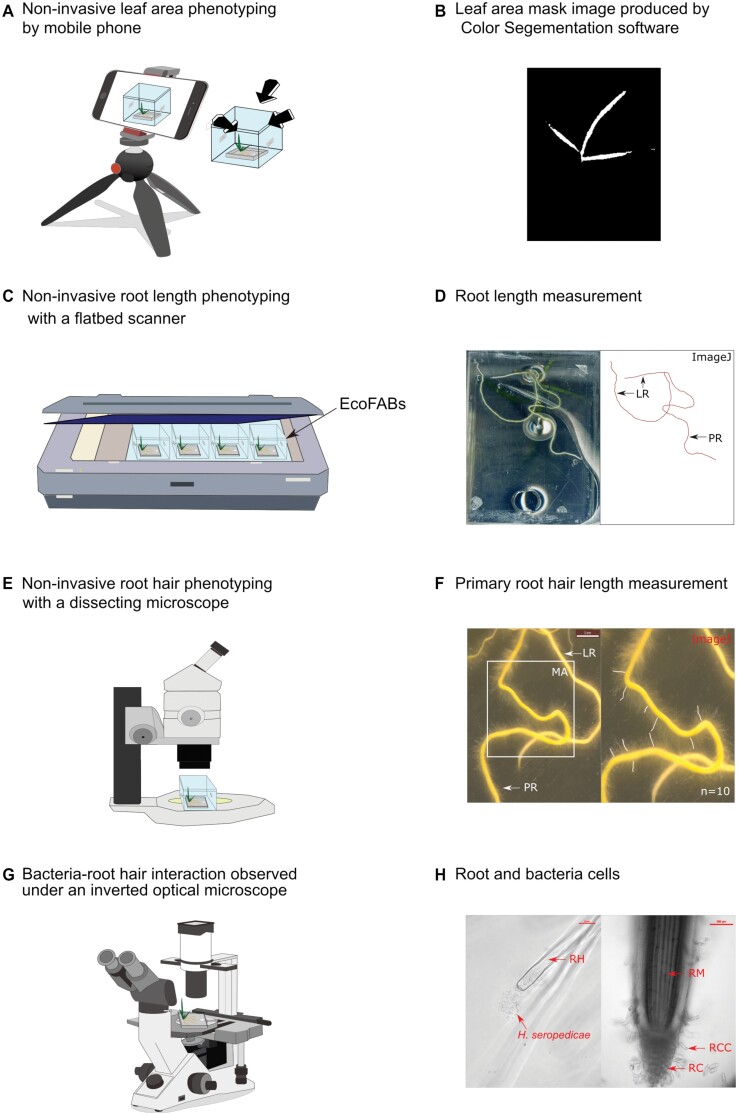
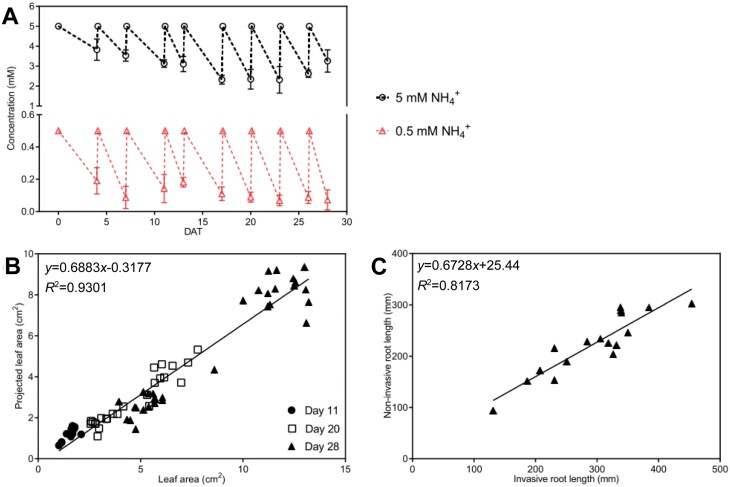
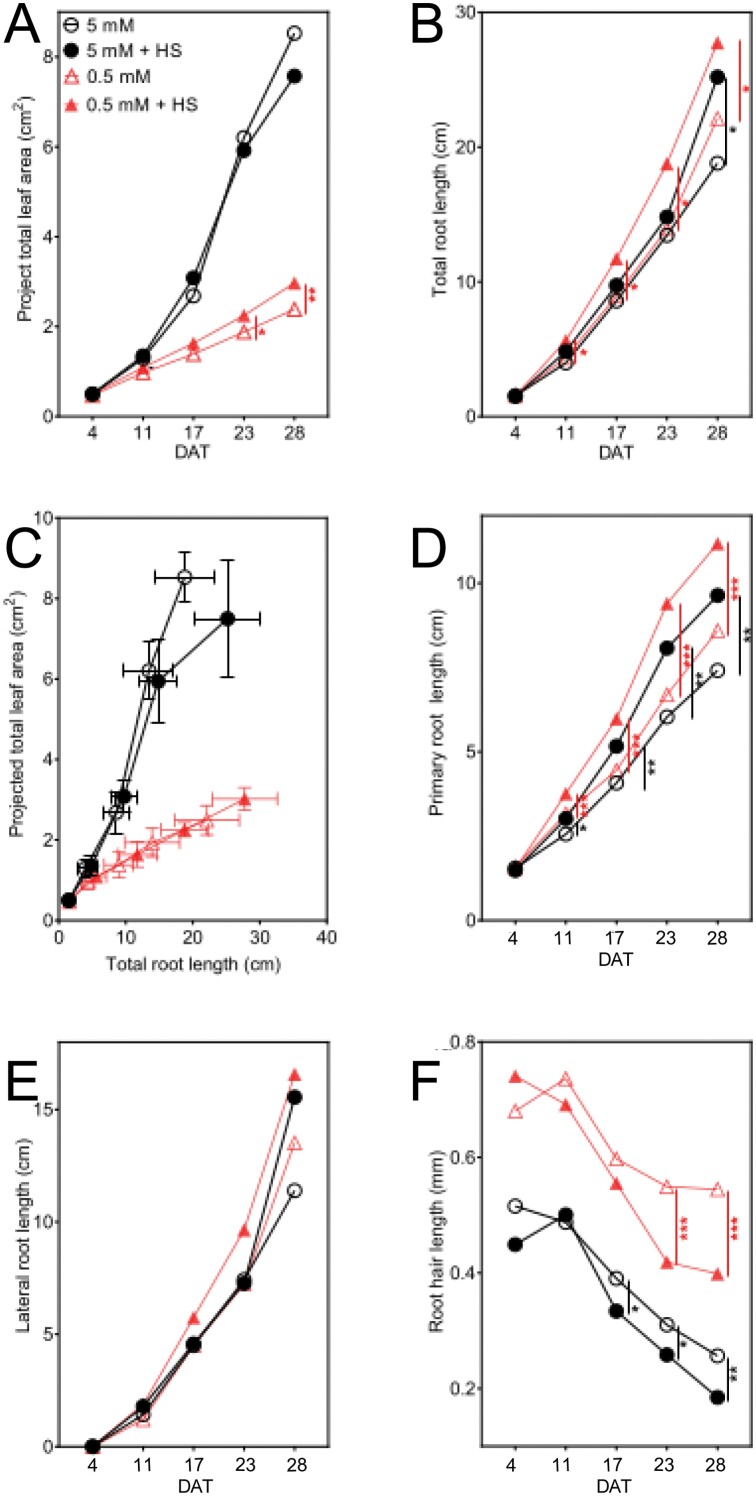
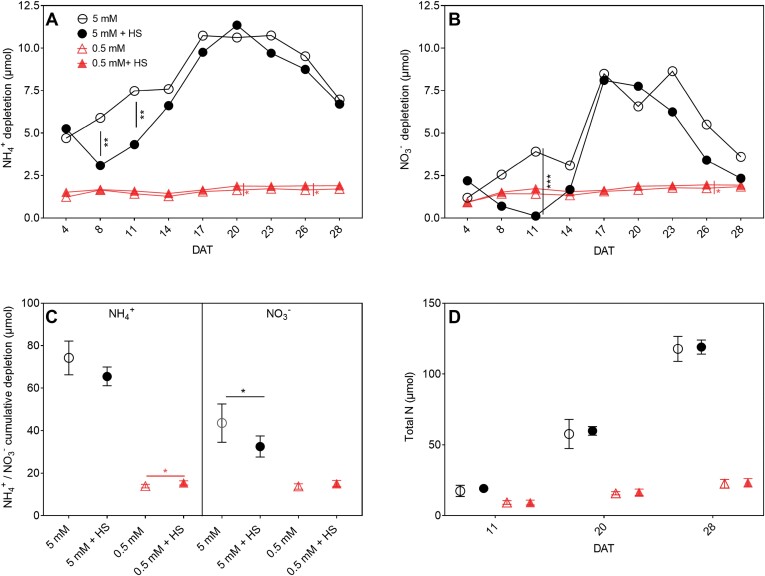
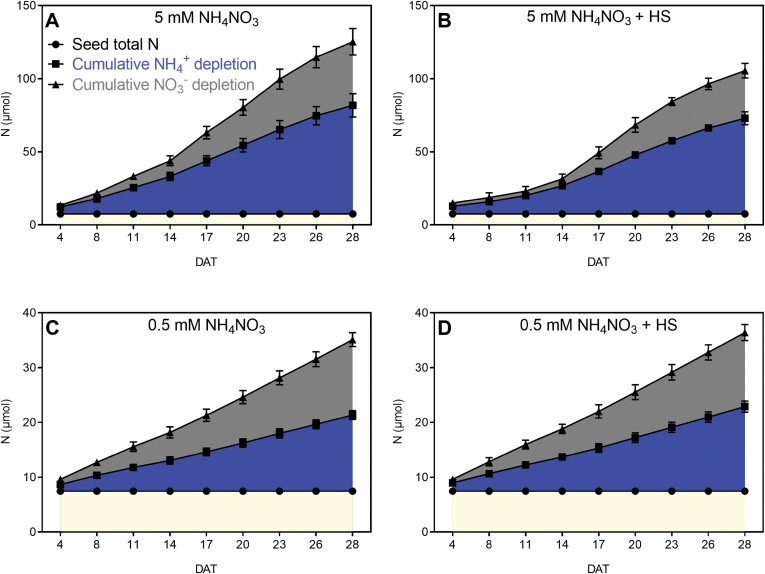
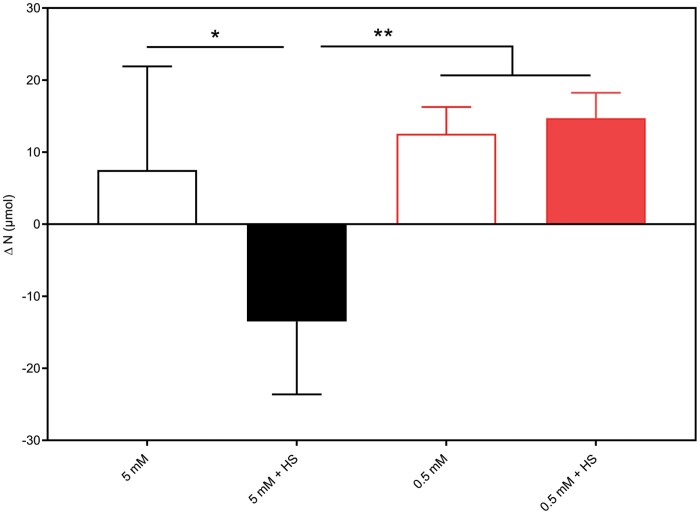
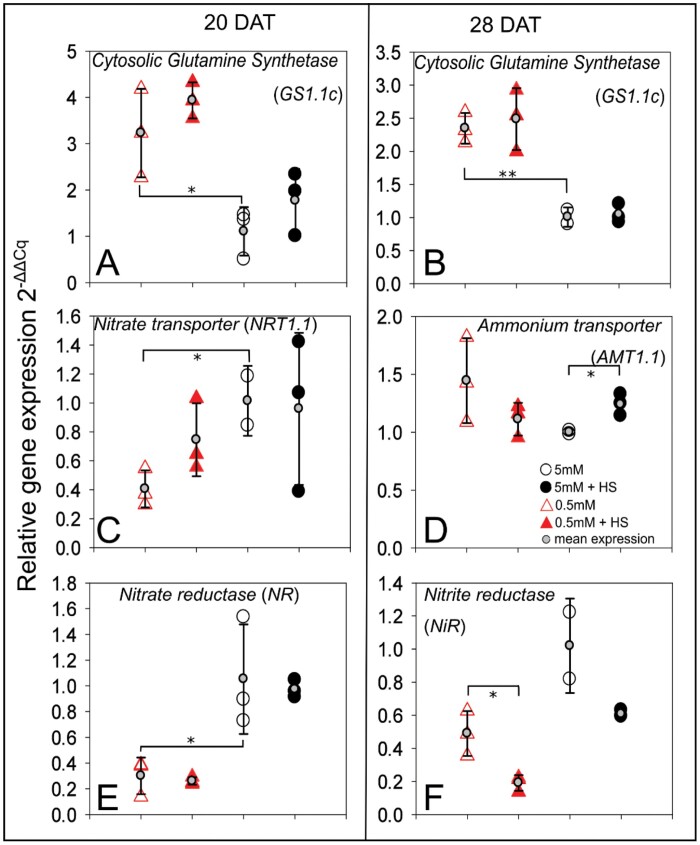
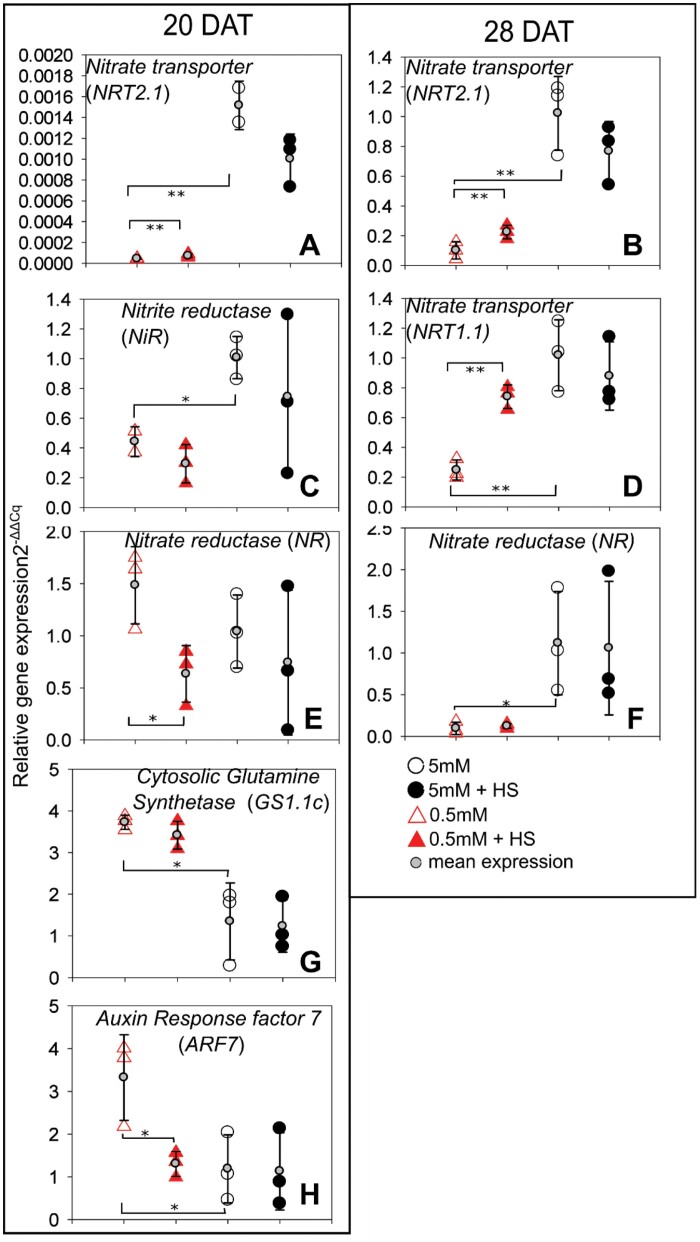
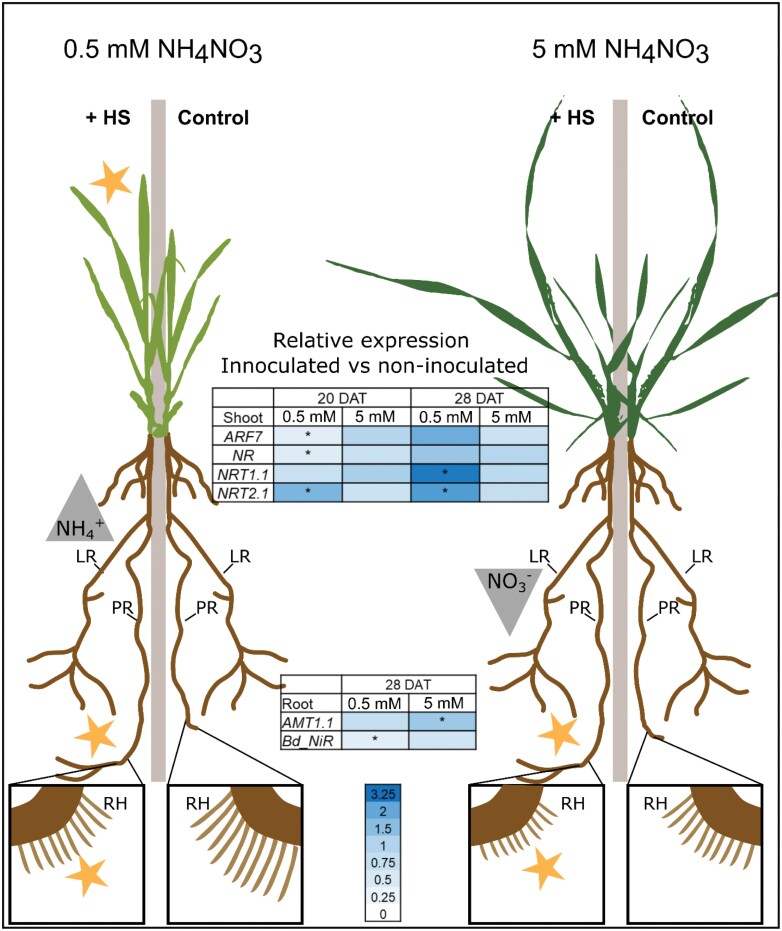
Nitrogen (N) fixation in cereals by root-associated bacteria is a promising solution for reducing use of chemical N fertilizers in agriculture. However, plant and bacterial responses are unpredictable across environments. We hypothesized that cereal responses to N-fixing bacteria are dynamic, depending on N supply and time. To quantify the dynamics, a gnotobiotic, fabricated ecosystem (EcoFAB) was adapted to analyse N mass balance, to image shoot and root growth, and to measure gene expression of Brachypodium distachyon inoculated with the N-fixing bacterium Herbaspirillum seropedicae. Phenotyping throughput of EcoFAB-N was 25-30 plants h-1 with open software and imaging systems. Herbaspirillum seropedicae inoculation of B. distachyon shifted root and shoot growth, nitrate versus ammonium uptake, and gene expression with time; directions and magnitude depended on N availability. Primary roots were longer and root hairs shorter regardless of N, with stronger changes at low N. At higher N, H. seropedicae provided 11% of the total plant N that came from sources other than the seed or the nutrient solution. The time-resolved phenotypic and molecular data point to distinct modes of action: at 5 mM NH4NO3 the benefit appears through N fixation, while at 0.5 mM NH4NO3 the mechanism appears to be plant physiological, with H. seropedicae promoting uptake of N from the root medium.Future work could fine-tune plant and root-associated microorganisms to growth and nutrient dynamics.

Keywords: Brachypodium; Herbaspirillum seropedicae; Agriculture; EcoFAB; N fixation; cereals; crop productivity; nitrogen; non-invasive phenotyping; plant-growth promoting rhizobacteria; wheat.


Figures

Fig. 1.
Fig. 1.
Non-invasive approaches to phenotyping shoots and roots of B. distachyon growing in EcoFABs. (A) Shoot images (leaves) were taken with a mobile phone using Plant Screen Mobile software (Müller-Linow et al., 2019) over time. The EcoFAB-N was positioned at three angles around the mobile phone on the clean bench. (B) Images from (A) were transferred to computer and binarized from a masked image generated by Color Segmentation software (Müller-Linow et al., 2015); the resulting project leaf area data in pixels were calibrated and converted to units of cm2 using Eqs 1, 2 (see ‘Material and methods’). (C) Root length and type were obtained from images of multiple EcoFABs positioned directly on a glass, back-lit flatbed scanner. (D) Root system images were analysed with the ImageJ software for primary roots (PR) and lateral roots (LR) total length manually. (E) Root hairs were observed and images were taken with a dissecting microscope. (F) Hairs on primary root were measured between the root outer edge and the tips of hairs from the measurement area (MA): 1–4 mm (4 DAT), 2–8 mm (11 DAT), 2–10 mm (17 DAT), and 4–15 mm (23 and 28 DAT), using ImageJ software manually, n=10 hairs per root. (G) Cellular level imaging was done on EcoFABs mounted on an optical inverted microscope. (H) Herbaspirillum seropedicae associated with a B. distachyon root hair (RH, left), and root cap cells (RCC) around a root cap (RC, right) were observed through the bases of the EcoFABs.
Fig. 2.
Fig. 2.
Verification of B. distachyon non-invasive shoot and root phenotyping and nitrogen supply in EcoFAB-N. (A) Ammonium depletion and replenishment in EcoFAB-N medium. Brachypodium distachyon were grown in revised 0.5 MS medium with 5 mM NH4NO3 (5 mM NH4+) or 0.5 mM NH4NO3 (0.5 mM NH4+). Medium was changed regularly starting from 4 DAT, until harvest at 28 DAT. Ammonium concentration was measured by continuous flow analysis (n=5). (B) Correlation between non-invasive leaf area measured (Fig. 1A, B) and invasive leaf area measured by leaf area meter Li 3100 at 11, 20, and 28 DAT (n=12, 24, and 32 respectively). (C) Correlation between non-invasive total root length imaged by flatbed scanner and analysed by ImageJ (Fig. 1C, D), and invasive total root length imaged by flatbed scanner and measured by WinRHIZO software, at 28 DAT (n=17). Data (A) are means ±standard error. DAT, days after transplanting to EcoFAB-N.
Fig. 3.
Fig. 3.
Growth of B. distachyon measured non-destructively over time at 4, 11, 17, 23, and 28 DAT when roots exposed to 5 mM NH4NO3 or 0.5 mM NH4NO3, with or without H. seropedicae (HS), in EcoFAB-N chambers in Fig. 1. (A) Projected leaf area over time measured using a digital camera and software (Fig. 1A, B). (B) Total root length over time measured using a flatbed scanner and software (Fig. 1C, D). (C) Projected leaf area from (A) plotted against total root length from (B) of whole plants over time. (D) Length of primary axile roots (measured as shown in Fig. 1C, D). (E) Length of lateral roots (total root length − primary axile root total length). (F) Root hair length on primary axile roots (measured as shown in Fig. 1E, F.) All data points are means ±standard error (n=10). Asterisks indicate statistically significant differences by unpaired t-test: *P<0.05, **P<0.01, ***P<0.001. Solid symbols refer to plants with bacteria treatment; black symbols indicate high N supply; red symbols indicate low N. Bacterial effects are shown with lines (5 mM versus 5 mM+HS, black line; and 0.5 mM versus 0.5 mM+HS, red line); for other comparisons see Supplementary Table S2; n=10, except 5 mM where n=9. DAT, days after transplanting to EcoFAB-N.
Fig. 4.
Fig. 4.
Nitrogen (NH4+, NO3) depletion from EcoFAB-N medium over time and total N in B. distachyon grown in medium with 5 mM or 0.5 mM NH4NO3 and with or without root-associated bacteria of H. seropedicae (HS). (A) NH4+ depletion in EcoFAB medium was calculated as (initial medium NH4+ concentration at filling – final collected medium NH4+ concentration) × medium volume over time. NH4+ concentration was measured by continuous flow analysis and medium volume was measured by pipette. (B) NO3 depletion was calculated as (initial medium NO3 concentration at filling – final collected medium NO3 concentration) × medium volume. NO3 concentration were measured by ion chromatography and medium volume was measured by pipette. (C) Cumulative NH4+ or NO3 depletion by B. distachyon after 28 DAT, calculated as sum of NH4+ (A) and NO3 depletion (B) from 4 DAT to 28 DAT. (D) Total N per plant over time, measured by CHNS analyser. Points in (A–C) represent the mean of n=5 individual EcoFAB-N units each with one plant ±standard error. Points in (D) represent means ±standard error of n=3 EcoFAB-N units each with one plant at 11 and 20 DAT, and n=5 EcoFAB-N units each with one plant at 28 DAT. Asterisks indicate statistically significant difference by unpaired t-test: *P<0.05, **P<0.01, ***P<0.001. Bacterial effects (5 mM versus 5 mM+HS and 0.5 mM versus 0.5 mM+HS) are showed on the graphs; for other comparisons see Supplementary Table S3. DAT, days after transplanting into EcoFAB-N; HS, H. seropedicae.
Fig. 5.
Fig. 5.
Cumulative N depletion over time from Eco-FAB-N medium by B. distachyon roots exposed to 5 mM NH4NO3 or 0.5 mM NH4NO3, with or without H. seropedicae (HS). For calculations see Eqs 3–6. Data are means ±standard error (n=5 EcoFAB-N units per treatment). (A) 5 mM NH4NO3; (B) 5 mM NH4NO3 with H. seropedicae; (C) 0.5 mM NH4NO3; (D) 0.5 mM NH4NO with H. Seropedicae. Note axes are different for N levels. N contained in seeds is marked in yellow, ammonium in dark blue; nitrate in gray. For statistical differences see Supplementary Table S4.
Fig. 6.
Fig. 6.
Difference between the total N depletion from the EcoFAB-N medium and N available in the seed, and the total plant N of B. distachyon after 28 DAT grown with 5 mM or 0.5 mM NH4NO3, with or without H. seropedicae (HS). For calculation see Eqs 3–7. Data are means ±standard error of five EcoFAB-N units per treatment. Red bars, low N; black bars, high N; solid bars, H. Seropedicae (HS). Asterisks indicate statistically significant differences by unpaired t-test: *P<0.05, **P<0.01 (Supplementary Table S4D).
Fig. 7.
Fig. 7.
Quantitative real-time PCR of selected root transcripts. Relative expression level of AMT1.1, NRT1.1, GS1.1c, NiR, and NR, in B. distachyon roots grown in 5 mM NH4NO3 or 0.5 mM NH4NO3, with or without H. seropedicae (HS), in EcoFAB-N chambers for 20 and 28 DAT. (Additional time-points, without significant differences, are provided in Supplementary Fig. S4A.) Expression is normalized to UBQ10, and presented in comparison with the mean expression in 5 mM NH4NO3 at the respective time point. The expression of biological replicates is depicted using large circles or triangles, while the mean expression is shown on top of each condition using small gray circles and standard deviation error bars. A minimum of two biological replicates are shown. Asterisks indicate statistical differences by unpaired t-test for three comparisons: 0.5 versus 5 mM NH4NO3 and inoculated versus non-inoculated at each respective NH4NO3 level; and statistical differences by pairwise t-test for three comparisons: 0.5 versus 5 mM NH4NO3 and inoculated versus non-inoculated at each respective NH4NO3 level; *P<0.05, **P<0.01. y-Axis: relative expression levels (); black open circles, 5 mM NH4NO3; black filled circles, 5 mM NH4NO3 inoculated with H. seropedicae (HS); red open triangles, 0.5 mM NH4NO3; red filled triangles, 0.5 mM NH4NO3 inoculated with H. seropedicae (HS).
Fig. 8.
Fig. 8.
Quantitative real-time PCR of selected shoot transcripts. Relative expression levels () of NRT1.1, NRT2.1, GS1.1c, NiR, NR, and ARF7 in B. distachyon shoots grown in 5 mM NH4NO3 or 0.5 mM NH4NO3 with or without H. seropedicae (HS), in EcoFAB chambers at 20 and 28 DAT. (Additional time-points, without significant differences provided in Supplementary Fig. S4B.) Expression is normalized to UBQ10, and presented in comparison with the mean expression in 5 mM NH4NO3, which is set to 1, at each respective time point. The expression of biological replicates is depicted using large circles or triangles and the mean expression is shown on top of the biological replicates using small gray circles and standard deviation error bars. A minimum of two biological replicates are shown. Asterisks indicate statistical differences by unpaired t-test: for three comparisons: 0.5 versus 5 mM NH4NO3 and inoculated versus non-inoculated at each respective NH4NO3 level; *P<0.05, **P<0.01. y-Axis: relative expression levels (), black open circles, 5 mM NH4NO3; black filled circles, 5 mM NH4NO3 inoculated with H. seropedicae (HS); red open triangles, 0.5 mM NH4NO3; red filled triangles, 0.5 mM NH4NO3 inoculated with H. seropedicae (HS).
Fig 9.
Fig 9.
Summary of the response of B. distachyon to inoculation with H. seropedicae (HS) in two nitrogen conditions. At 0.5 mM NH4NO3 HS causes increase of leaf area, elongation of primary root, and shortening of root hairs. Inoculated plants also depleted NH4+ faster from the medium. Their nitrate uptake genes NRT2.1 (both time points) and NRT1.1 (28 DAT) in shoot have higher expression, corresponding to behavior at low NO3. At 5 mM NH4NO3 inoculated plants show longer primary roots and shorter root hairs than non-inoculated plants. They deplete less NO3 from the medium. Yellow stars indicate significant differences by non-invasive phenotyping. Relative expression, as ratio of inoculated versus non-inoculated is shown in the heat maps, with high (dark blue) and low ratio (white); asterisks indicate significant t-test in the inoculated versus non-inoculated plants. N-form uptake (gray triangles): increased depletion from medium (upright traingle), decreased depletion (inverted triangle). Control, non-inoculated; +HS, inoculated plants; LR, lateral roots; PR, primary root; RH, root hairs.

Similar articles

Cited by

References

    1. Arsova B, Foster KJ, Shelden MC, Bramley H, Watt M.. 2020. Dynamics in plant roots and shoots minimize stress, save energy and maintain water and nutrient uptake. New Phytologist 225, 1111–1119. - PubMed
    1. Boot RG, Mensink M.. 1990. Size and morphology of root systems of perennial grasses from contrasting habitats as affected by nitrogen supply. Plant and Soil 129, 291–299.
    1. Brkljacic J, Grotewold E, Scholl R, et al. . 2011. Brachypodium as a model for the grasses: today and the future. Plant Physiology 157, 3–13. - PMC - PubMed
    1. Bundesministerium der justiz und für Verbraucherschutz. 2017. Verordnung über die Anwendung von Düngemitteln, Bodenhilfsstoffen, Kultursubstraten und Pflanzenhilfsmitteln nach den Grundsätzen der guten fachlichen Praxis beim Düngen (Düngeverordnung – DüV).https://www.gesetze-im-internet.de/d_v_2017/D%C3%BCV.pdf
    1. Cambui CA, Svennerstam H, Gruffman L, Nordin A, Ganeteg U, Näsholm T.. 2011. Patterns of plant biomass partitioning depend on nitrogen source. PLoS One 6, e19211. - PMC - PubMed

Publication types

Supplementary concepts