

SARS-CoV-2 and other airborne respiratory viruses in outdoor aerosols in three Swiss cities before and during the first wave of the COVID-19 pandemic
- PMID: 35512527
- PMCID: PMC9060371
- DOI: 10.1016/j.envint.2022.107266
SARS-CoV-2 and other airborne respiratory viruses in outdoor aerosols in three Swiss cities before and during the first wave of the COVID-19 pandemic
Abstract
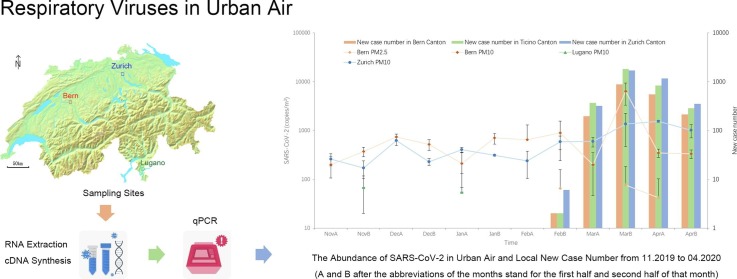
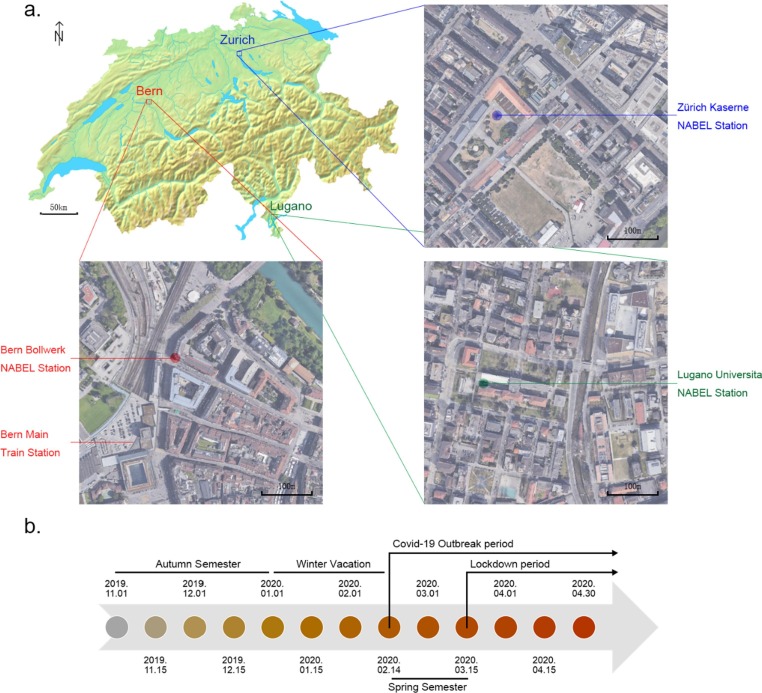
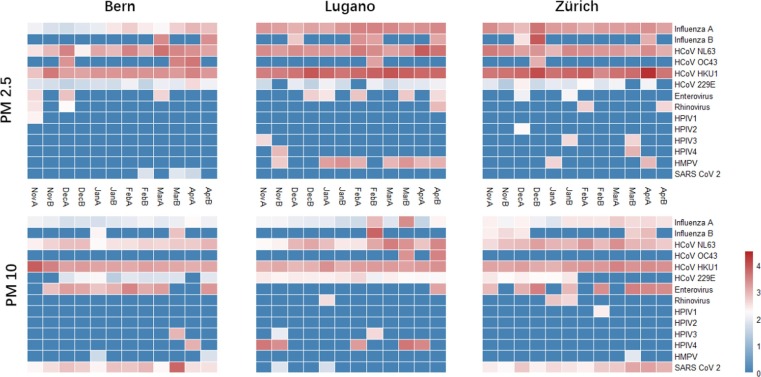
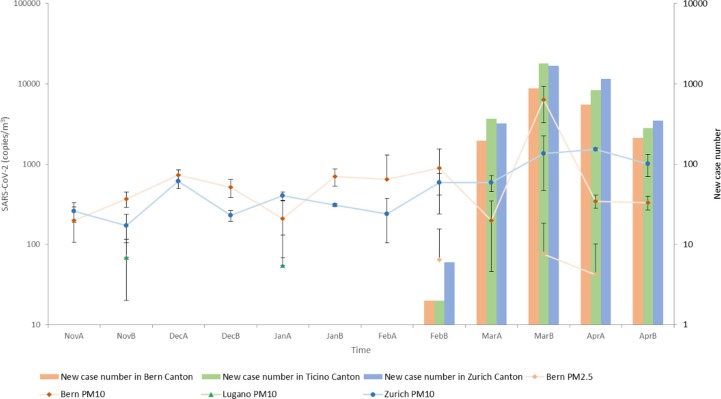
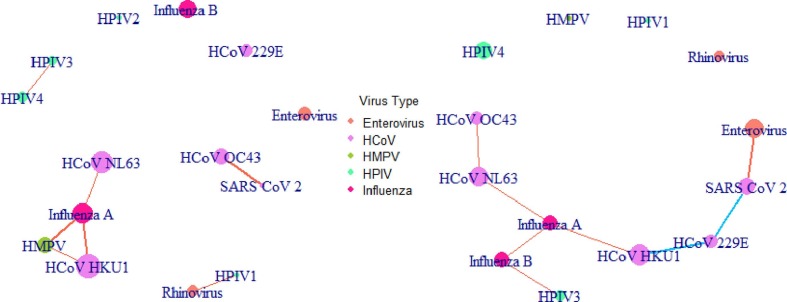
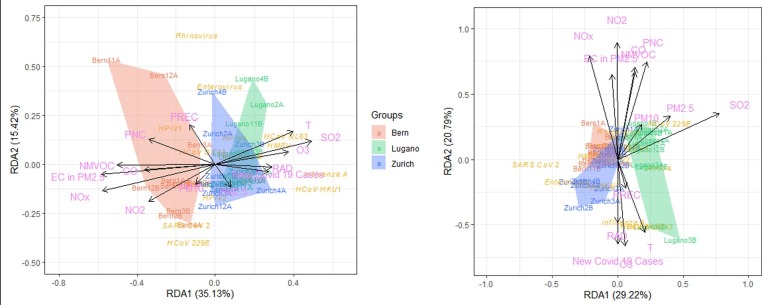
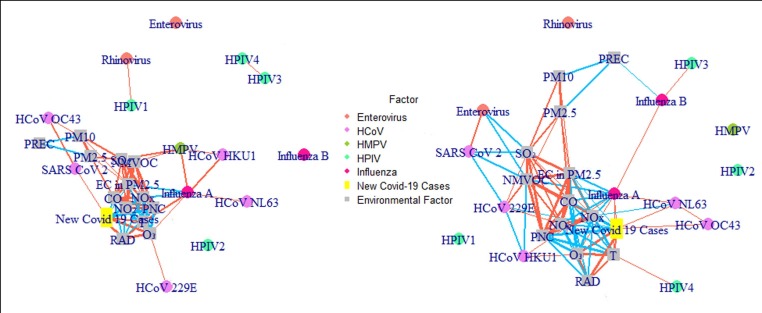
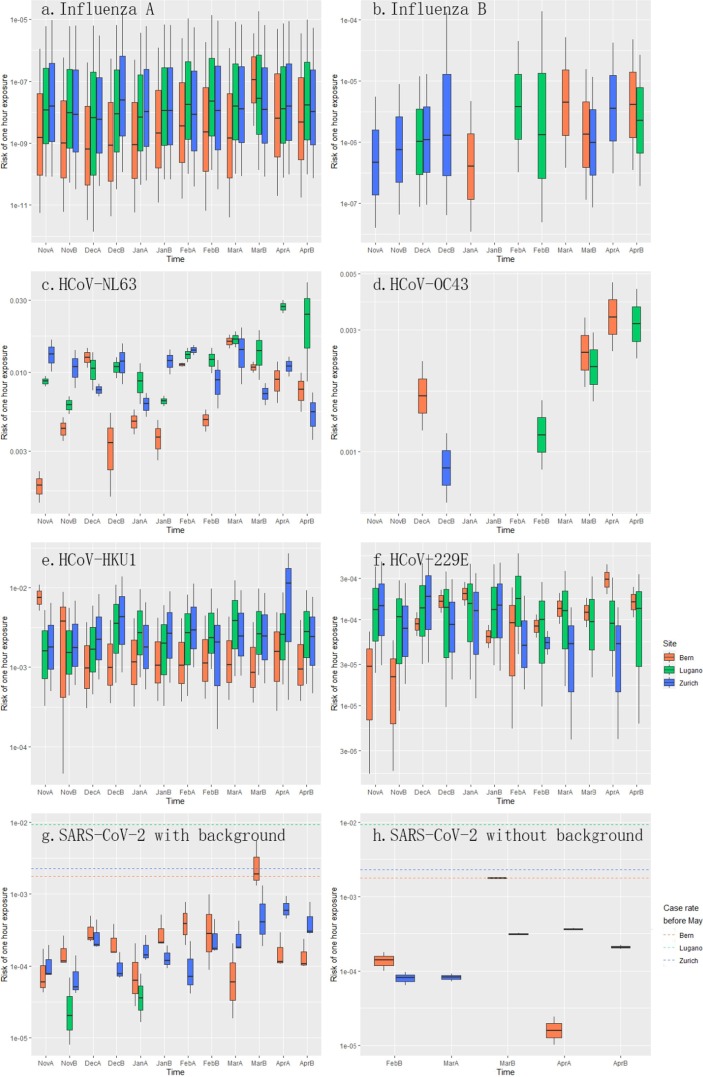
Caused by the SARS-CoV-2 virus, Coronavirus disease 2019 (COVID-19) has been affecting the world since the end of 2019. While virus-laden particles have been commonly detected and studied in the aerosol samples from indoor healthcare settings, studies are scarce on air surveillance of the virus in outdoor non-healthcare environments, including the correlations between SARS-CoV-2 and other respiratory viruses, between viruses and environmental factors, and between viruses and human behavior changes due to the public health measures against COVID-19. Therefore, in this study, we collected airborne particulate matter (PM) samples from November 2019 to April 2020 in Bern, Lugano, and Zurich. Among 14 detected viruses, influenza A, HCoV-NL63, HCoV-HKU1, and HCoV-229E were abundant in air. SARS-CoV-2 and enterovirus were moderately common, while the remaining viruses occurred only in low concentrations. SARS-CoV-2 was detected in PM10 (PM below 10 µm) samples of Bern and Zurich, and PM2.5 (PM below 2.5 µm) samples of Bern which exhibited a concentration positively correlated with the local COVID-19 case number. The concentration was also correlated with the concentration of enterovirus which raised the concern of coinfection. The estimated COVID-19 infection risks of an hour exposure at these two sites were generally low but still cannot be neglected. Our study demonstrated the potential functionality of outdoor air surveillance of airborne respiratory viruses, especially at transportation hubs and traffic arteries.
Keywords: Air pollution; Airborne respiratory virus; Bioaerosol; COVID-19; SARS-CoV-2; Surveillance.
Copyright © 2022 The Authors. Published by Elsevier Ltd.. All rights reserved.
Conflict of interest statement
The authors declare that they have no known competing financial interests or personal relationships that could have appeared to influence the work reported in this paper.
Figures
Similar articles
-
SARS-CoV-2 concentrations and virus-laden aerosol size distributions in outdoor air in north and south of Italy.Environ Int. 2021 Jan;146:106255. doi: 10.1016/j.envint.2020.106255. Epub 2020 Nov 12. Environ Int. 2021. PMID: 33221596 Free PMC article.
-
Assessing the relationship between surface levels of PM2.5 and PM10 particulate matter impact on COVID-19 in Milan, Italy.Sci Total Environ. 2020 Oct 10;738:139825. doi: 10.1016/j.scitotenv.2020.139825. Epub 2020 Jun 2. Sci Total Environ. 2020. PMID: 32512362 Free PMC article.
-
Molecular detection of SARS-CoV-2 and other respiratory viruses in saliva and classroom air: a two winters tale.Clin Microbiol Infect. 2024 Jun;30(6):829.e1-829.e4. doi: 10.1016/j.cmi.2024.03.002. Epub 2024 Mar 10. Clin Microbiol Infect. 2024. PMID: 38467247
-
Influence of airborne transmission of SARS-CoV-2 on COVID-19 pandemic. A review.Environ Res. 2020 Sep;188:109861. doi: 10.1016/j.envres.2020.109861. Epub 2020 Jun 23. Environ Res. 2020. PMID: 32718835 Free PMC article. Review.
-
Minimum Sizes of Respiratory Particles Carrying SARS-CoV-2 and the Possibility of Aerosol Generation.Int J Environ Res Public Health. 2020 Sep 23;17(19):6960. doi: 10.3390/ijerph17196960. Int J Environ Res Public Health. 2020. PMID: 32977575 Free PMC article. Review.
Cited by
-
Environmental dissemination of respiratory viruses: dynamic interdependencies of respiratory droplets, aerosols, aerial particulates, environmental surfaces, and contribution of viral re-aerosolization.PeerJ. 2023 Nov 24;11:e16420. doi: 10.7717/peerj.16420. eCollection 2023. PeerJ. 2023. PMID: 38025703 Free PMC article. Review.
-
Unanswered questions on the airborne transmission of COVID-19.Environ Chem Lett. 2023;21(2):725-739. doi: 10.1007/s10311-022-01557-z. Epub 2023 Jan 6. Environ Chem Lett. 2023. PMID: 36628267 Free PMC article. Review.
-
Direct Quantitation of SARS-CoV-2 Virus in Urban Ambient Air via a Continuous-Flow Electrochemical Bioassay.Adv Sci (Weinh). 2023 Aug;10(22):e2301222. doi: 10.1002/advs.202301222. Epub 2023 May 24. Adv Sci (Weinh). 2023. PMID: 37222069 Free PMC article.
-
Peculiar weather patterns effects on air pollution and COVID-19 spread in Tokyo metropolis.Environ Res. 2023 Jul 1;228:115907. doi: 10.1016/j.envres.2023.115907. Epub 2023 Apr 18. Environ Res. 2023. PMID: 37080275 Free PMC article.
-
SARS-CoV-2 RNA Presence in Outdoor Air of Public Spaces in Valladolid During Winter, 2021.Food Environ Virol. 2024 Nov 30;17(1):4. doi: 10.1007/s12560-024-09615-1. Food Environ Virol. 2024. PMID: 39614965 Free PMC article.
References
-
- FOEN. Data query NABEL. https://www.bafu.admin.ch/bafu/en/home/topics/air/state/data/data-query-... 2021 (accessed November 8, 2021).
-
- FOPH. Bericht zur Grippesaison 2019/2020. http://meldesysteme.bagapps.ch/sentinella/publikationen/2020%20Saisonber... 2022 (accessed January 17, 2022).
-
- FOPH. COVID-19 Switzerland. https://www.covid19.admin.ch/en/epidemiologic/case; 2021 (accessed November 8, 2021).
-
- FSO. Portraits of the cantons. https://www.bfs.admin.ch/bfs/en/home/statistics/regional-statistics/regi... 2021 (accessed November 8, 2021).
Publication types
MeSH terms
Substances
LinkOut - more resources
Full Text Sources
Medical
Miscellaneous
