

Understanding the spatial diffusion dynamics of the COVID-19 pandemic in the city system in China
- PMID: 35512611
- PMCID: PMC9046135
- DOI: 10.1016/j.socscimed.2022.114988
Understanding the spatial diffusion dynamics of the COVID-19 pandemic in the city system in China
Abstract
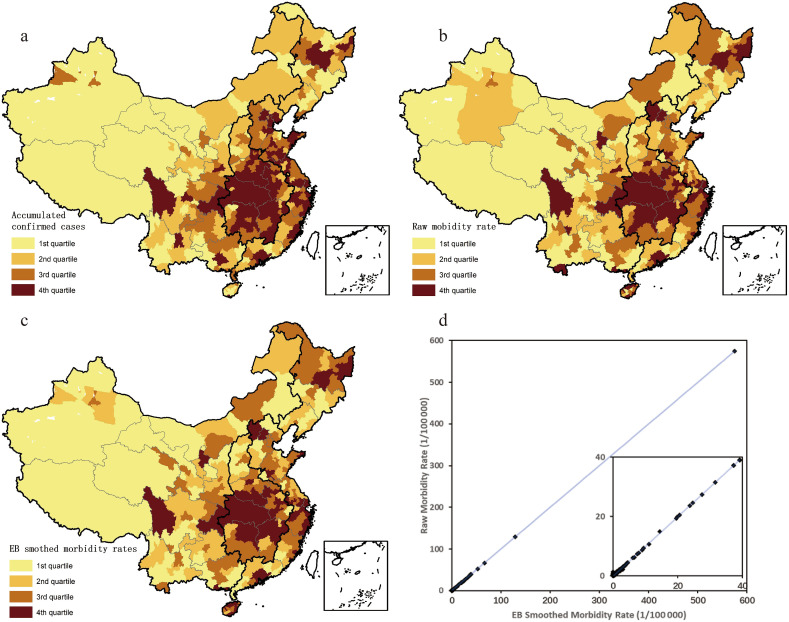
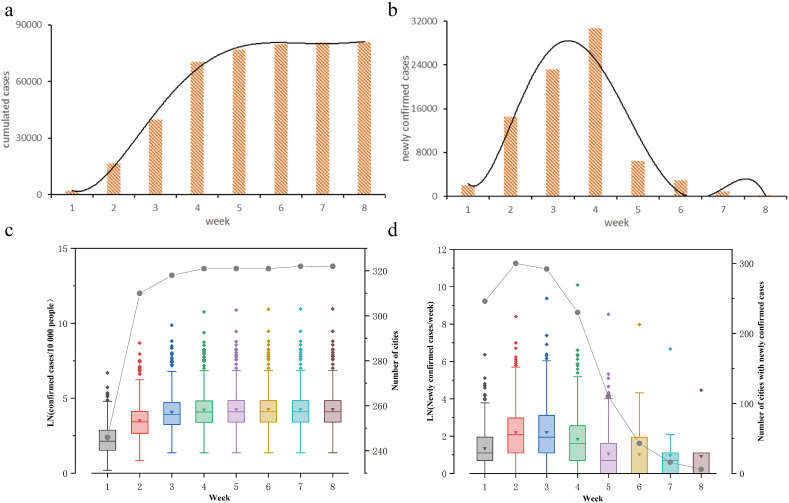
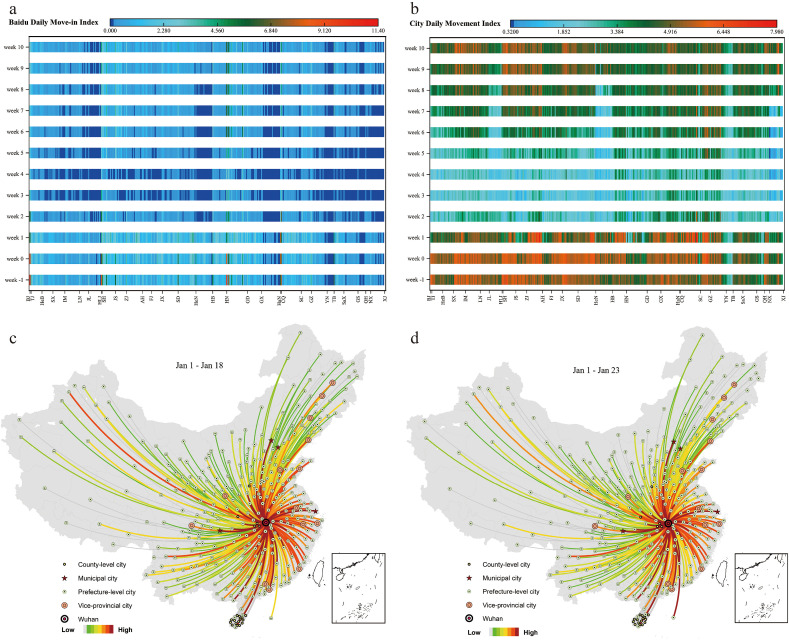
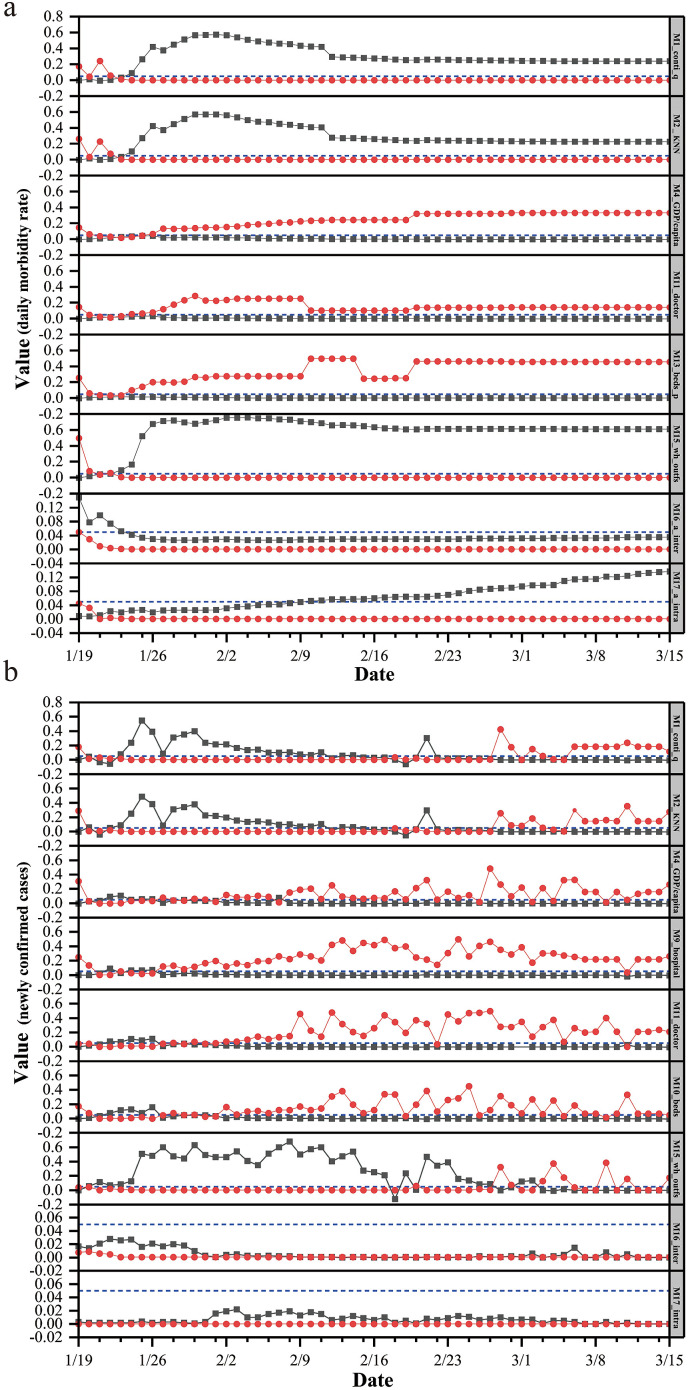
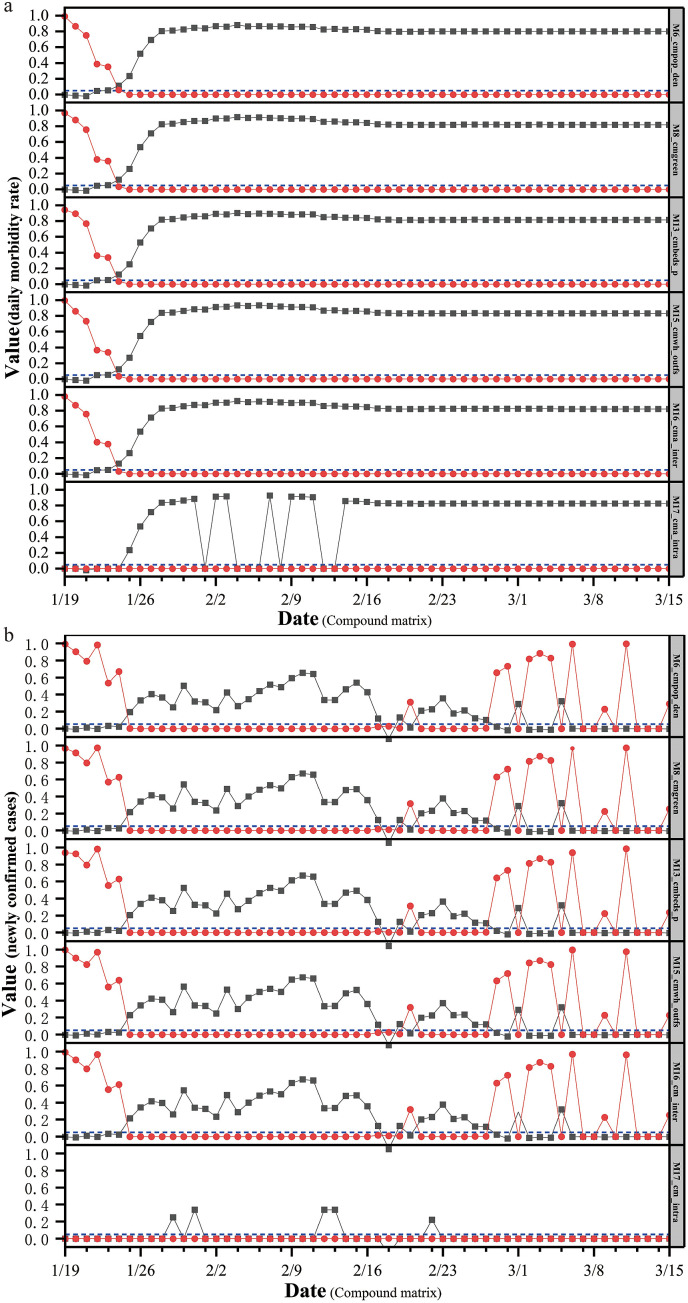
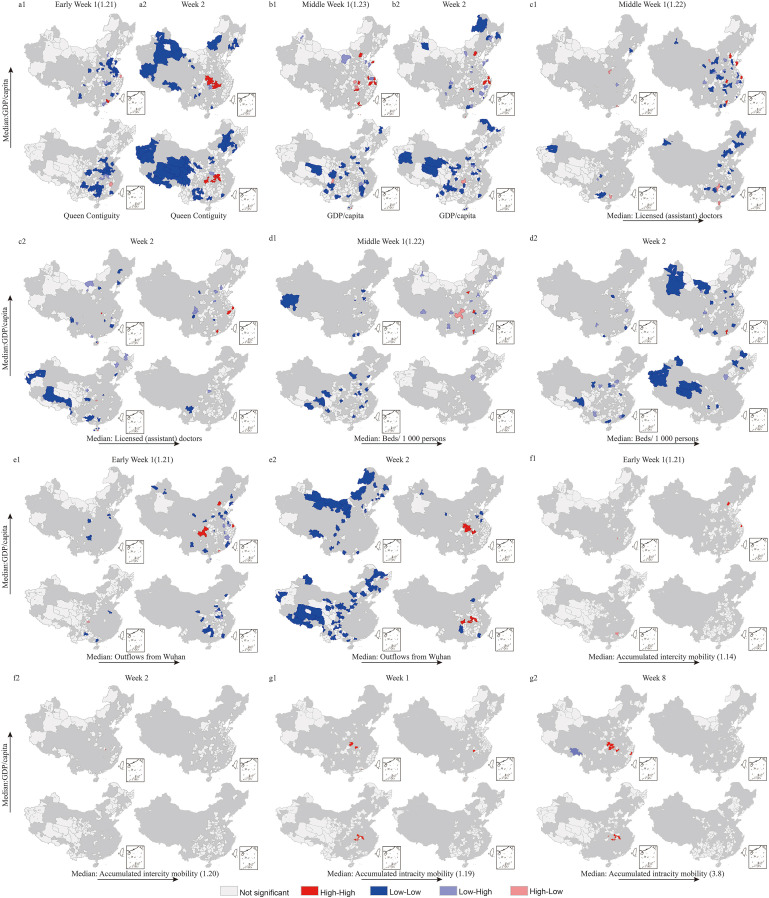
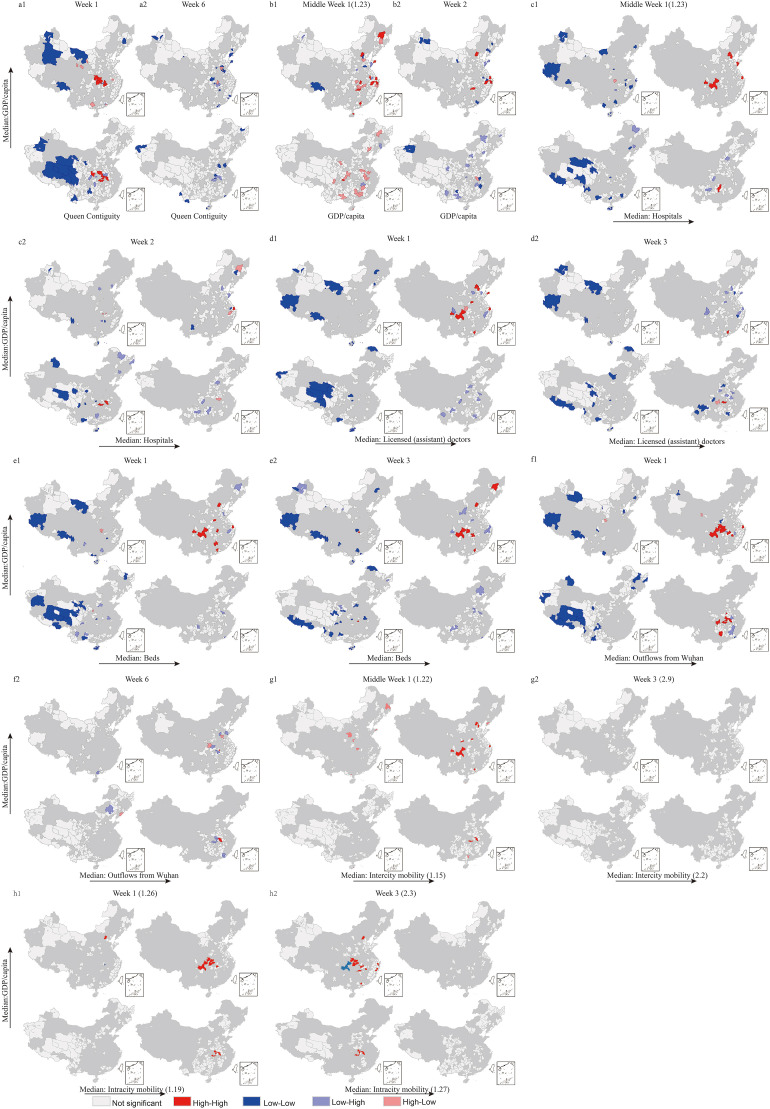
Investigating the spatial epidemic dynamics of COVID-19 is crucial in understanding the routine of spatial diffusion and in surveillance, prediction, identification and prevention of another potential outbreak. However, previous studies attempting to evaluate these spatial diffusion dynamics are limited. Using city as the research unit and spatial association analysis as the primary strategy, this study explored the changing primary risk factors impacting the spatial spread of COVID-19 across Chinese cities under various diffusion assumptions and throughout the epidemic stage. Moreover, this study investigated the characteristics and geographical distributions of high-risk areas in different epidemic stages. The results empirically indicated rapid intercity diffusion at the early stage and primarily intracity diffusion thereafter. Before countermeasures took effect, proximity, GDP per capita, medical resources, outflows from Wuhan and intercity mobility significantly affected early diffusion. With speedily effective countermeasures, outflows from the epicenter, proximity, and intracity outflows played an important role. At the early stage, high-risk areas were mainly cities adjacent to the epicenter, with higher GDP per capita, or a combination of higher GDP per capita and better medical resources, with more outflow from the epicenter, or more intercity mobility. After countermeasures were effected, cities adjacent to the epicenter, or with more outflow from the epicenter or more intracity mobility became high-risk areas. This study provides an insightful understanding of the spatial diffusion of COVID-19 across cities. The findings are informative for effectively handling the potential recurrence of COVID-19 in various settings.
Keywords: COVID-19; China; City; Diffusion; Spatial association.
Copyright © 2022 Elsevier Ltd. All rights reserved.
Figures
Similar articles
-
What Are the Reasons for the Different COVID-19 Situations in Different Cities of China? A Study from the Perspective of Population Migration.Int J Environ Res Public Health. 2021 Mar 21;18(6):3255. doi: 10.3390/ijerph18063255. Int J Environ Res Public Health. 2021. PMID: 33801124 Free PMC article.
-
Spatial epidemic dynamics of the COVID-19 outbreak in China.Int J Infect Dis. 2020 May;94:96-102. doi: 10.1016/j.ijid.2020.03.076. Epub 2020 Apr 3. Int J Infect Dis. 2020. PMID: 32251789 Free PMC article.
-
Exploring the Impact of Localized COVID-19 Events on Intercity Mobility during the Normalized Prevention and Control Period in China.Int J Environ Res Public Health. 2022 Nov 3;19(21):14421. doi: 10.3390/ijerph192114421. Int J Environ Res Public Health. 2022. PMID: 36361300 Free PMC article.
-
Spatiotemporal heterogeneity and its determinants of COVID-19 transmission in typical labor export provinces of China.BMC Infect Dis. 2021 Mar 5;21(1):242. doi: 10.1186/s12879-021-05926-x. BMC Infect Dis. 2021. PMID: 33673819 Free PMC article.
-
Population Movement, City Closure in Wuhan, and Geographical Expansion of the COVID-19 Infection in China in January 2020.Clin Infect Dis. 2020 Nov 19;71(16):2045-2051. doi: 10.1093/cid/ciaa422. Clin Infect Dis. 2020. PMID: 32302377 Free PMC article.
Cited by
-
Investigating the impact of the COVID-19 pandemic on the nutritional status of infants and toddlers: insights from China.Popul Health Metr. 2024 Nov 12;22(1):31. doi: 10.1186/s12963-024-00353-x. Popul Health Metr. 2024. PMID: 39533281 Free PMC article.
-
Geoepidemiological perspective on COVID-19 pandemic review, an insight into the global impact.Front Public Health. 2023 Oct 19;11:1242891. doi: 10.3389/fpubh.2023.1242891. eCollection 2023. Front Public Health. 2023. PMID: 37927887 Free PMC article. Review.
-
COVID-19 modeling based on real geographic and population data.Turk J Med Sci. 2023 Feb;53(1):333-339. doi: 10.55730/1300-0144.5589. Epub 2023 Feb 22. Turk J Med Sci. 2023. PMID: 36945958 Free PMC article.
-
The interaction of disease transmission, mortality, and economic output over the first 2 years of the COVID-19 pandemic.PLoS One. 2024 Jun 13;19(6):e0301785. doi: 10.1371/journal.pone.0301785. eCollection 2024. PLoS One. 2024. PMID: 38870106 Free PMC article.
References
-
- Anselin L. Maps for Rates or Proportions. 2018. https://geodacenter.github.io/workbook/3b_rates/lab3b.html#empirical-bay...
-
- Anselin L. Global Spatial Autocorrelation: Visualizing Spatial Autocorrelation. 2020. https://geodacenter.github.io/workbook/5a_global_auto/lab5a.html
-
- Anselin L., Bera A.K. Handbook of Applied Economic Statistics. CRC Press; Boca Raton: 1998. Spatial dependence in linear regression models with an introduction to spatial econometrics.
Publication types
MeSH terms
LinkOut - more resources
Full Text Sources
Medical
