. 2022 May 5;5(8):e202101338.
doi: 10.26508/lsa.202101338. Print 2022 Aug.

Analyzing efficacy, stability, and safety of AAV-mediated optogenetic hearing restoration in mice

Affiliations

Analyzing efficacy, stability, and safety of AAV-mediated optogenetic hearing restoration in mice

Burak Bali et al. Life Sci Alliance. .

Abstract

AAV-mediated optogenetic neural stimulation has become a clinical approach for restoring function in sensory disorders and feasibility for hearing restoration has been indicated in rodents. Nonetheless, long-term stability and safety of AAV-mediated channelrhodopsin (ChR) expression in spiral ganglion neurons (SGNs) remained to be addressed. Here, we used longitudinal studies on mice subjected to early postnatal administration of AAV2/6 carrying fast gating ChR f-Chrimson under the control of the human synapsin promoter unilaterally to the cochlea. f-Chrimson expression in SGNs in both ears and the brain was probed in animals aged 1 mo to 2 yr. f-Chrimson was observed in SGNs at all ages indicating longevity of ChR-expression. SGN numbers in the AAV-injected cochleae declined with age faster than in controls. Investigations were extended to the brain in which viral transduction was observed across the organ at varying degrees irrespective of age without observing viral spread-related pathologies. No viral DNA or virus-related histopathological findings in visceral organs were encountered. In summary, our study demonstrates life-long (24 mo in mice) expression of f-Chrimson in SGNs upon single AAV-dosing of the cochlea.


Conflict of interest statement

T Moser is co-founder of OptoGenTech company.

Figures

None
Graphical abstract
Figure 1.
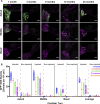
Figure 1.. Expression of f-Chrimson in spiral ganglion neurons of the mouse cochlea.
(A) Exemplary confocal images of immunofluorescently labeled mid-modiolar cryosections (PV as context marker, GFP for detecting f-Chrimson-eYFP) from postnatally AAV-injected cochleae for the different age-groups. Scale bar: 50 μm. (B) Density of GFP+ spiral ganglion neuron averaged across all cochlear turns for the injected (filled boxes) and contralateral non-injected (open boxes) cochleae of all age-groups. Box–whisker plots with upper and lower limits of the boxes representing 75% and 25% confidence intervals. Horizontal lines in the boxes indicate the median of the corresponding dataset. N1-mo = 4, N3-mo = 3, N6-mo = 4, N12-mo = 6, N24-mo = 3 mice.
Figure 2.
Figure 2.. Spiral ganglion neuron (SGN) density of f-Chrimson–injected cochleae in comparison with negative controls.
(A) Confocal images of mid-modiolar cross-sections from virus-injected, PBS-injected, and naïve cochleae from 3- to 12-mo-old mice. Scale bar: 50 μm. (B) SGN densities estimated as number of parvalbumin-immunofluorescence positive cells, PV+, per area of Rosenthal’s canal (see the Materials and Methods section) of modiolar turns from the injected cochleae of AAV-f-Chrimson–, PBS-injected, and naïve animals for the age-groups of 3-, 6-, and 12-mo-old mice. (C) Border designation of the plots is as in (C). N3-mo = 3, N6-mo = 4, N12-mo = 6 mice for AAV-f-Chrimson; N3-mo = 2 mice for PBS; N6-mo = 2 mice and N12-mo = 2 mice for naïve group. (C) SGN densities across all cochlear turns from the injected (filled boxes) and contralateral non-injected (open boxes) cochleae across the age-groups are plotted in box–whisker graphs. Upper and lower limits of the boxes represent 75% and 25% of the dataset, respectively. Horizontal lines in the boxes indicate the median, whereas the whiskers stand for maximum and minimum of the corresponding dataset. N1-mo = 4, N3-mo = 3, N6-mo = 4, N12-mo = 6, N24-mo = 3 mice.
Figure 3.
Figure 3.. Histopathological analysis of the cochlea.
(A, B) Light micrographs of a HE stained cochleae of a 12-mo-old mouse (#652279): AAV-injected (A) side showing an extreme example of spiral ganglion neuron loss (circle represents one of the remaining spiral ganglion neurons), accompanied by interstitial vacuolation (asterisk) and some cellular debris (arrows) in the apical (a) and middle (m) modiolar turns, compared with the contralateral, non-injected side (B). Histological appearance of basal (b) parts was more similar on both sides; scale bars left: 200 μm; right: 50 μm.
Figure S1.
Figure S1.. Scatter plots comparing semiquantitative histological scoring (means with standard deviation) of spiral ganglion neuron density, interstitial vacuolation, and cellular debris in apical, middle, and basal modiolar turns of both spiral ganglia (full = injected, empty = non-injected cochlea) from different virus-injected (-v) age-groups, as well as sham-injected (-pbs), and naïve (-n) control groups.
Differences in neuronal density and interstitial vacuolation between injected und non-injected cochleae were most discernible in the apical and middle modiolar turns of the spiral ganglion at the age of 12 mo. N1mo-v = 4; N3mo-v = 3; N6mo-v = 3; N12mo-v = 3; N24mo-v = 3; N3mo-pbs = 2; N6mo-n = 2; N12mo-v = 2.
Figure 4.
Figure 4.. Off-target expression of viral f-Chrimson construct.
(A) Exemplary light microscopy images of coronal sections of transduced and naïve mice at the age of 12 mo are shown. Chromogenic DAB (brown) labels the regions where f-Chrimson expression is present on the three brain blocks along rostro-caudal axis. Scale bars: 2 mm. (A, B) Zoom-in images of the numbered regions from (A). Scale bars: 200 μm. (C, D) Quantification of expression of f-Chrimson along rostro-ventral (C) or lateral (D) axes.
Figure S2.
Figure S2.. Lack of obvious histopathological changes in the brain after cochlear AAV-injection.
Scatter plots comparing semiquanitiative histological scoring (means with SD) of neuronal degeneration, perivascular cuffing and gliosis in frontal (block I), middle (block II), and caudal (block III) brain regions ipsi- (full) and contralateral (empty) to the injected cochlea of different AAV-injected (-v) age-groups, as well as sham-injected (-pbs), and naïve (-n) control groups. Distinct cerebral AAV-injection–related histopathological changes are not observed. N1mo-v = 4; N3mo-v = 3; N6mo-v = 4; N12mo-v = 5; N24mo-v = 3; N3mo-pbs = 2; N6mo-n = 2; N12mo-v = 2.
Figure 5.
Figure 5.. Age-related T-cell infiltration in the brain.
(A) Exemplary CD3+ T-lymphocytes (arrowheads) are shown in the white matter of cerebellum from a 24-mo-old mouse. Scale bar: 200 μm. (B) CD3 histology on retrosplenial cortex (Bi) and cochlear nucleus (Bii) corresponding to f-Chrimson+ regions from Fig 4B. Insets show the relative location of the zoom-in image to the whole coronal section. Scale bars: 200 μm. (C, D) Average T-cell densities are plotted either along rostro-caudal (C) or lateral (D) axes.
Figure 6.
Figure 6.. Microglia activation profile.
(A, B) Exemplary light microscopy images of IBA-1 labeled cerebellar tissue from helminth-infected (A), transduced (Bi), and naïve (Bii) animals. Insets show the overview images. Scale bars: 200 μm, and 2 mm for insets. (C, D) Microglia activation, number of strongly positive pixels per 104 μm2, plotted for rostro-caudal (C) and lateral profiles (D) for virus-injected, naïve, and helminth-infected neural tissue as positive control.
Figure 7.
Figure 7.. f-Chrimson DNA was not detected in inner organs of mice.
(A) pAAV vector used in the study. Arrows indicate forward (F) and reverse (R) primers. (B) Agarose gel image of PCR products amplified from template plasmid DNA (pAAV-hSyn-f-Chrimson-eYFP-WPRE-bGH) as positive control for amplified site (1), double-distilled H2O as PCR negative control (2), tissue DNA sample extracted from contralateral non-injected cochlea as DNA isolation control (3), tissue DNA samples (dashed rectangle) extracted from contralateral non-injected cochlea (4), injected cochlea (5), heart (6), lung (7), liver (8), kidney (9), and spleen (10) are shown. All tissue samples are from a 1-mo-old transduced mouse. Expected PCR product size for cochleae and the inner organs is 917 bp (4–10) whereas it is 367 bp for DNA isolation control (3).

References

    1. Akil O, Seal RP, Burke K, Wang C, Alemi A, During M, Edwards RH, Lustig LR (2012) Restoration of hearing in the VGLUT3 knockout mouse using virally mediated gene therapy. Neuron 75: 283–293. 10.1016/j.neuron.2012.05.019 - DOI - PMC - PubMed
    1. Al-Moyed H, Cepeda AP, Jung S, Moser T, Kügler S, Reisinger E (2019) A dual-AAV approach restores fast exocytosis and partially rescues auditory function in deaf otoferlin knock-out mice. EMBO Mol Med 11: e9396. 10.15252/emmm.201809396 - DOI - PMC - PubMed
    1. Askew C, Rochat C, Pan B, Asai Y, Ahmed H, Child E, Schneider BL, Aebischer P, Holt JR (2015) Tmc gene therapy restores auditory function in deaf mice. Sci Transl Med 7: 295ra108. 10.1126/scitranslmed.aab1996 - DOI - PMC - PubMed
    1. Bali B, Lopez de la Morena D, Mittring A, Mager T, Rankovic V, Huet AT, Moser T (2021) Utility of red-light ultrafast optogenetic stimulation of the auditory pathway. EMBO Mol Med 13: e13391. 10.15252/emmm.202013391 - DOI - PMC - PubMed
    1. Boyden ES, Zhang F, Bamberg E, Nagel G, Deisseroth K (2005) Millisecond-timescale, genetically targeted optical control of neural activity. Nat Neurosci 8: 1263–1268. 10.1038/nn1525 - DOI - PubMed

Publication types

LinkOut - more resources