

Radiomics-Based Precision Phenotyping Identifies Unstable Coronary Plaques From Computed Tomography Angiography
- PMID: 35512957
- PMCID: PMC9072980
- DOI: 10.1016/j.jcmg.2021.11.016
Radiomics-Based Precision Phenotyping Identifies Unstable Coronary Plaques From Computed Tomography Angiography
Abstract
Objectives: The aim of this study was to precisely phenotype culprit and nonculprit lesions in myocardial infarction (MI) and lesions in stable coronary artery disease (CAD) using coronary computed tomography angiography (CTA)-based radiomic analysis.
Background: It remains debated whether any single coronary atherosclerotic plaque within the vulnerable patient exhibits unique morphology conferring an increased risk of clinical events.
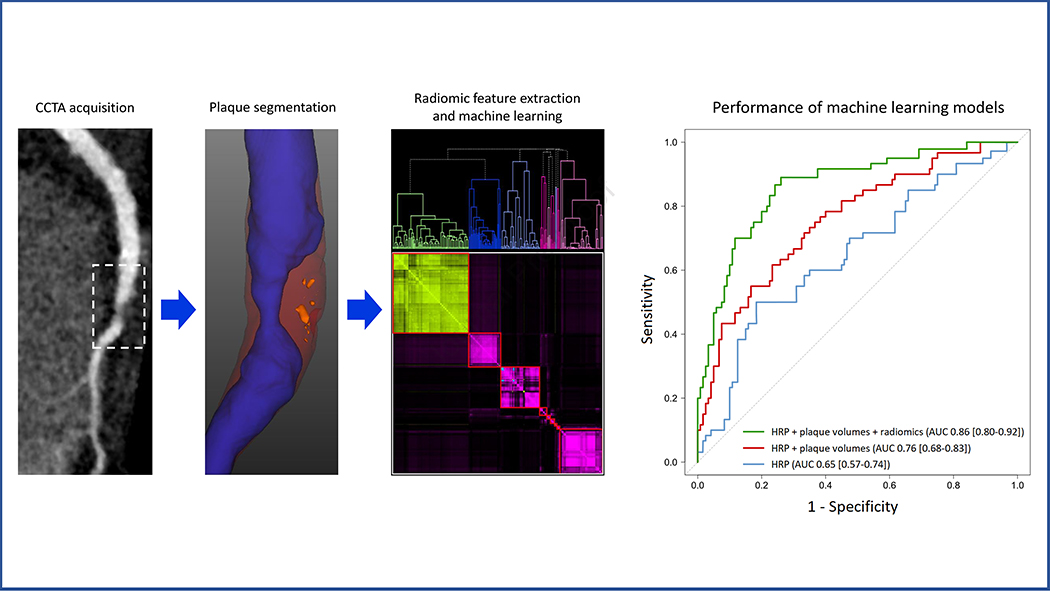
Methods: A total of 60 patients with acute MI prospectively underwent coronary CTA before invasive angiography and were matched to 60 patients with stable CAD. For all coronary lesions, high-risk plaque (HRP) characteristics were qualitatively assessed, followed by semiautomated plaque quantification and extraction of 1,103 radiomic features. Machine learning models were built to examine the additive value of radiomic features for discriminating culprit lesions over and above HRP and plaque volumes.
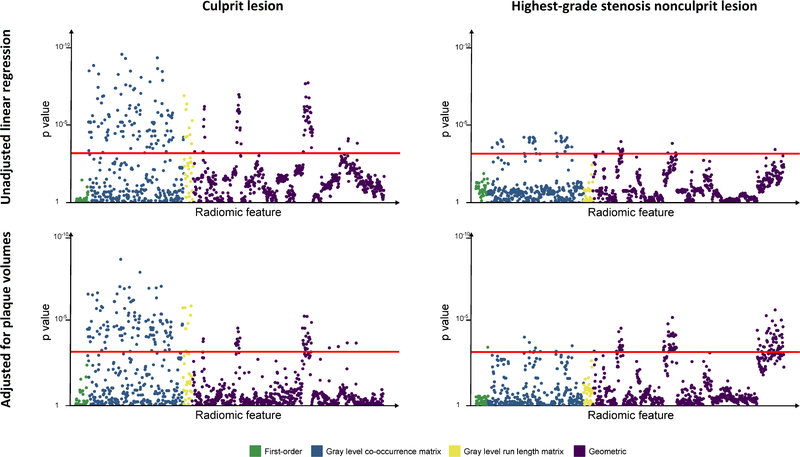
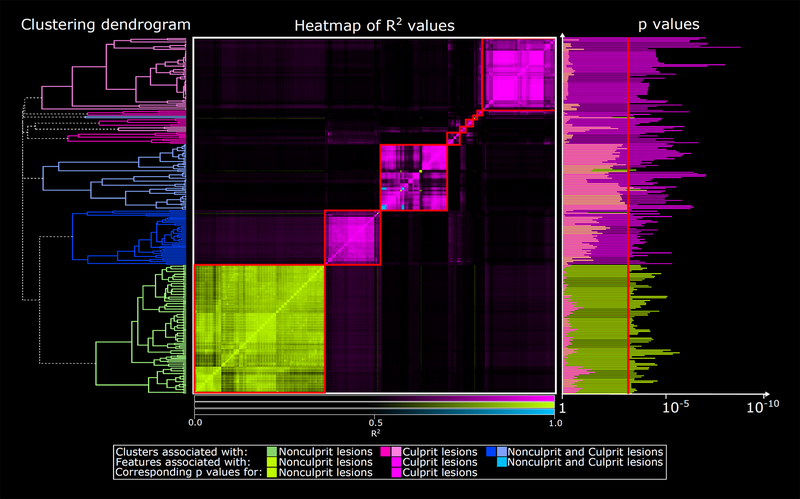
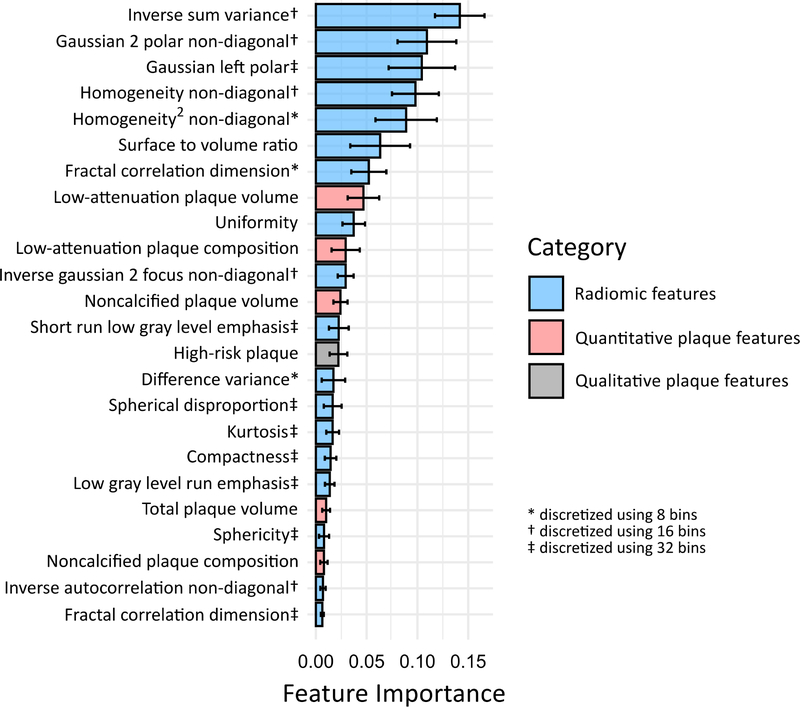
Results: Culprit lesions had higher mean volumes of noncalcified plaque (NCP) and low-density noncalcified plaque (LDNCP) compared with the highest-grade stenosis nonculprits and highest-grade stenosis stable CAD lesions (NCP: 138.1 mm3 vs 110.7 mm3 vs 102.7 mm3; LDNCP: 14.2 mm3 vs 9.8 mm3 vs 8.4 mm3; both Ptrend < 0.01). In multivariable linear regression adjusted for NCP and LDNCP volumes, 14.9% (164 of 1,103) of radiomic features were associated with culprits and 9.7% (107 of 1,103) were associated with the highest-grade stenosis nonculprits (critical P < 0.0007) when compared with highest-grade stenosis stable CAD lesions as reference. Hierarchical clustering of significant radiomic features identified 9 unique data clusters (latent phenotypes): 5 contained radiomic features specific to culprits, 1 contained features specific to highest-grade stenosis nonculprits, and 3 contained features associated with either lesion type. Radiomic features provided incremental value for discriminating culprit lesions when added to a machine learning model containing HRP and plaque volumes (area under the receiver-operating characteristic curve 0.86 vs 0.76; P = 0.004).
Conclusions: Culprit lesions and highest-grade stenosis nonculprit lesions in MI have distinct radiomic signatures compared with lesions in stable CAD. Within the vulnerable patient may exist individual vulnerable plaques identifiable by coronary CTA-based precision phenotyping.
Keywords: coronary computed tomography angiography; coronary plaque; machine learning; myocardial infarction; radiomics.
Copyright © 2022 American College of Cardiology Foundation. Published by Elsevier Inc. All rights reserved.
Conflict of interest statement
Funding Support and Author Disclosures This study was supported in part by grants from the National Heart, Lung, and Blood Institute (1R01HL133616 and 1R01HL148787-01A1). Outside of the current work, Drs Cadet, Slomka, and Dey have received software royalties from Cedars-Sinai Medical Center. Drs Slomka and Dey hold a patent (US8885905B2 in USA and WO patent WO2011069120A1, Method and System for Plaque Characterization). All other authors have reported that they have no relationships relevant to the contents of this paper to disclose.
Figures
Comment in
-
Are You a Robot?: Please Select the Images Containing Unstable Plaque.JACC Cardiovasc Imaging. 2022 May;15(5):872-874. doi: 10.1016/j.jcmg.2021.12.007. Epub 2022 Feb 16. JACC Cardiovasc Imaging. 2022. PMID: 35512958 No abstract available.
Similar articles
-
Coronary Computed Tomography Angiography-Specific Definitions of High-Risk Plaque Features Improve Detection of Acute Coronary Syndrome.Circ Cardiovasc Imaging. 2018 Aug;11(8):e007657. doi: 10.1161/CIRCIMAGING.118.007657. Circ Cardiovasc Imaging. 2018. PMID: 30354493 Free PMC article.
-
Identification of noncalcified coronary plaque characteristics using machine learning radiomic analysis of non-contrast high-resolution computed tomography.Kardiol Pol. 2023;81(10):978-989. doi: 10.33963/v.kp.97206. Epub 2023 Sep 3. Kardiol Pol. 2023. PMID: 37660373
-
Identification of High-Risk Plaques Destined to Cause Acute Coronary Syndrome Using Coronary Computed Tomographic Angiography and Computational Fluid Dynamics.JACC Cardiovasc Imaging. 2019 Jun;12(6):1032-1043. doi: 10.1016/j.jcmg.2018.01.023. Epub 2018 Mar 14. JACC Cardiovasc Imaging. 2019. PMID: 29550316
-
Phenotyping atherosclerotic plaque and perivascular adipose tissue: signalling pathways and clinical biomarkers in atherosclerosis.Nat Rev Cardiol. 2025 Jun;22(6):443-455. doi: 10.1038/s41569-024-01110-1. Epub 2025 Jan 2. Nat Rev Cardiol. 2025. PMID: 39743563 Free PMC article. Review.
-
Can we measure vulnerable plaques on coronary CT angiography with both precision and accuracy?J Cardiovasc Comput Tomogr. 2021 Mar-Apr;15(2):146-147. doi: 10.1016/j.jcct.2020.08.007. Epub 2020 Aug 20. J Cardiovasc Comput Tomogr. 2021. PMID: 32863155 Review. No abstract available.
Cited by
-
Computed Tomography Angiography Identified High-Risk Coronary Plaques: From Diagnosis to Prognosis and Future Management.Diagnostics (Basel). 2024 Aug 1;14(15):1671. doi: 10.3390/diagnostics14151671. Diagnostics (Basel). 2024. PMID: 39125547 Free PMC article. Review.
-
Advances in Artificial Intelligence-Assisted Coronary Computed Tomographic Angiography for Atherosclerotic Plaque Characterization.Rev Cardiovasc Med. 2024 Jan 15;25(1):27. doi: 10.31083/j.rcm2501027. eCollection 2024 Jan. Rev Cardiovasc Med. 2024. PMID: 39077649 Free PMC article. Review.
-
Quantitative plaque characterization, pericoronary fat attenuation index, and fractional flow reserve: a novel method for differentiating between stable and unstable angina pectoris in a case-control study.Quant Imaging Med Surg. 2025 Feb 1;15(2):1139-1150. doi: 10.21037/qims-24-1031. Epub 2025 Jan 22. Quant Imaging Med Surg. 2025. PMID: 39995706 Free PMC article.
-
Perivascular adipose tissue as a source of therapeutic targets and clinical biomarkers.Eur Heart J. 2023 Oct 12;44(38):3827-3844. doi: 10.1093/eurheartj/ehad484. Eur Heart J. 2023. PMID: 37599464 Free PMC article. Review.
-
Artificial intelligence in coronary computed tomography angiography: Demands and solutions from a clinical perspective.Front Cardiovasc Med. 2023 Feb 16;10:1120361. doi: 10.3389/fcvm.2023.1120361. eCollection 2023. Front Cardiovasc Med. 2023. PMID: 36873406 Free PMC article. Review.
References
-
- Arbab-Zadeh A, Fuster V. From Detecting the Vulnerable Plaque to Managing the Vulnerable Patient. J Am Coll Cardiol 2019;74:1582. - PubMed
-
- Bourantas CV, Garcia-Garcia HM, Torii R et al. Vulnerable plaque detection: an unrealistic quest or a feasible objective with a clinical value? Heart 2016;102:581–9. - PubMed
-
- Poon M, Lesser JR, Biga C et al. Current Evidence and Recommendations for Coronary CTA First in Evaluation of Stable Coronary Artery Disease. J Am Coll Cardiol 2020;76:1358–1362. - PubMed
Publication types
MeSH terms
Grants and funding
LinkOut - more resources
Full Text Sources
Medical
Miscellaneous
