. 2022 Apr;20(2):223-245.
doi: 10.1016/j.gpb.2022.04.002. Epub 2022 May 2.

Dissecting Human Gonadal Cell Lineage Specification and Sex Determination Using A Single-cell RNA-seq Approach

Affiliations

Dissecting Human Gonadal Cell Lineage Specification and Sex Determination Using A Single-cell RNA-seq Approach

Rui Wang et al. Genomics Proteomics Bioinformatics. 2022 Apr.

Abstract

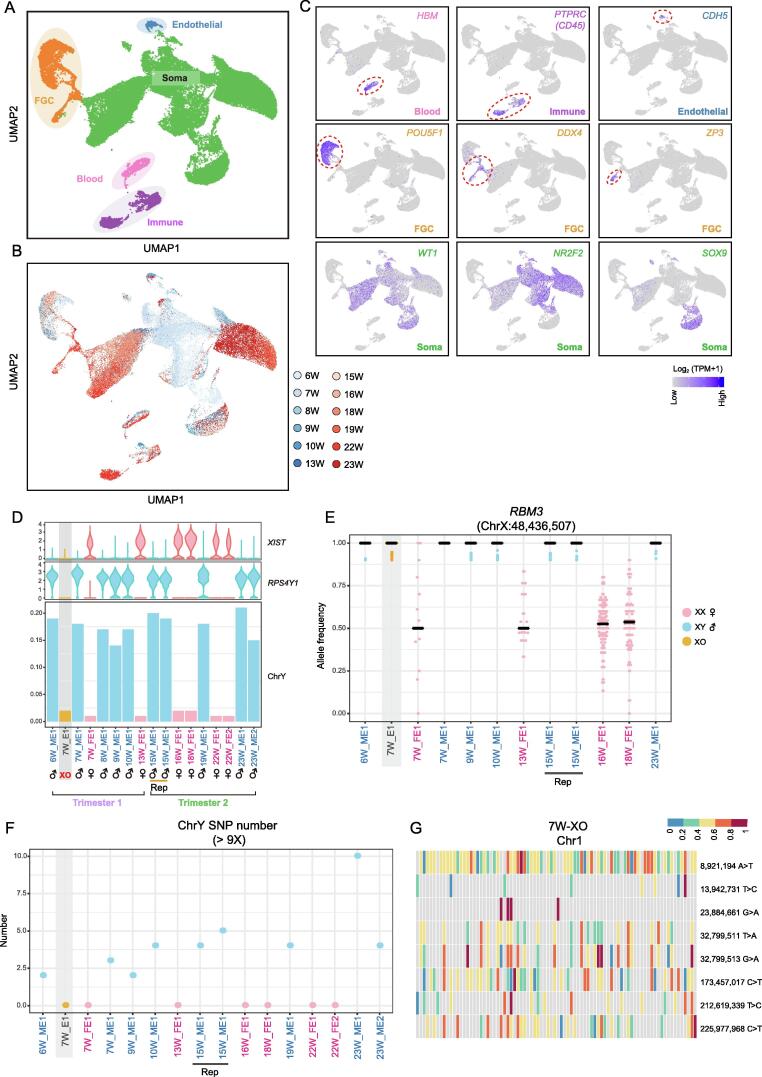
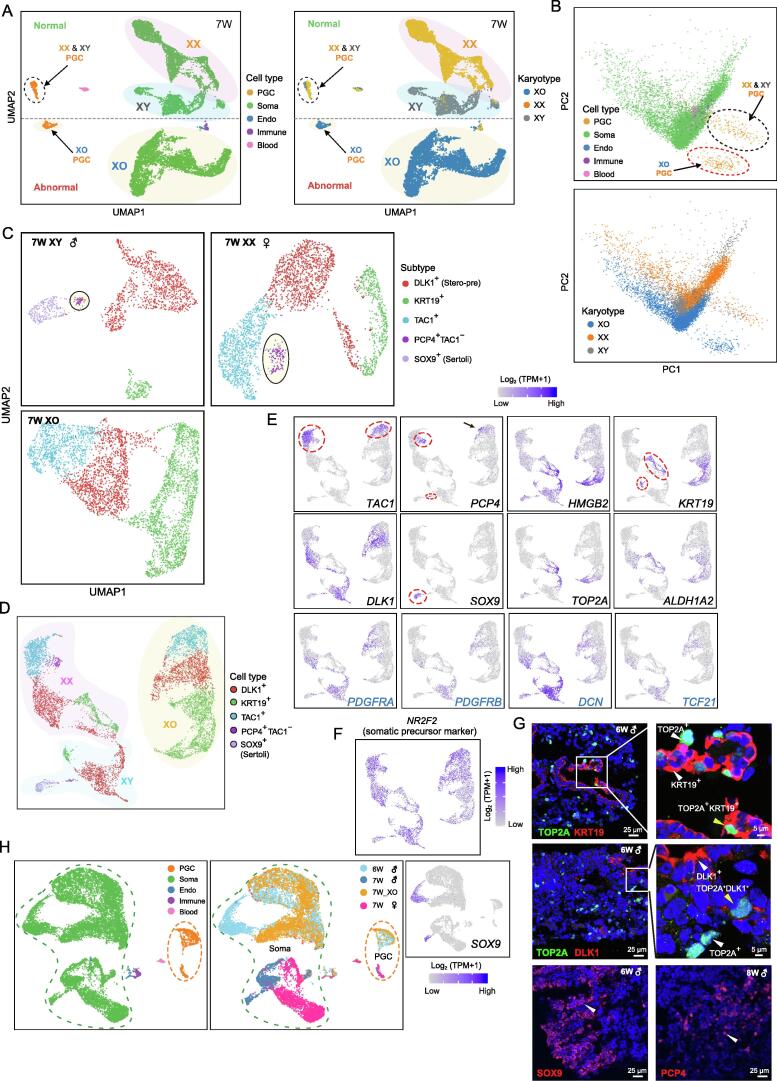
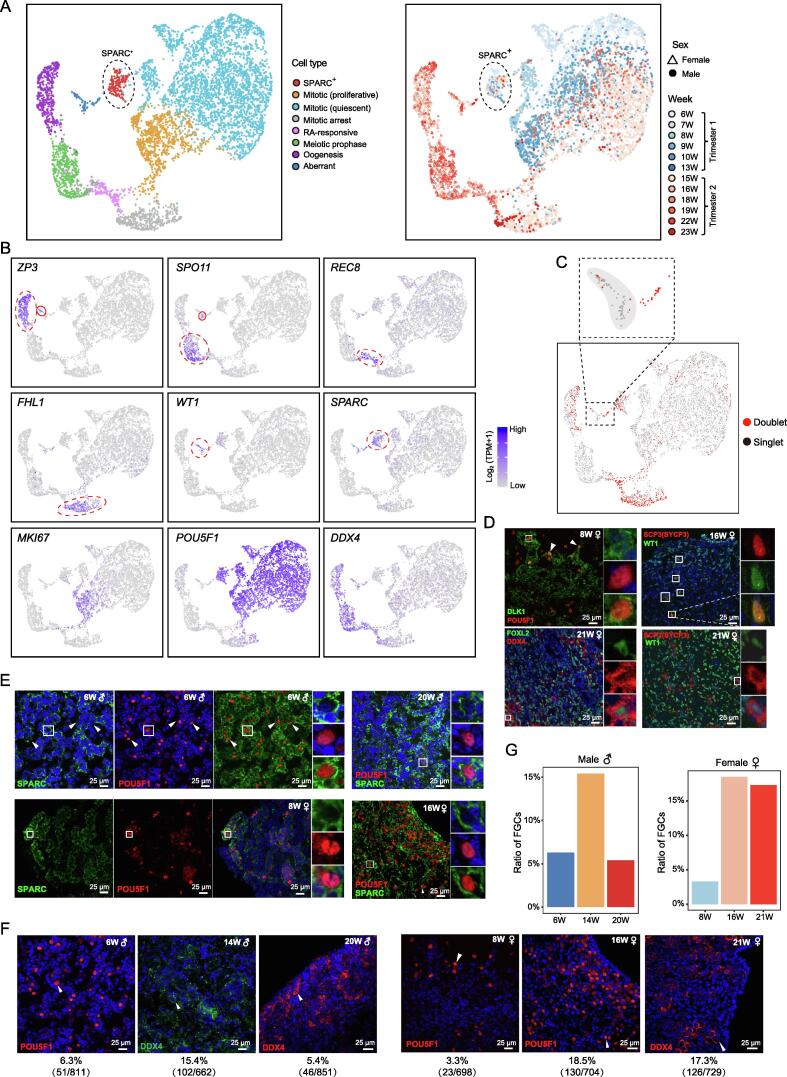
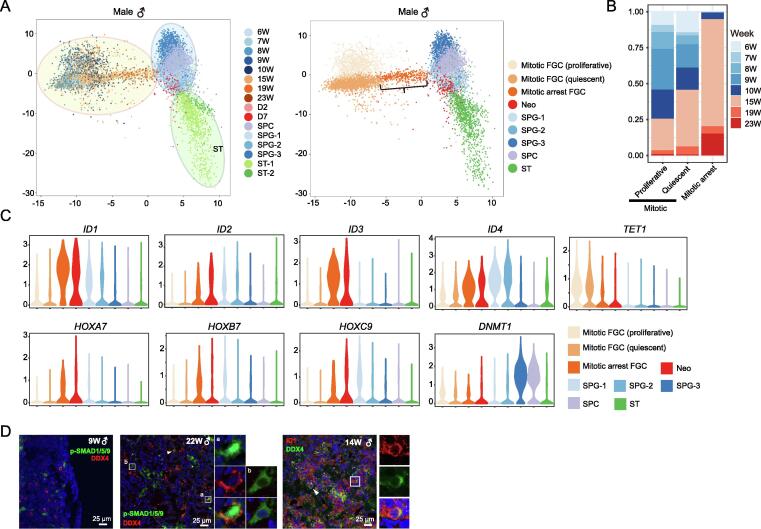
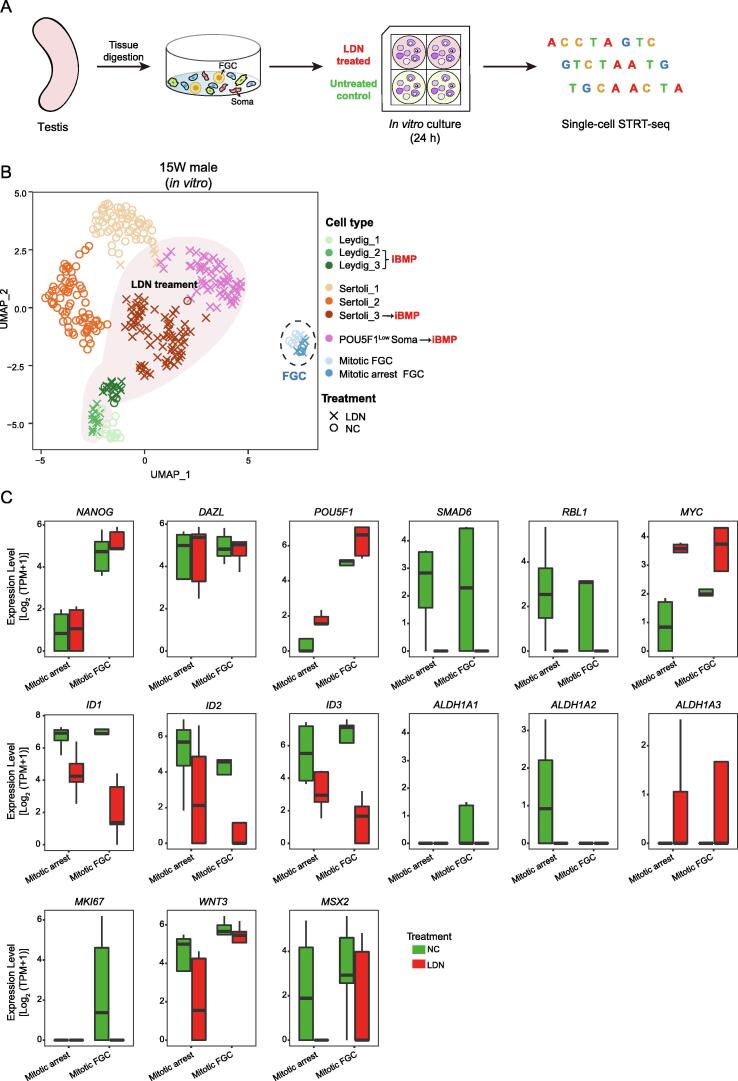
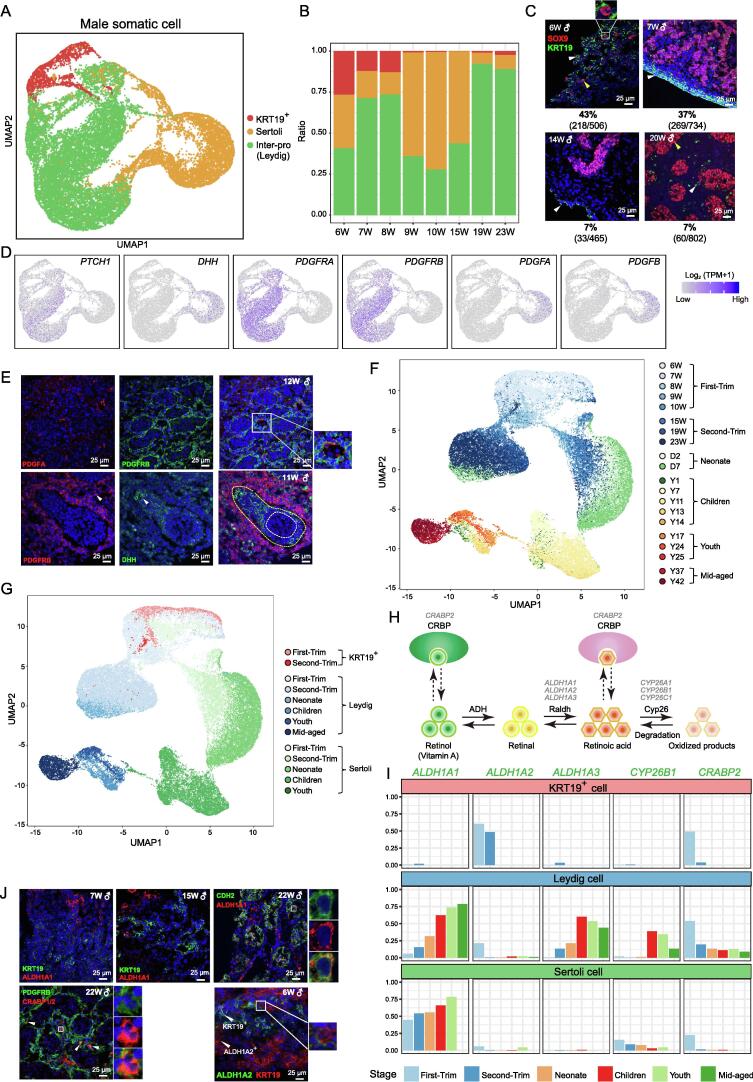
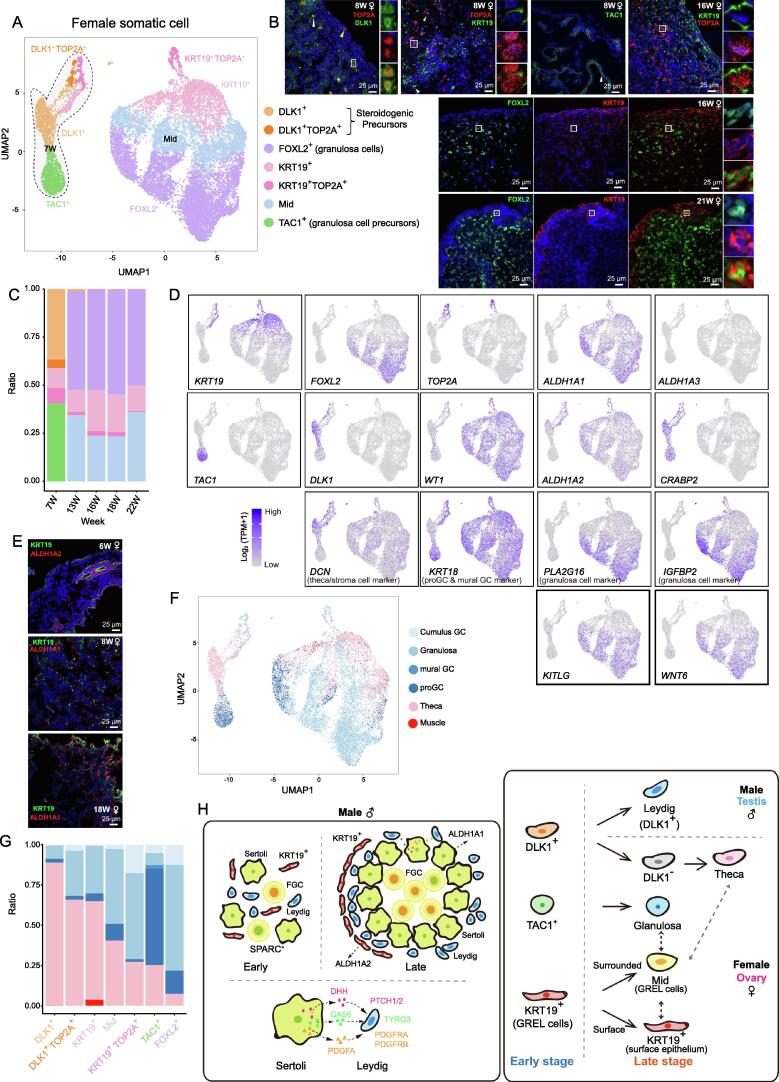
Gonadal somatic cells are the main players in gonad development and are important for sex determination and germ cell development. Here, using a time-series single-cell RNA sequencing (scRNA-seq) strategy, we analyzed fetal germ cells (FGCs) and gonadal somatic cells in human embryos and fetuses. Clustering analysis of testes and ovaries revealed several novel cell subsets, including POU5F1+SPARC+ FGCs and KRT19+ somatic cells. Furthermore, our data indicated that the bone morphogenetic protein (BMP) signaling pathway plays cell type-specific and developmental stage-specific roles in testis development and promotes the gonocyte-to-spermatogonium transition (GST) in late-stage testicular mitotic arrest FGCs. Intriguingly, testosterone synthesis function transitioned from fetal Sertoli cells to adult Leydig cells in a stepwise manner. In our study, potential interactions between gonadal somatic cells were systematically explored and we identified cell type-specific developmental defects in both FGCs and gonadal somatic cells in a Turner syndrome embryo (45, XO). Our work provides a blueprint of the complex yet highly ordered development of and the interactions among human FGCs and gonadal somatic cells.

Keywords: Gonocyte-to-spermatogonium transition; Human gonad; Leydig-Sertoli cell–cell interaction; Turner syndrome; scRNA-seq.


Figures

Figure 1
Figure 1
Identification of cell types and sex determination for human fetal gonads A. UMAP cluster map revealing the major human fetal gonadal cell types. In this study, all germ cells collected from embryos and fetuses were called FGCs, while germ cells collected from embryos before 8 W post conception were also called PGCs. Different colors represent different cell types. Detailed information is shown in Table S1. B. UMAP cluster map revealing the developmental stages of fetal gonadal cells. C. UMAP cluster maps showing the expression of cell type-specific genes. Colors from gray to purple represent low to high expression levels. Dashed lines highlight the cells that highly express specific genes. D. Violin plots showing the expression of sex-linked genes (XIST on the X chromosome and RPS4Y1 on the Y chromosome) for each embryo. Bar plot showing the ratio of reads mapped to the Y chromosome. Pink represents female embryos, sky blue represents male embryos, and orange represents the XO embryo. E. Dot plot showing the allele frequency of the X chromosome inactivation escape gene RBM3 in each embryo. One dot represents one cell. Only cells for which at least 9 reads were detected at this location are shown. The Y-axis represents the allele frequency of position ChrX:48,436,507, and the X-axis indicates different embryos/fetuses. The color of each dot represents the karyotype of the cell. If the embryo is female with two X chromosomes, then it should have a heterozygous SNP in the X chromosome inactivation escape region. In contrast, a male embryo with only one X chromosome should have a homozygous SNP. Inactivation of the X chromosome in female embryos will also lead to detection of a homozygous SNP. Therefore, it is necessary to determine sex by evaluating SNPs in the X chromosome inactivation escape region. F. Dot plot showing the number of SNPs located on the Y chromosome for each embryo. If an embryo does not contain a Y chromosome, then theoretically no such SNPs will be detected, i.e., SNPs on the Y chromosome will not detected in female or XO embryos. Only SNPs for which at least 9 reads were detected at this location are shown. G. Heatmap showing the detected SNP frequency on chromosome 1 of a 7 W (45, XO) embryo. Colors from blue to red represent low to high allele frequencies. Only positions with SNPs in at least 5 individual cells with more than 9 sequence reads are shown. Most of cells exhibited heterozygous SNPs on chromosome 1. Each column represents a single cell. FGC, fetal germ cell; PGC, primordial germ cell; Soma, the supporting cell lineage and steroidogenic cell lineage in gonads; W, week; UMAP, uniform manifold approximation and projection; SNP, single nucleotide polymorphism; Rep, technical replicate; XO, a Turner syndrome embryo with monosomy X (45, XO); E, embryo; ME, male embryo; FE, female embryo; Chr, chromosome.
Figure 2
Figure 2
Comparison of the transcriptome profiles of 7 W XO and normal XX and XY embryos A. UMAP cluster maps revealing the major cell types and karyotypes of three 7 W-old embryos (45, XO; 46, XX; and 46, XY). Different colors represent different cell types (left) and karyotypes (right). The dashed black line separates the single cells from normal embryos (46, XX and 46, XY) and abnormal embryo (45, XO). Arrows indicate the location of PGCs, and normal embryo PGCs are highlighted with a dashed black circle. B. PCA cluster maps revealing the major cell types and karyotypes of cells. Different colors represent different cell types (top) and karyotypes (bottom). C. UMAP cluster maps revealing the major somatic cell types in each 7 W embryo. The black circles highlight the cell population that exists in only normal embryos (46, XX and 46, XY). D. UMAP clustering of all 7 W gonadal somatic cells, including one abnormal embryo (45, XO), one male embryo (46, XY), and one female embryo (46, XX). Colors represent the different cell types identified in (C). Detailed information is shown in Table S2. E. UMAP cluster maps showing the expression of genes used to identify cell types. In the XO embryo, PCP4 was expressed by some TAC1+ cells, but the PCP4+TAC1 cells were not observed. Genes with names in blue are steroidogenic cell lineage markers. Colors from gray to purple represent low to high expression levels. F. UMAP cluster map showing the expression of somatic precursor marker NR2F2 in all three 7 W embryonic somatic cells. Colors from gray to purple represent low to high expression levels. G. Immunostaining for TOP2A, KRT19, DLK1, ALDH1A2, SOX9, and PCP4 in early-stage fetal testes. H. UMAP clustering of all 7 W embryos and one 6 W embryo. Different colors represent different cell types (left) and embryos (right). The expression of the Sertoli cell marker SOX9 was projected onto the UMAP. Colors from gray to purple represent low to high expression levels. SOX9+ Sertoli cells existed in only male embryos (6 W and 7 W male embryos). PCA, principal component analysis; PC, principal component; Endo, endothelial.
Figure 3
Figure 3
FGC subtype identification and verification A. Two-dimensional embedding of all fetal gonadal germ cells using UMAP. The cells are colored according to cell type (left) and gestational age (right). The shape indicates cells from male or female embryos. Dashed black circles highlight SPARC+ FGCs. B. UMAP cluster maps showing the expression patterns of known FGC markers. Red circles highlight cells that express specific marker genes. Colors from gray to purple represent low to high expression levels. C. UMAP cluster map showing the distribution of doublet. D. Immunostaining of markers of somatic cells and germ cells in fetal ovaries to validate the existence of cells expressing both somatic cell and germ cell markers. DLK1, FOXL2, and WT1 are somatic cell markers. POU5F1, SCP3 (also known as SYCP3), and DDX4 are germ cell markers. E. Immunostaining of male testes (6 W and 20 W) and female ovaries (8 W and 16 W) to verify the existence of the SPARC+POU5F1+ FGC subtype and its spatial distribution. Cells inside the white square are magnified and shown on the right of the corresponding image. F. Immunostaining of 8 W, 14 W, and 20 W testes and 8 W, 16 W, and 21 W ovaries. The percentage of FGCs for each stage is shown. G. Bar plots showing the ratios of FGCs at several developmental ages calculated by immunofluorescence showed in (F). RA, retinoic acid.
Figure 4
Figure 4
GST characterization of male gonadal cells A. Combined analysis of fetal, neonatal, and adult male germ cells by PCA. The cells are colored by cell type and developmental stage. B. Bar plot showing the developmental stage distribution of three male FGCs. The color represents developmental stage. C. Violin plot showing the trajectory expression patterns in male germ cells from fetal (6–23 W), neonatal, and adult testes. D. Immunostaining of the germ cell marker DDX4, the BMP signaling pathway component p-SMAD1/5/9, and a BMP signaling pathway target ID1 in fetal testes (9 W, 14 W, and 22 W). Cells inside the white squares are magnified and shown on the right of the corresponding images. The white square with symbol “a” highlights the germ cells that expressed p-SMAD1/5/9 in the nucleus, while the white square with symbol “b” highlights the germ cells that expressed p-SMAD1/5/9 in the cytoplasm. Neo, neonatal; D2, day 2 after birth; D7, day 7 after birth; SPG, spermatogonium; SPC, spermatocyte; ST, spermatid; GST, gonocyte-to-spermatogonium transition.
Figure 5
Figure 5
Transcriptional changes after blockage of the BMP signaling pathway A. The schematic illustrating the in vitro culture and blockade of the BMP signaling pathway in male testicular cells. B. Two-dimensional embedding of cultured 15 W testicular cells using UMAP. The cells are colored according to cell type. The shapes represent cells subjected to different treatments. FGCs are highlighted with a black dashed circle. The shadow roughly frames the LDN-treated cells. C. Boxplots showing the expression level [log2 (TPM + 1)] of germ cell marker genes (NANOG, DAZL, and POU5F1), BMP signaling pathway-related genes (SMAD6, RBL1, MYC, ID1, ID2, and ID3), RA-synthesizing genes (ALDH1A1, ALDH1A2, and ALDH1A3), and a WNT signaling pathway-related gene (WNT3) in mitotic arrest FGCs and mitotic FGCs. Different colors represent different experimental treatments. LDN, BMP signaling pathway inhibitor; STRT-seq, single-cell tagged reverse transcription sequencing.
Figure 6
Figure 6
Characteristics of male somatic cells and analysis of cellcell interactions A. Identification of fetal male testicular somatic cell subsets by clustering analysis using UMAP. Different colors represent different cell populations. B. Bar plot showing the cell type distributions at different developmental stages. C. Immunostaining of SOX9 and KRT19 at different stages. SOX9+ and KRT19+ cells are indicated by yellow and white triangles, respectively. SOX9+KRT19+ cells are framed with a white square and the corresponding image is magnified. The ratio of KRT19+ cells at each week is shown below the corresponding image. D. UMAP cluster maps showing the expression of the receptor-coding genes PTCH1, PDGFRA, and PDGFRB in Leydig cells and the ligand-coding genes DHH, PDGFA, and PDGFB in Sertoli cells. E. Immunostaining of PDGFRB, PDGFA, and DHH in male testes. Cells in the white square are magnified and shown on the right. FGCs are located inside the white dotted line. Sertoli cells are located in the area between the white and yellow dotted lines. Leydig cells are located outside the yellow dotted line. F. Combined analysis of male somatic cells from fetal, neonatal, pubertal, and adult individuals by UMAP cluster mapping. Color represents age. G. Combined analysis of male somatic cells from fetal, neonatal, pubertal, and adult individuals by UMAP cluster mapping. Color represents cell type and age. H. Diagrammatic representation of genes involved in RA synthesis and metabolism in gonads. I. Bar plot showing the ratio of cells expressing RA-synthesizing and RA-metabolizing genes specific to different cell populations at different stages. J. Immunostaining of RA signaling pathway-related proteins (ALDH1A1, ALDH1A2, and CRABP1/2), and KRT19 (KRT19+ cell marker), and PDGFRB (Leydig cell marker) in fetal testes at different stages. The areas in the white squares are magnified and arrows indicate PDGFRB+CRABP1/2+ cells, KRT19+ cells, and ALDH1A2+ cells. Inter-pro, interstitial progenitor cell.
Figure 7
Figure 7
Identification of divergent populations of female somatic cells and their precursor cells A. Identification of fetal female ovarian somatic cell subsets by UMAP clustering analysis. The different colors represent different cell populations. Cells from 7 W ovary are indicated with the black dashed line. Mid, cells co-expressing low levels of FOXL2 and KRT19. B. Immunostaining of cell type-specific markers to validate the existence of the ovarian somatic subtypes shown in (A). Cells inside the white squares are magnified and shown on the right of the corresponding images. C. Bar plot showing the cell type distributions at different stages. Different colors represent different cell types. The color corresponding to each cell type is the same as that shown in (A). D. UMAP cluster map showing the expression patterns of cell type-specific genes and RA signaling-associated genes. Colors from gray to purple represent low to high expression levels. E. Immunostaining of ALDH1A1/ALDH1A2 and KRT19 in ovaries of different stages. F. UMAP cluster map showing the cell types that map to adult ovarian cells. G. Bar plot revealing the relationship between fetal and adult ovarian cell types. H. Summary diagram of male and female gonadal development. The solid arrows represent our hypothesis, and the dotted arrows indicate uncertainty based on current knowledge. proGC, progenitor granulosa cell; GREL, gonadal ridge epithelial-like.

Comment in

Similar articles

Cited by

References

    1. Achermann JC, Hughes IA. Disorders of sex development. In: Melmed S, Polonsky KS, Larsen PR, Kronenberg HM, editors. Williams Textbook of Endocrinology. 12th ed. Amsterdam: Elsevier Inc; 2011, p.868–934.
    1. Saitou M., Yamaji M. Primordial germ cells in mice. Cold Spring Harb Perspect Biol. 2012;4:a008375. - PMC - PubMed
    1. Taketo T. The role of sex chromosomes in mammalian germ cell differentiation: can the germ cells carrying X and Y chromosomes differentiate into fertile oocytes? Asian J Androl. 2015;17:360–366. - PMC - PubMed
    1. Kurek M., Albalushi H., Hovatta O., Stukenborg J.B. Human pluripotent stem cells in reproductive science — a comparison of protocols used to generate and define male germ cells from pluripotent stem cells. Int J Mol Sci. 2020;21:1028. - PMC - PubMed
    1. She Z.Y., Yang W.X. Sry and SoxE genes: how they participate in mammalian sex determination and gonadal development? Semin Cell Dev Biol. 2017;63:13–22. - PubMed

Publication types