. 2022 May 5;13(1):2464.
doi: 10.1038/s41467-022-30022-2.

Epigenetic changes induced by in utero dietary challenge result in phenotypic variability in successive generations of mice

Affiliations

Epigenetic changes induced by in utero dietary challenge result in phenotypic variability in successive generations of mice

Mathew Van de Pette et al. Nat Commun. .

Abstract

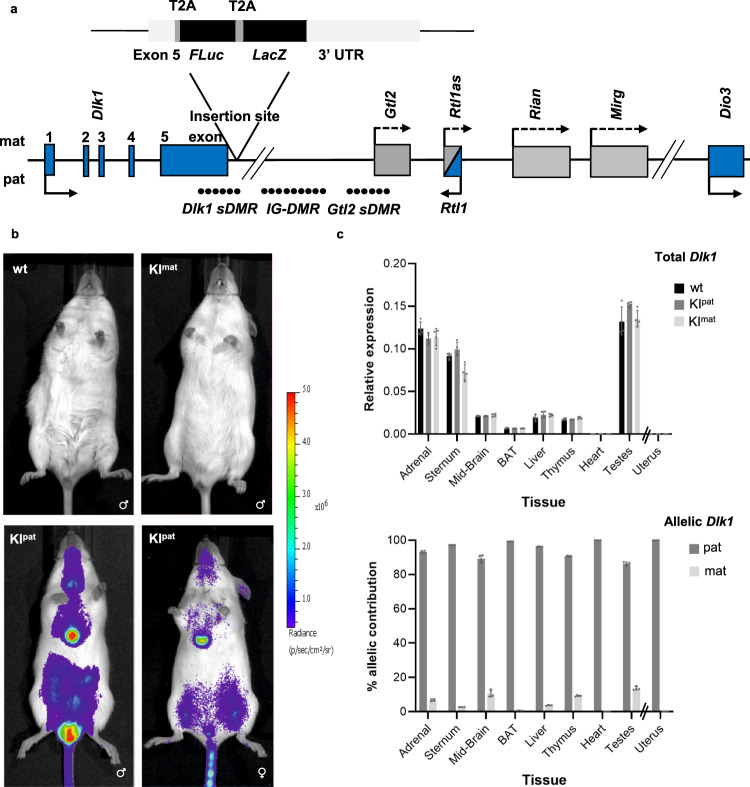
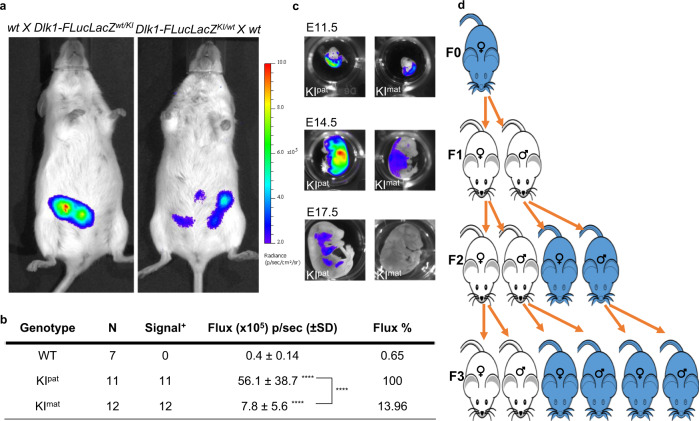
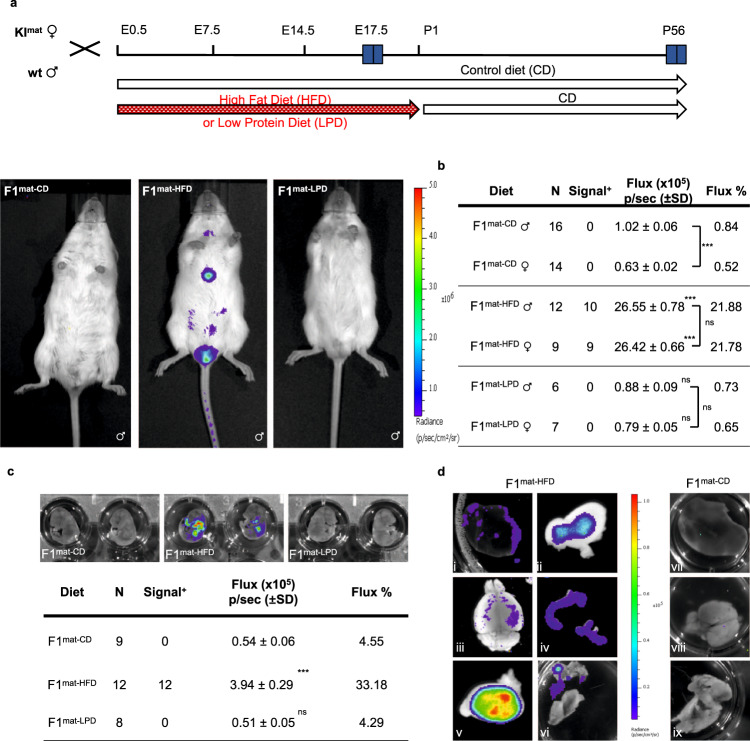
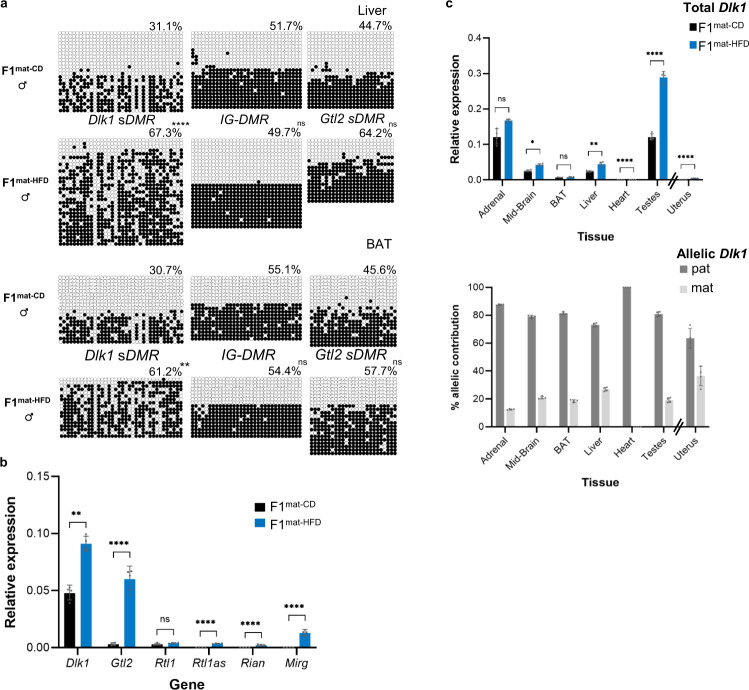
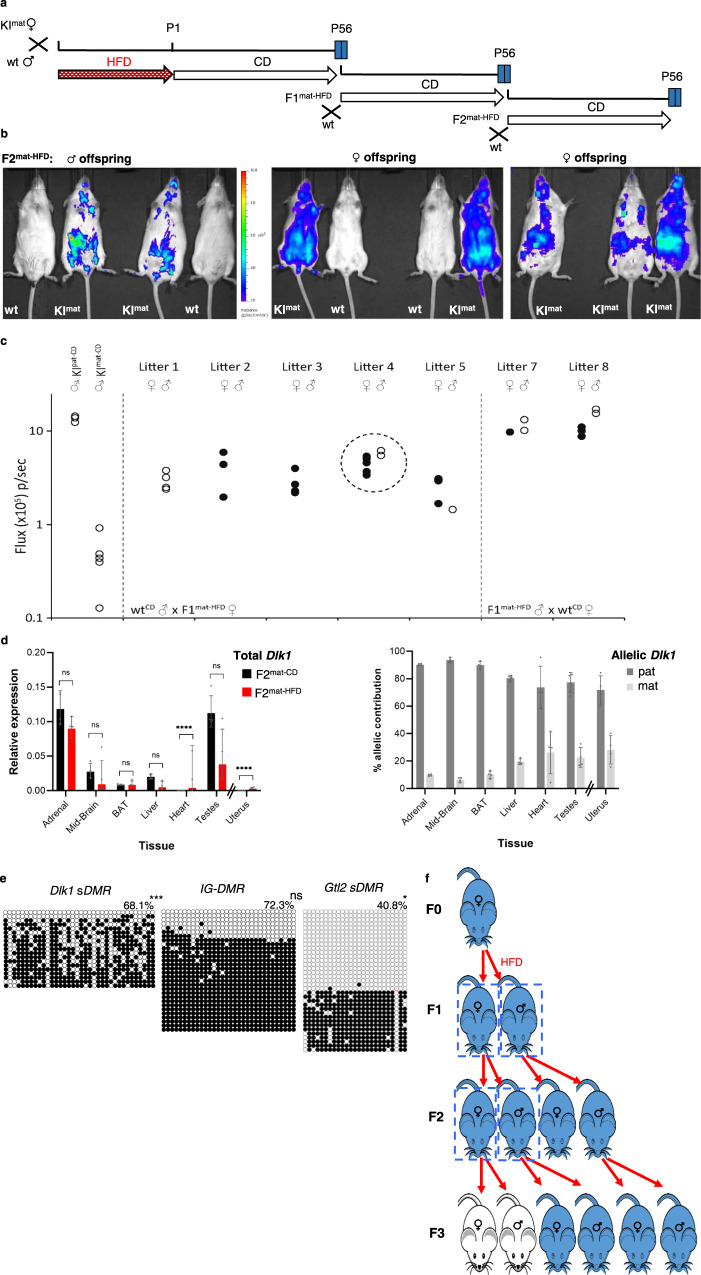
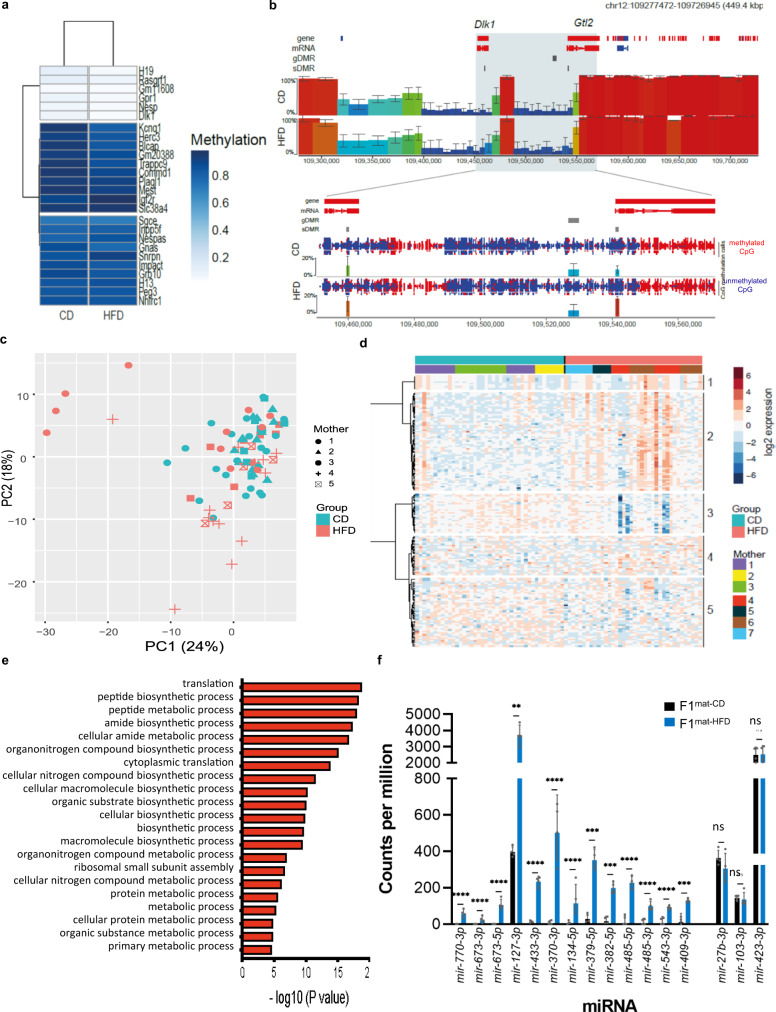
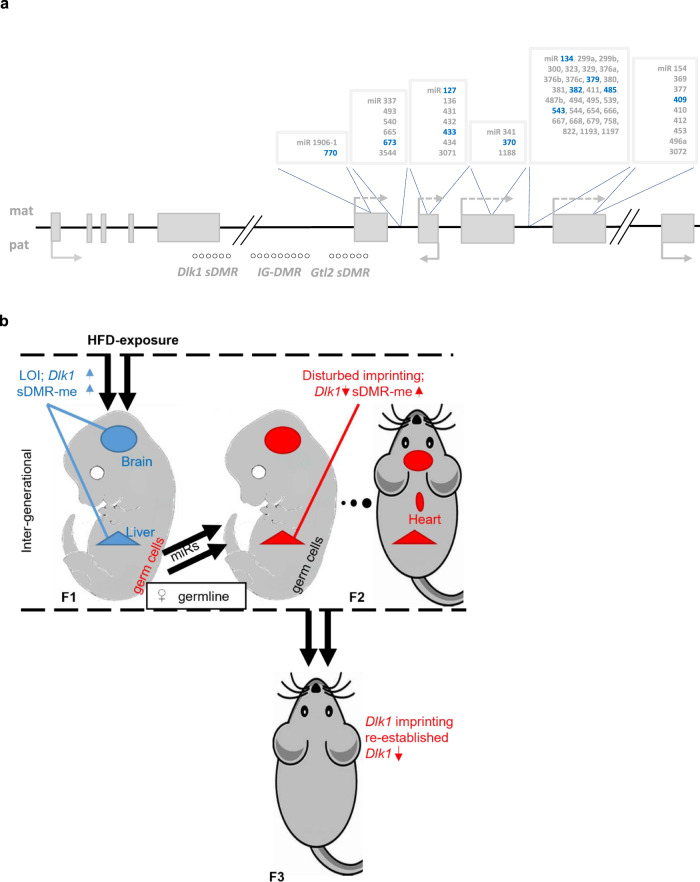
Transmission of epigenetic information between generations occurs in nematodes, flies and plants, mediated by specialised small RNA pathways, modified histones and DNA methylation. Similar processes in mammals can also affect phenotype through intergenerational or trans-generational mechanisms. Here we generate a luciferase knock-in reporter mouse for the imprinted Dlk1 locus to visualise and track epigenetic fidelity across generations. Exposure to high-fat diet in pregnancy provokes sustained re-expression of the normally silent maternal Dlk1 in offspring (loss of imprinting) and increased DNA methylation at the somatic differentially methylated region (sDMR). In the next generation heterogeneous Dlk1 mis-expression is seen exclusively among animals born to F1-exposed females. Oocytes from these females show altered gene and microRNA expression without changes in DNA methylation, and correct imprinting is restored in subsequent generations. Our results illustrate how diet impacts the foetal epigenome, disturbing canonical and non-canonical imprinting mechanisms to modulate the properties of successive generations of offspring.


Conflict of interest statement

The authors declare no competing interests.

Figures

Fig. 1
Fig. 1. Generation and characterisation of reporter mice for imprinted Dlk1 expression.
a Schematic of the mouse Dlk1-Dio3 imprinted locus showing reporter insertion. Three differentially methylated regions (DMRs) that regulate imprinted expression of the cluster are indicated (closed circles represent methylated CpGs, IG-DMR, Dlk1 sDMR and Gtl2 sDMR) and the position of maternally expressed (light grey) and paternally expressed (blue) genes are shown. Arrows depict transcriptional direction, with solid lines representing protein-coding genes and striped lines representing non-coding transcripts. In the Dlk1-FLucLacZ reporter line, firefly Luciferase (FLuc) and β–galactosidase (LacZ) were knocked into the endogenous Dlk1 locus, with T2A sites, downstream of exon 5. b Bioluminescence (BL, blue) was detected in 8-week-old (P56) male (lower panel, left) and female mice (lower panel, right) after paternal transmission of the reporter (KIpat). Strong BL signal was evident in the thymus, central sternum and testes. Minimal signal was detected in animals after maternal reporter transmission (KImat, upper panel, right) or in wild-type animals (wt, upper panel, left). c Dlk1 expression analysed by QRT-PCR (upper panel) was compared in different tissues from P56 male mice that inherited the reporter paternally (KIpat, dark grey), maternally (KImat, light grey), or in non-transgenic controls (wt, black). Uterus samples from age-matched female mice were also analysed. Expression levels were normalized to β-Actin, 18S and Hprt expression (bars show the geometric mean of relative expression, error bars represent the geometric standard deviation (geometric SD)). Genotype had no significant effect on Dlk1 expression (Two-way ANOVA on delta-Ct values (Tissue p < 0.0001, Genotype p = 0.86, Interaction p = 0.98); N = 4 + 4 + 4 individual mice). Allelic Dlk1 analysis in KImat mice (lower panel), using primers that distinguish the reporter from the wt allele, showed a strong bias for paternal allele expression (dark grey) compared to maternal allele expression (light grey). (Bars indicate the mean contribution from each allele ±SD; N = 4 + 4 individual mice). Source data are provided as a Source Data file.
Fig. 2
Fig. 2. Inheritance of imprinted Dlk1 reporter expression in embryos and across generations.
a BL signal (blue) detected in Dlk1-FLucLacZ pregnancies arising from KIpat (left) and KImat (right) transmission showed greater surface signal in KIpat pregnancies (E11.5). b Quantification of BL signal (Flux) detected in E11.5 Dlk1-FLucLacZ embryos following dissection, demonstrating higher levels of signal from KIpat than KImat embryos. BL signal in wt and KImat embryos is shown as a percentage of the average KIpat signal (number of embryos (N) indicated in table; One-way ANOVA on log-transformed data (p < 0.0001); results of Holm-Šídák’s multiple comparisons follow-up test are shown for comparisons to wt mice, and between KIpat/KImat mice as indicated: ****adjusted p (padj) < 0.0001). Source data are provided as a Source Data file. c BL imaging of embryos at different stages (E11.5, E14.5 and E17.5) showed progressive reduction in signal (blue) in both KIpat (left panel) and KImat (right panel) through gestation; signal was readily detected in E11.5 and E14.5 KIpat and KImat embryos, but at later stages (E17.5) was only seen after paternal transmission. Signal intensity scales are equalised between images. d Transmission of mono-allelic imprinted Dlk1 reporter expression in four generations (F0, F1, F2, F3); upon paternal inheritance of Dlk1-FLucLacZ the reporter was expressed (blue), while maternal inheritance resulted in reporter silencing (white). Imprinting was predictably re-set across generations, through both germlines (a minimum of two independent litters were analysed per generation and reciprocal cross).
Fig. 3
Fig. 3. Exposure to high fat diet in utero results in loss of Dlk1 imprinting in offspring.
a Temporal scheme of experimental breeding, dietary regime and bioluminescent image analysis. Offspring inheriting Dlk1-FLucLacZ maternally (KImat) were generated by mating wt males with heterozygous Dlk1-FLucLacZ females; upon detection of a vaginal plug pregnant females were maintained on a control (CD) diet or switched to low protein diet (LPD), or high fat diet (HFD), for the duration of the pregnancy. At birth, all animals were maintained on CD and BL imaging was performed on reporter offspring at the times indicated (E17.5 and postnatal day 56). Increased BL signal (blue) was evident in P56 mice that had been exposed to gestational HFD (F1mat-HFD, middle image), as compared to either CD or LPD-exposed animals (F1mat-CD, F1mat-LPD, left and right, respectively). b Abdominal bioluminescence signal was significantly increased in F1mat-HFD offspring (P56) as compared to F1mat-CD or F1mat-LPD. BL signal in F1mat-HFD animals was less than that in dietary control animals that inherited the reporter paternally (KIpat-CD), suggesting a partial release of silencing. (Number of animals (N) indicated in table; Two-way ANOVA on log-transformed data (Diet p < 0.0001; Sex p = 0.049; Interaction p = 0.0046); results of Holm-Šídák’s multiple comparisons follow-up test are shown: ***padj = 0.0004, ****padj < 0.0001, ns=not significant). Source data are provided as a Source Data file. c BL signal (blue) in E17.5 embryos from F1mat-HFD, F1mat-LPD and F1mat-CD are compared (upper panel) and quantified (lower panel showing Flux levels relative to KIpat-CD controls). BL signals were significantly higher in F1mat-HFD than F1mat-LPD and F1mat-CD embryos. (Number of embryos (N) indicated in table; One-way ANOVA on log-transformed data (p < 0.0001); results of Dunnett’s multiple comparisons follow-up test comparing to F1mat-CD embryos are shown: ****padj < 0.0001, ns=not significant). Source data are provided as a Source Data file. d BL signal (blue) detected ex vivo in organs of male P56 F1mat-HFD animals (left panels: i- liver, ii- white adipose, iii- brain, iv- uterus (taken from female animals), v- testes, vi- brown adipose tissue). Control tissues from P56 F1mat-CD animals (right panels: vii- liver, viii- brain, ix- brown adipose) are shown for comparison.
Fig. 4
Fig. 4. Altered DNA methylation and allelic mis-expression of Dlk1 in offspring exposed to HFD in utero.
a DNA bisulphite methylation analysis at Dlk1 sDMR, IG-DMR and Gtl2 sDMR in liver (upper) and brown adipose tissue (BAT) (lower) from representative male P56 F1mat-CD and F1mat-HFD animals. In liver and BAT, hypermethylation was detected at Dlk1 sDMR, increased methylation was observed at the Gtl2 sDMR (not statistically significant), but IG-DMR was unchanged. Closed circles indicate methylated CpGs, open circles un-methylated CpGs. Each row represents an individual clone. Percentages indicate total methylation level of the region from two wt and two KImat animals. (Kolmogorov-Smirnov test comparing clonal methylation levels, using Holm-Šídák’s correction for multiple comparisons: **padj < 0.0055, ****padj = 6 × 10−6, ns=not significant). Source data are provided as a Source Data file. b Gene expression (QRT-PCR) at the Dlk1-Dio3 cluster in the liver of male P56 F1mat-HFD (blue) and F1mat-CD (dark grey) animals. Expression levels for this single tissue comparison were normalised to β-Actin expression. (Bars show the geometric mean of relative expression with geometric SD; N = 4 + 4 individual mice; unpaired two-sided t-tests on delta-Ct values with Holm-Šídák’s correction for multiple comparisons: **padj = 0.0067, ****padj < 0.0001, ns=not significant). Source data are provided as a Source Data file. c Dlk1 expression (QRT-PCR, upper panel) in different tissues from P56 male mice exposed to either control (F1mat-CD, black) or high-fat diet (F1mat-HFD, blue). Uterus samples from age-matched female mice were also analysed. Expression levels were normalised to β-Actin, 18S and Hprt. (Bars show the geometric mean of relative expression with geometric SD; N = 4 + 4 individual mice; Two-way ANOVA on delta-Ct values (Tissue p < 0.0001, Diet p < 0.0001, Interaction p < 0.0001); results of Holm-Šídák’s multiple comparisons follow-up test for effect of diet in each tissue are shown: *padj = 0.013, **padj = 0.0042, ****padj < 0.0001, ns=not significant). Allelic Dlk1 analysis in F1mat-HFD mice (lower panel), using primers that distinguish the reporter from the wt allele, showed a reduced contribution for paternal allele expression (dark grey) when compared to maternal allele expression (light grey). (Bars indicate the mean contribution from each allele ±SD; N = 4 + 4 individual mice). Source data are provided as a Source Data file.
Fig. 5
Fig. 5. Exposure-induced changes to Dlk1 imprinting are transmitted to F2 offspring.
a Schematic for generational studies following HFD exposure. Gestationally exposed animals (Dlk1-FLucLacZ F1mat-HFD) were bred with wt (CD-fed) mates, maintained on CD, and F2 and F3 offspring examined. b BL signal (blue) in F2 offspring (F2mat-HFD) derived from F1 HFD-exposed females. Signal was variable and ectopic. c Abdominal BL signal in P56 F2mat-HFD males (open-circles) and females (filled-circles), from six F1mat-HFD females and wtCD males (litters 1–5, no litter from female 6) or two F1mat-HFD males and wtCD females (litters 7–8). KImat-CD and KIpat-CD signal shown for comparison. Litter 4 is represented in (b). Source data are provided as a Source Data file. d Dlk1 expression (QRT-PCR, left) in tissues from P56 males (uterus from females) whose mothers were exposed in utero to CD (F2mat-CD, black) or HFD (F2mat-HFD, red). Expression normalised to β-Actin, 18S and Hprt (bars show geometric mean with geometric SD; N = 4 + 4 individual mice; Two-way ANOVA on delta-Ct values (Tissue p < 0.0001, Diet p = 0.002, Interaction p < 0.0001); Holm-Šídák’s multiple comparisons follow-up test for diet in each tissue: ****padj < 0.0001, ns=not significant). Allelic Dlk1 analysis in F2mat-HFD mice (right) showed reduced paternal (dark grey) versus maternal (light grey) expression bias, compared to control conditions (bars indicate mean allelic contribution ±SD; N = 4 + 4 individual mice). Source data are provided as a Source Data file. e Bisulphite analysis in male P56 F2mat-HFD liver showed Dlk1 sDMR hyper-methylation, increased IG-DMR methylation (padj = 0.078) and slightly reduced Gtl2 sDMR methylation, compared to F1mat-CD (Fig. 4a). Closed circles: methylated CpG, open circles: un-methylated CpG. Rows show individual clones from a representative individual, percentages indicate total methylation from two animals. (Kolmogorov-Smirnov test comparing clonal methylation levels, using Holm-Šídák’s correction for multiple comparisons: *padj = 0.025, ***padj = 0.0001, ns=not significant). Source data are provided as a Source Data file. f Summary of altered Dlk1 expression following gestational HFD. Dlk1 is silent (white) when transmitted maternally and expressed (blue) when transmitted paternally. Gestational HFD exposure provokes LOI in F1 offspring (blue, box). F1 females transmit altered Dlk1 expression to F2 offspring (blue, box), whereas F1 males and F2 females transmit Dlk1 appropriately.
Fig. 6
Fig. 6. Germline DMRs in single MII oocytes from F1 females are unaffected by dietary exposure but show an altered transcriptional programme.
a Heatmap representing mean DNA methylation levels for each gametic (g)DMR in F1mat-CD and F1mat-HFD oocytes (merged from 41 and 37 oocyte scBS-seq datasets, respectively). b SeqMonk screenshot showing mean DNA methylation in F1mat-CD and F1mat-HFD oocytes over nonoverlapping 100 CpG windows (colour-coded blocks) across a ~450 kb interval encompassing the Dlk1-Dio3 imprinted cluster with a zoomed-in region (below) showing the CpG methylation calls (methylated red; un-methylated blue) of the Dlk1-Gtl2 region with quantification over the gDMR and sDMRs. Error bars represent the standard deviation from the mean of 5 pseudo-bulk groupings of 7-8 oocytes each. c Principal component analysis of scRNA-seq datasets of individual oocytes from F1mat-CD and F1mat-HFD. d Heatmap revealing 5 unsupervised clusters of the 166 most variable genes between F1mat-CD and F1mat-HFD oocytes. Top bars identify the F1 donor and diet groups. Clusters 1 to 5 comprised 25, 62, 44, 25 and 9 genes respectively. e Major terms highlighted in the gene ontology analysis of up-regulated genes from clusters 1, 2 and 4 (x-axis, -log10 of FDR adjusted p values). Gene ontology analysis was performed with GOrilla and summarised with Revigo. f Comparison of Dlk1-Dio3 microRNA (miRs) expression in F1mat-CD (black) and F1mat-HFD (blue) oocytes, alongside three stably expressed miRs (27b-3p, 103-3p, 423-3p), analysed by small RNA sequencing. Each of the Dlk1-Dio3 miRs was found to be significantly more represented in F1mat-HFD oocytes. (Bars represent mean counts per million ±SD; small RNA-seq libraries generated from oocytes from four female mice per group; unpaired two-sided t-tests with Holm-Šídák’s correction for multiple comparisons: **padj = 0.0013, ***padj = 0.0005, ****padj < 0.0001, ns=not significant). Source data are provided as a Source Data file.
Fig. 7
Fig. 7. Generational modulation of Dlk1-Dio3 imprinting in response to HFD exposure.
a Schematic of Dlk1-Dio3 cluster miRs that were over-expressed in F1mat-HFD oocytes, as compared to F1mat-CD. Over-represented miRs are displayed as blue, while non-expressed miRs are displayed as grey. b Schematic summarizing the modifications to Dlk1 imprinting across generations. Imprinting is disturbed inter-generationally but restored trans-generationally. Blue (increased) and red (decreased) arrows depict expression or methylation levels relative to controls.

References

    1. Klosin A, et al. Transgenerational transmission of environmental information in C. elegans. Science. 2017;356:320–323. doi: 10.1126/science.aah6412. - DOI - PubMed
    1. Paszkowski J, Grossniklaus U. Selected aspects of transgenerational epigenetic inheritance and resetting in plants. Curr. Opin. Plant Biol. 2011;14:195–203. doi: 10.1016/j.pbi.2011.01.002. - DOI - PubMed
    1. Samata, M., et al. Intergenerationally Maintained Histone H4 Lysine 16 Acetylation Is Instructive for Future Gene Activation. Cell. 182, 127–144.e23 (2020). - PubMed
    1. Gapp K, et al. Implication of sperm RNAs in transgenerational inheritance of the effects of early trauma in mice. Nat. Neurosci. 2014;17:667–669. doi: 10.1038/nn.3695. - DOI - PMC - PubMed
    1. Heard E, Martienssen RA. Transgenerational epigenetic inheritance: myths and mechanisms. Cell. 2014;157:95–109. doi: 10.1016/j.cell.2014.02.045. - DOI - PMC - PubMed

Publication types