

Estimating global economic well-being with unlit settlements
- PMID: 35513376
- PMCID: PMC9072384
- DOI: 10.1038/s41467-022-30099-9
Estimating global economic well-being with unlit settlements
Abstract
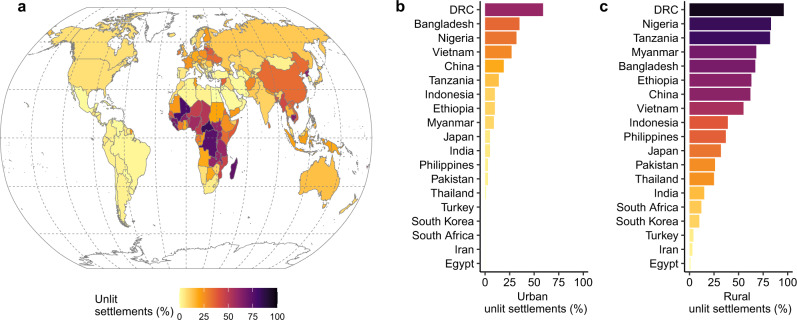
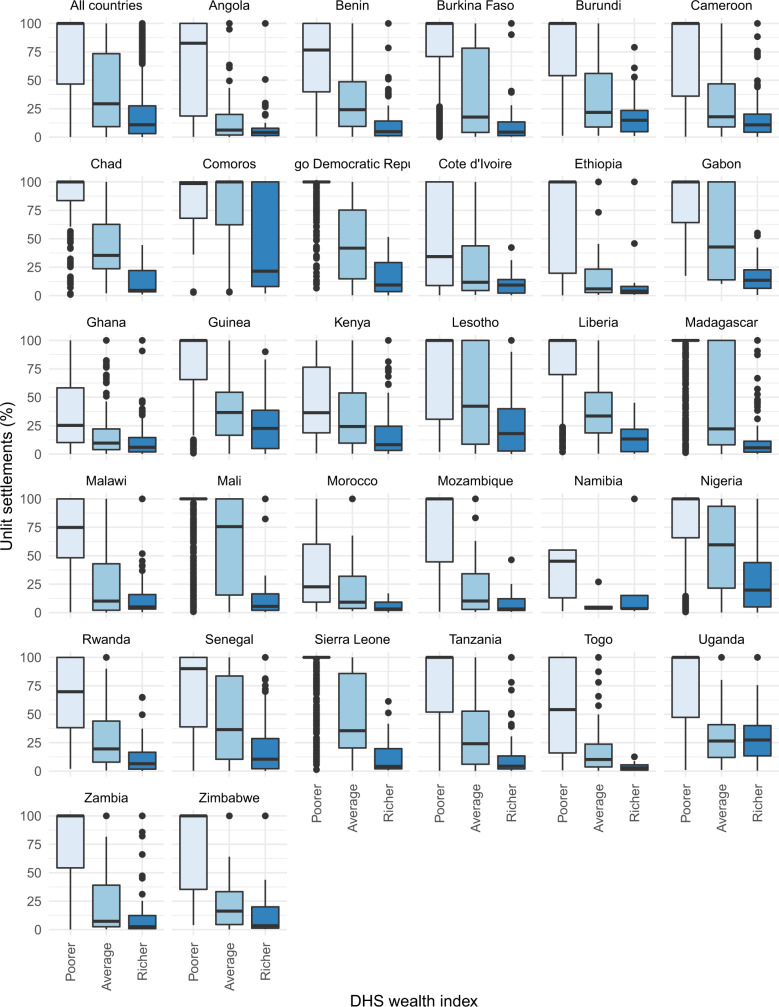
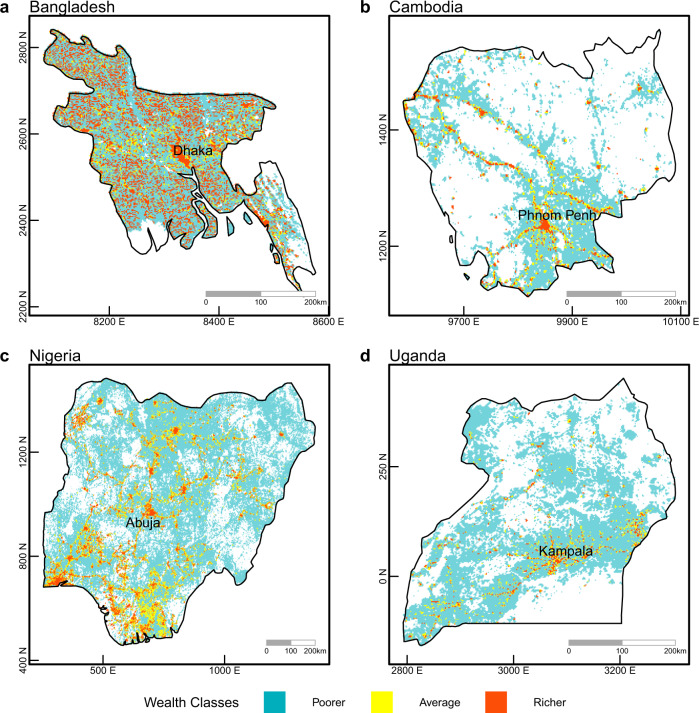
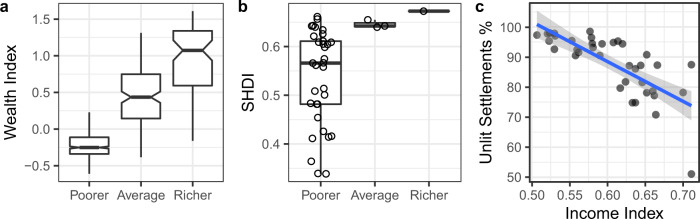
It is well established that nighttime radiance, measured from satellites, correlates with economic prosperity across the globe. In developing countries, areas with low levels of detected radiance generally indicate limited development - with unlit areas typically being disregarded. Here we combine satellite nighttime lights and the world settlement footprint for the year 2015 to show that 19% of the total settlement footprint of the planet had no detectable artificial radiance associated with it. The majority of unlit settlement footprints are found in Africa (39%), rising to 65% if we consider only rural settlement areas, along with numerous countries in the Middle East and Asia. Significant areas of unlit settlements are also located in some developed countries. For 49 countries spread across Africa, Asia and the Americas we are able to predict and map the wealth class obtained from ~2,400,000 geo-located households based upon the percent of unlit settlements, with an overall accuracy of 87%.
© 2022. The Author(s).
Conflict of interest statement
The authors declare no competing interests.
Figures
References
-
- World Bank. Poverty and Shared Prosperity 2016: Taking on Inequality. 10.1596/978-1-4648-0958-3 (2016).
-
- IEA. World Energy Outlook. https://webstore.iea.org/download/summary/190?fileName=English-WEO-2018-... (2018).
-
- Pachauri S, et al. Pathways to achieve universal household access to modern energy by 2030. Environ. Res. Lett. 2013;8:024015. doi: 10.1088/1748-9326/8/2/024015. - DOI
-
- Riva F, Ahlborg H, Hartvigsson E, Pachauri S, Colombo E. Electricity access and rural development: review of complex socio-economic dynamics and causal diagrams for more appropriate energy modelling. Energy Sustain. Dev. 2018;43:203–223. doi: 10.1016/j.esd.2018.02.003. - DOI
-
- Pachauri S, Rao ND. Advancing energy poverty measurement for SDG7. Prog. Energy. 2020;2:043001. doi: 10.1088/2516-1083/aba890. - DOI
Publication types
MeSH terms
LinkOut - more resources
Full Text Sources
