. 2022 May 5;13(1):2483.
doi: 10.1038/s41467-022-30126-9.

Combinatorial GxGxE CRISPR screen identifies SLC25A39 in mitochondrial glutathione transport linking iron homeostasis to OXPHOS

Affiliations

Combinatorial GxGxE CRISPR screen identifies SLC25A39 in mitochondrial glutathione transport linking iron homeostasis to OXPHOS

Xiaojian Shi et al. Nat Commun. .

Abstract

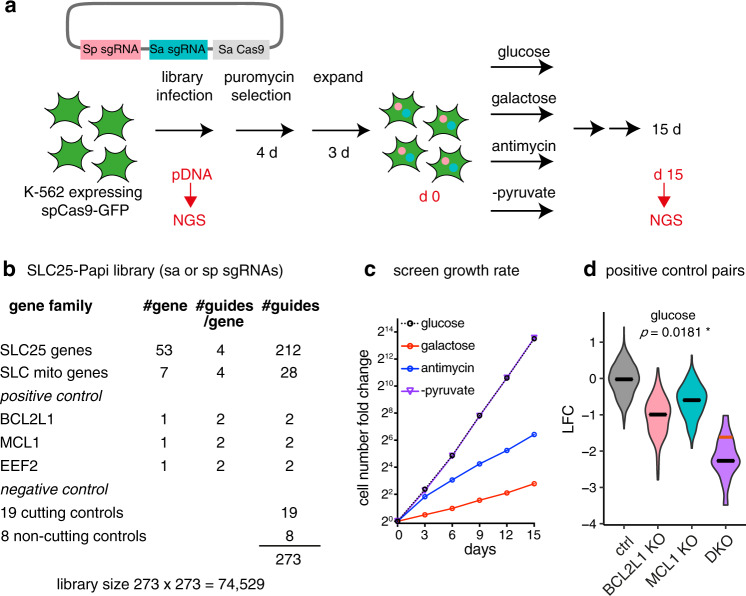
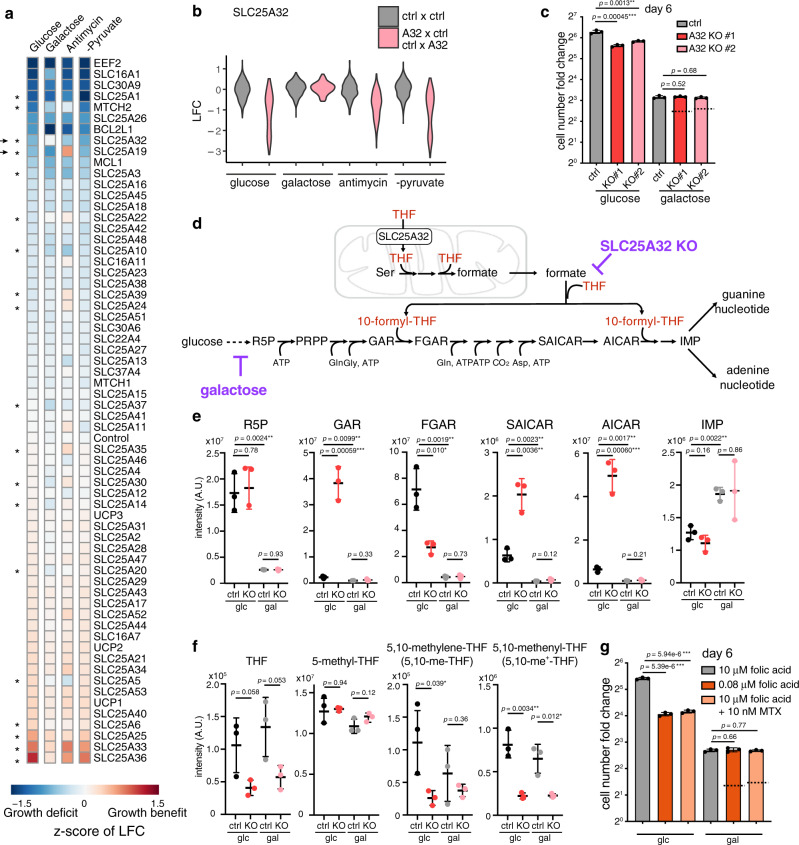
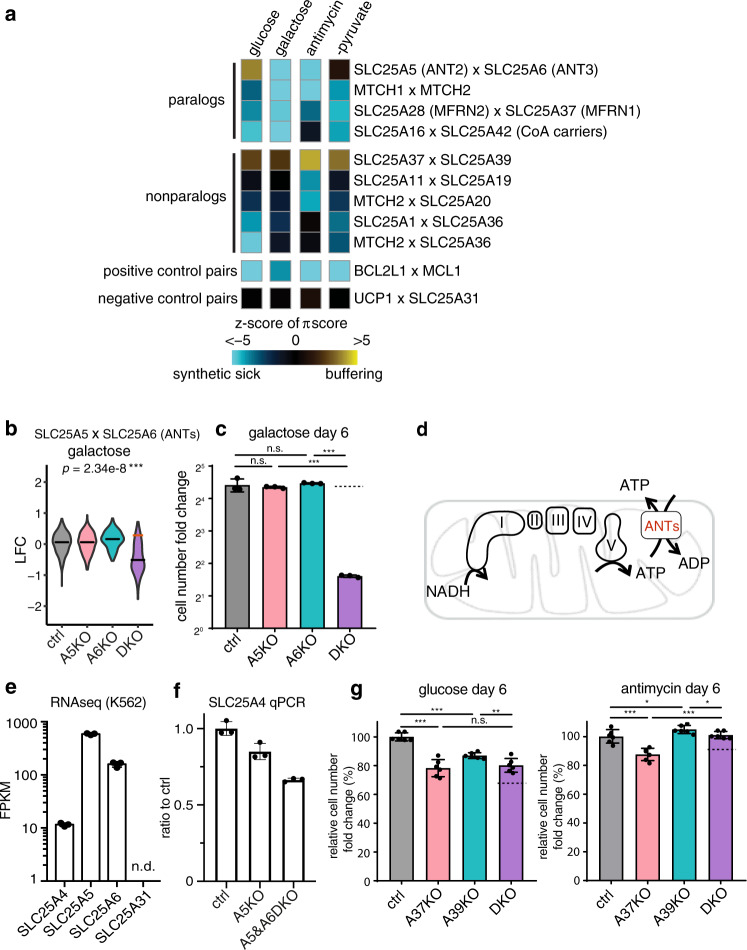
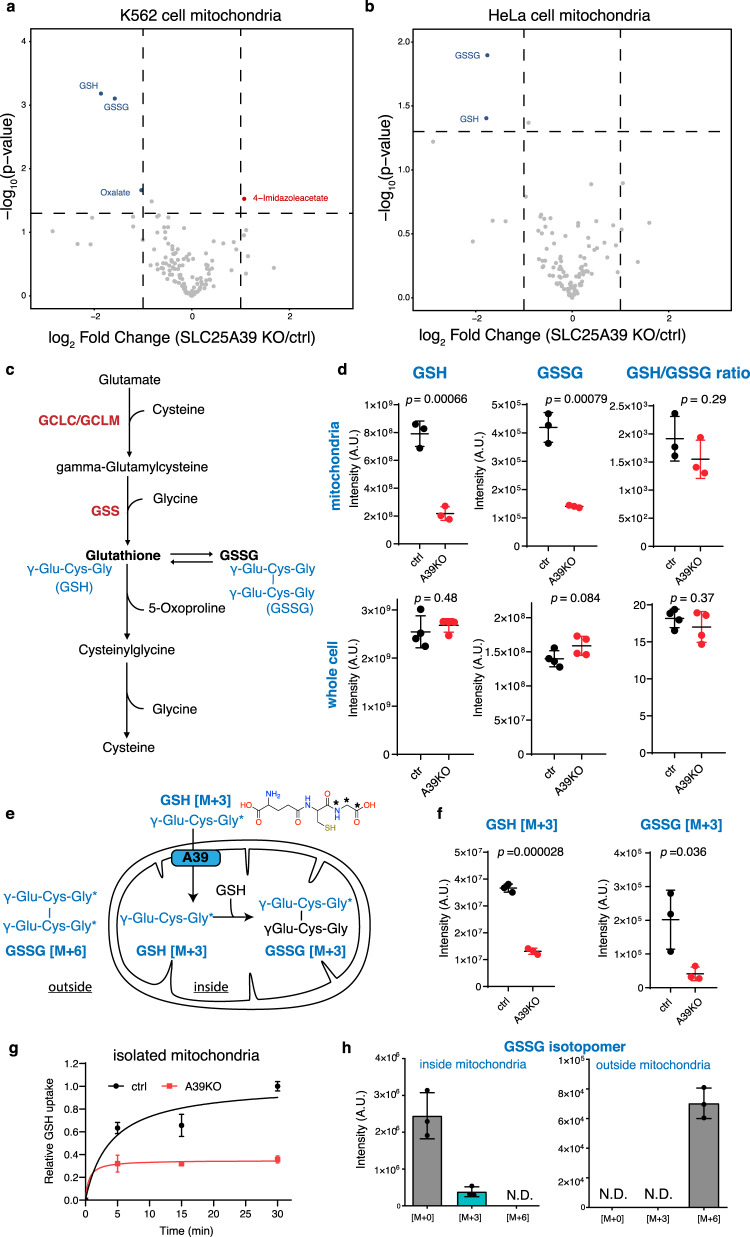
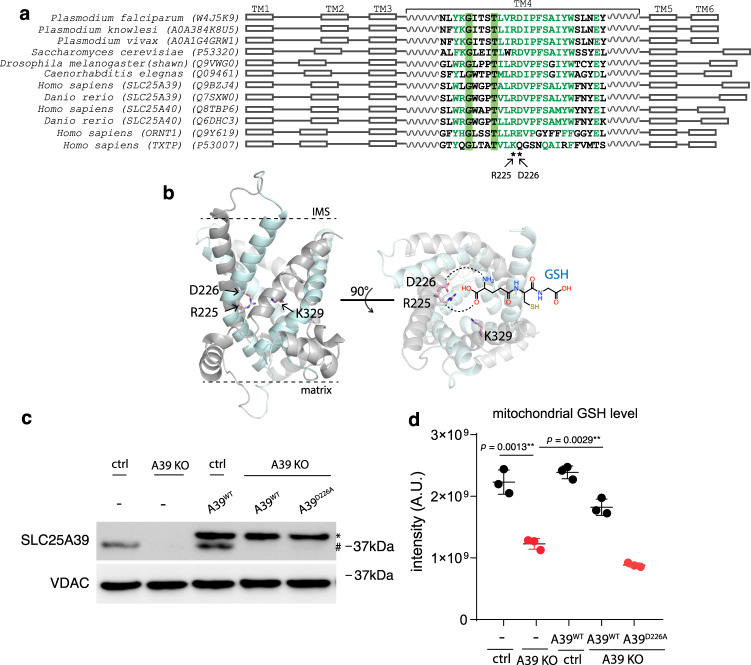
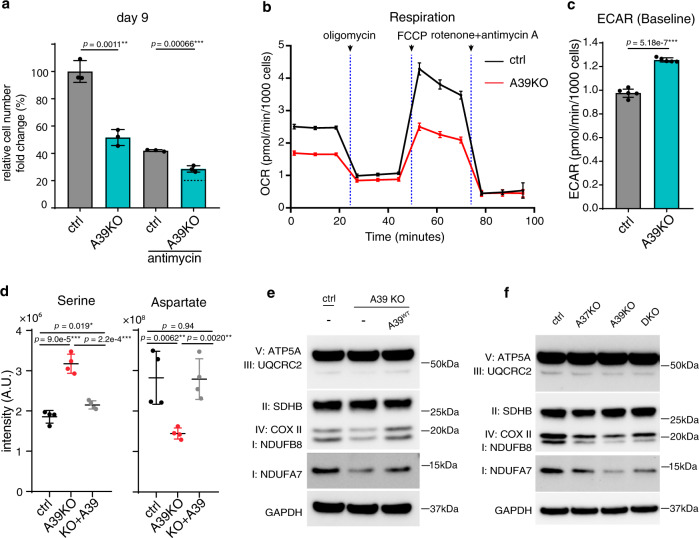
The SLC25 carrier family consists of 53 transporters that shuttle nutrients and co-factors across mitochondrial membranes. The family is highly redundant and their transport activities coupled to metabolic state. Here, we use a pooled, dual CRISPR screening strategy that knocks out pairs of transporters in four metabolic states - glucose, galactose, OXPHOS inhibition, and absence of pyruvate - designed to unmask the inter-dependence of these genes. In total, we screen 63 genes in four metabolic states, corresponding to 2016 single and pair-wise genetic perturbations. We recover 19 gene-by-environment (GxE) interactions and 9 gene-by-gene (GxG) interactions. One GxE interaction hit illustrates that the fitness defect in the mitochondrial folate carrier (SLC25A32) KO cells is genetically buffered in galactose due to a lack of substrate in de novo purine biosynthesis. GxG analysis highlights a buffering interaction between the iron transporter SLC25A37 (A37) and the poorly characterized SLC25A39 (A39). Mitochondrial metabolite profiling, organelle transport assays, and structure-guided mutagenesis identify A39 as critical for mitochondrial glutathione (GSH) import. Functional studies reveal that A39-mediated glutathione homeostasis and A37-mediated mitochondrial iron uptake operate jointly to support mitochondrial OXPHOS. Our work underscores the value of studying family-wide genetic interactions across different metabolic environments.


Conflict of interest statement

V.K.M. serves on the SAB and receives equity from Janssen Pharmaceutics and 5AM Ventures. J.G.D. consults for Foghorn Therapeutics, Maze Therapeutics, Merck, Agios, and Pfizer; J.G.D. consults for and has equity in Tango Therapeutics. The remaining authors declare no competing interests.

Figures

Fig. 1
Fig. 1. Combinatorial CRISPR screen of the SLC25 family transporters across four media conditions.
a Schematic overview of the combinatorial CRISPR strategy. b SLC25-Papi library construction. c Growth rate of the pooled CRISPR screen. The batch 2 growth rate was shown and representative of the two batches. d positive control pair BCL2L1 and MCL1. Data shown are log2 fold changes from day 15 in the glucose condition. Gray, control-control pair; pink, BCL2L1 x Ctrl or Ctrl x BCL2L1; blue, MCL1 x Ctrl or Ctrl x MCL1; and purple, the double knockouts of BCL2L1 x MCL1 or MCL1xBCL2L1. The black lines indicate the median and the red line indicates the expected value for the double knockout based on the sum of the single knockouts when there is no genetic interaction. Statistical significance was calculated using two-tailed t test. Source data are provided as a Source Data file.
Fig. 2
Fig. 2. Gene x Environment (GxE) mapping indicates that loss of mitochondrial folate metabolism can be buffered in galactose condition.
a A heatmap depicts the fitness of single gene KOs across all four media conditions. Values are Z-scores of log fold change (LFC) value of the targeting guide abundance. Asterisks highlight the 19 significant “GxE” interactions, i.e., those knockouts that cause fitness phenotypes differentially across the conditions. Arrows indicate two hits that were experimentally validated and pursued in the current study: SLC25A32 and SLC25A19 (see Supplementary Fig 2). b SLC25A32 single KO phenotype across four conditions in the screen, showing the buffering effect in galactose. Gray, the control-control distribution; pink, SLC25A32 single KOs (“A32 x Ctrl” or “Ctrl x A32” combined). c Follow-up studies show growth fitness of SLC25A32 CRISPR KO cells generated by two different sgRNAs in glucose and galactose conditions. The dotted line denotes the expected LFC, based on an additive model, if there was no genetic interaction (n = 3). d de novo purine biosynthesis pathway. e LC-MS measurement of purine intermediates in SLC25A32 KO and control cells in glucose and galactose condition for 2 days (n = 3). f LC-MS measurement of tetrahydrofolate (THF) cofactors in SLC25A32 KO and control cells in glucose and galactose condition for 2 days (n = 3). g Growth fitness of wild type cells either cultured in low folate media (0.08 μM) or treated with DHFR inhibitor methotrexate at sub-IC50 dose (10 nM), in glucose and galactose condition. The dotted line denotes the expected LFC, based on an additive model, if there was no genetic interaction (n =3). Statistical significance was calculated using two-tailed t test. Significance level were indicated as *** p < 0.001, ** p < 0.01, * p < 0.05 and n.s. p > 0.05. Data are expressed as mean ± SD. Source data are provided as a Source Data file.
Fig. 3
Fig. 3. Identification of Gene x Gene x Environment (GxGxE) interactions.
a Heatmap shows the π-score for pairwise genetic interaction. The values are z-transformed to compare across media conditions, as described in the methods. For comparison, a positive control pair (BCL2L1 x MCL1) that are always detrimental when jointly knocked out and another pair (UCP1 x SLC25A31) that do not interact are shown. The rows and columns are not clustered. b LFC values from the CRISPR screen are shown to illustrate the strongest synthetic sick genetic interaction observed from the CRISPR screen, SLC25A5 and SLC25A6 loss in the galactose condition. The red line indicates the expected LFC, based on an additive model, if there were no genetic interaction. The black line indicates the actual median LFC value. c Follow-up validation of the genetic interaction between SLC25A5 and SLC25A6 in the galactose (pctrl/A5KO = 0.59, pctrl/A6KO = 0.66, pA5KO/DKO = 2.11 × 107, pA6KO/DKO = 1.93 × 108). The dotted line indicates the expected growth fitness, based on an additive model, if there were no specific genetic interaction (n = 3). d The cartoon illustrates the function of ANTs in supporting bioenergetics. e Transcript levels of the four ANTs in K562 cells (data plotted from the published PBS vehicle treated K562 cells RNA-seq dataset GSE74999) (n = 3). f qPCR of SLC25A4 mRNA level in SLC25A5 KO and SLC25A5 and SLC25A6 DKO cells (n = 3). g Follow-up validation of the genetic interaction between SLC25A37 and SLC25A39 in the glucose (pctrl/A37KO = 1.04×10⁻⁵, pctrl/A39KO = 3.08×10⁻⁶, pA37KO/DKO = 0.56, pA39KO/DKO = 0.0092) and antimycin (pctrl/A37KO = 0.00074, pctrl/A39KO = 0.0498, pA37KO/DKO = 5.54×10⁻⁵, pA39KO/DKO = 0.030) conditions (n = 6). Statistical significance was calculated using two-tailed t test. Significance level were indicated as *** p < 0.001, ** p < 0.01, * p < 0.05 and n.s. p > 0.05. Data are expressed as mean ± SD. Source data are provided as a Source Data file.
Fig. 4
Fig. 4. SLC25A39 is required for mitochondrial glutathione transport.
Volcano plots of mitochondrial metabolites from the A39 KO and control cells in K562 cells (a) and HeLa cells (b) highlighting a depletion of reduced and oxidized glutathione, GSH and GSSG, respectively, in the A39 KO mitochondria. c schematic of the biosynthesis and degradation of glutathione in mammalian cells. GSH is a tripeptide γ-Glu-Cys-Gly exclusively synthesized in the cytosol by two cytosolic enzyme systems, γ-glutamylcysteine synthetase (GCLC and GCLM) and GSH synthetase (GSS) d LC-MS measurement of reduced GSH, oxidized GSSG and GSH/GSSG ratio in isolated mitochondria (n = 3) and whole cells (n = 4). e Schematic overview of the organelle-based GSH uptake assay. Note that the imported labeled GSH can react with endogenous, unlabeled GSH to generate GSSG. f LC-MS measurement of mitochondrial labeled GSH and singly labeled GSSG in the uptake assay (30 min) (n = 3). g Time-course of labeled GSH uptake into mitochondria (n = 3). h GSSG isotopomer distribution from the inside (washed mitochondria fraction) and the outside (assay supernatant) of the control mitochondria in the GSH uptake assay at the 30 min time point (n = 3). Statistical significance was calculated using two-tailed t test. Significance level were indicated as *** p < 0.001, ** p < 0.01, * p < 0.05 and n.s. p > 0.05. Data are expressed as mean ± SD. Source data are provided as a Source Data file.
Fig. 5
Fig. 5. Structural modeling and functional mutagenesis of SLC25A39.
a Multiple sequence alignment of the eukaryotic A39 ortholog sequences spanning diverse taxa alongside with the human amino acid ornithine transporter SLC25A15 (ORNT1) and the human citrate transporter SLC25A1 (TXTP). The positions for the human SLC25A39 Arg225 and Asp226 residues predicted to bind amino acids are labeled by asterisks. b The modeled human A39 structure based on the ANT structure c-state conformation (PDB: 1OKC), in both side view (left) and cytoplasmic/mitochondrial intermembrane space (IMS) view (right). Odd transmembrane domain (TM1, 3, 5) are shown in gray and even (TM2, 4, 6) are shown in cyan. Two predicted GSH binding residues (R225, D226) and the predicted residue critical for solute-binding induced conformational change (K329) are shown. The predicted interaction between R225 and D226 with the carboxylate and amino group of the glutamate residue of GSH is shown by dashed line. c Western blotting showing the endogenous A39 (#) and ectopically expressed A39 protein (*). VDAC was used as the loading control. d LC-MS measurement of mitochondrial GSH level showing that the predicted substrate binding mutant A39D226A cannot restore mitochondrial GSH level in the A39 KO cells (n = 3). Statistical significance was calculated using two-tailed t test. Significance level were indicated as *** p < 0.001, ** p < 0.01, * p < 0.05 and n.s. p > 0.05. Data are expressed as mean ± SD. Source data are provided as a Source Data file.
Fig. 6
Fig. 6. SLC25A39 converges with SLC25A37-mediated iron homeostasis to support mitochondrial OXPHOS.
a Growth fitness defect in A39 CRISPR KO cells is buffered in the antimycin condition. The dotted line indicates the expected cell number, based on an additive model, if there were no specific genetic interaction (n = 3). b Oxygen consumption rate (OCR) for A39 KO cells during Seahorse mito stress test (n = 5). c The basal extracellular acidification rate (ECAR) for A39 KO cells (n = 5). d LC-MS measurement of serine and aspartate in control, A39 KO and the rescued cells (n = 4). e Western blot for subunits of mitochondrial OXPHOS complexes in the ctrl, A39KO, and A39KO K562 cells expressing SLC25A39 cDNA. GAPDH was used as the loading control. f Western blot for subunits of mitochondrial OXPHOS complexes in the ctrl, SLC25A37KO, SLC25A39KO, and DKO K562 cells. GAPDH was used as the loading control. Statistical significance was calculated using two-tailed t test. Significance level were indicated as *** p < 0.001, ** p < 0.01, * p < 0.05 and n.s. p > 0.05. Data are expressed as mean ± SD. Source data are provided as a Source Data file.

Similar articles

Cited by

References

    1. Palmieri F. The mitochondrial transporter family SLC25: identification, properties and physiopathology. Mol. Asp. Med. 2013;34:465–484. doi: 10.1016/j.mam.2012.05.005. - DOI - PubMed
    1. Cunningham CN, Rutter J. 20,000 picometers under the OMM: diving into the vastness of mitochondrial metabolite transport. EMBO Rep. 2020;21:e50071. doi: 10.15252/embr.202050071. - DOI - PMC - PubMed
    1. Kunji, E. R. et al. The SLC25 Carrier Family: Important Transport Proteins in Mitochondrial Physiology and Pathology. Physiology35, 302–327 (2020). - PMC - PubMed
    1. Tsaousis AD, et al. A novel route for ATP acquisition by the remnant mitochondria of Encephalitozoon cuniculi. Nature. 2008;453:553–556. doi: 10.1038/nature06903. - DOI - PubMed
    1. Ruprecht JJ, et al. Structures of yeast mitochondrial ADP/ATP carriers support a domain-based alternating-access transport mechanism. Proc. Natl. Acad. Sci. USA. 2014;111:E426–E434. doi: 10.1073/pnas.1320692111. - DOI - PMC - PubMed

Publication types