. 2022 May 5;12(1):7395.
doi: 10.1038/s41598-022-11303-8.

Longitudinal analysis of built environment and aerosol contamination associated with isolated COVID-19 positive individuals

Affiliations

Longitudinal analysis of built environment and aerosol contamination associated with isolated COVID-19 positive individuals

Patrick F Horve et al. Sci Rep. .

Abstract

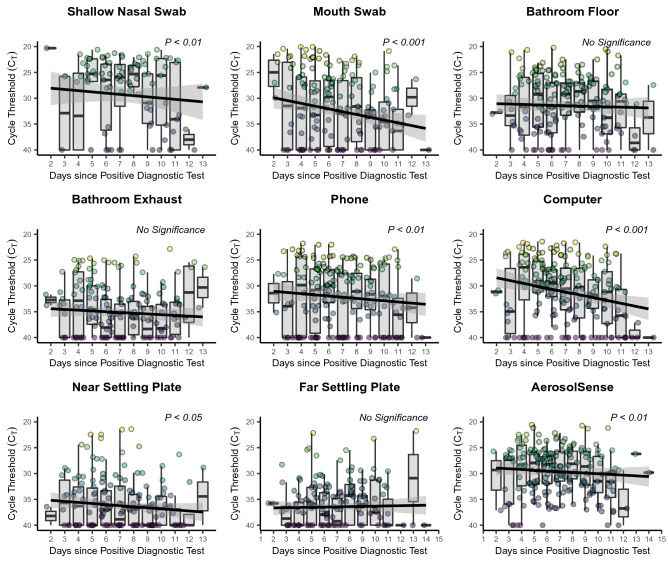
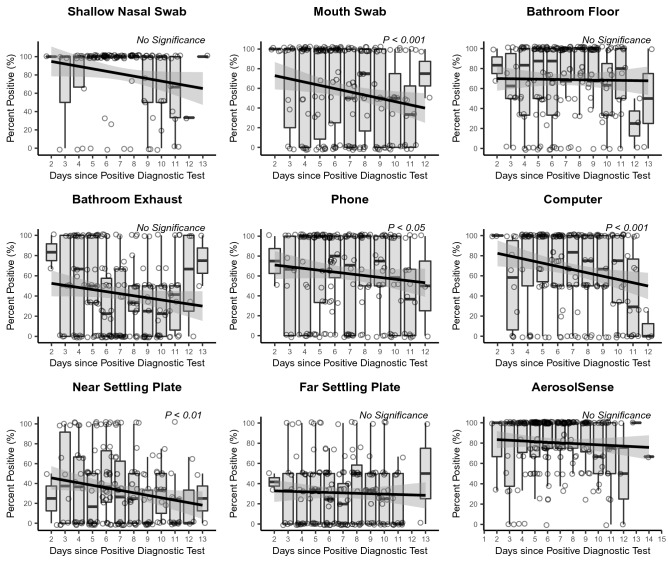
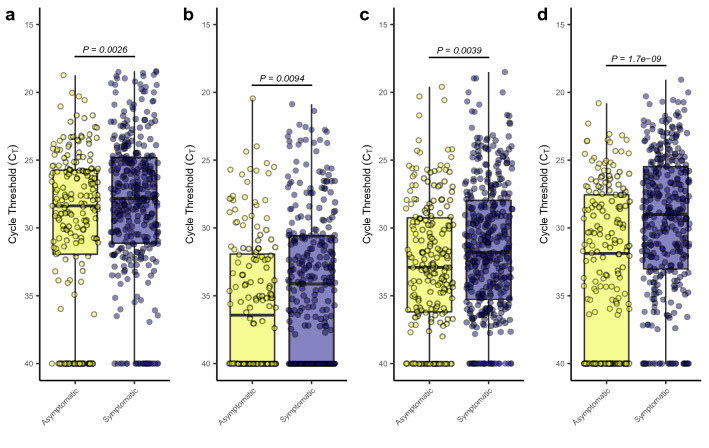
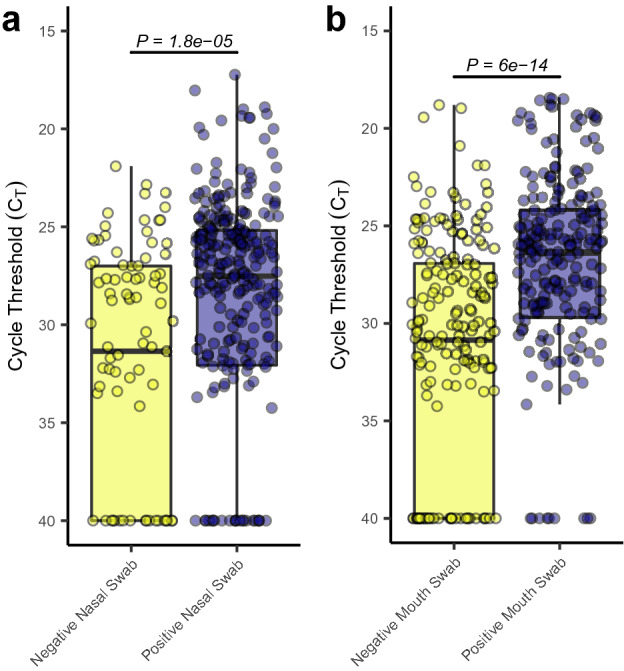
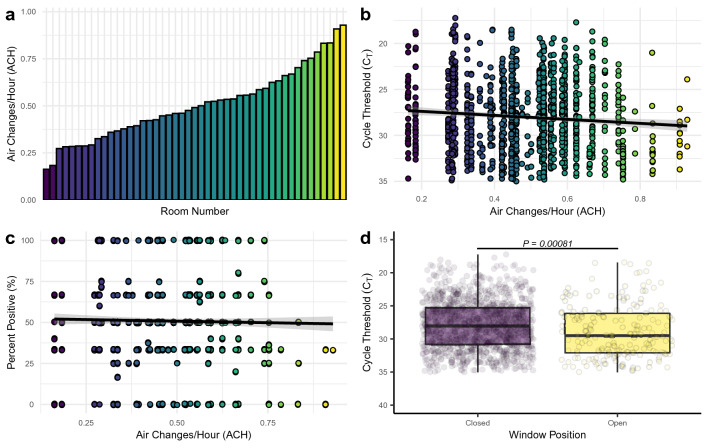
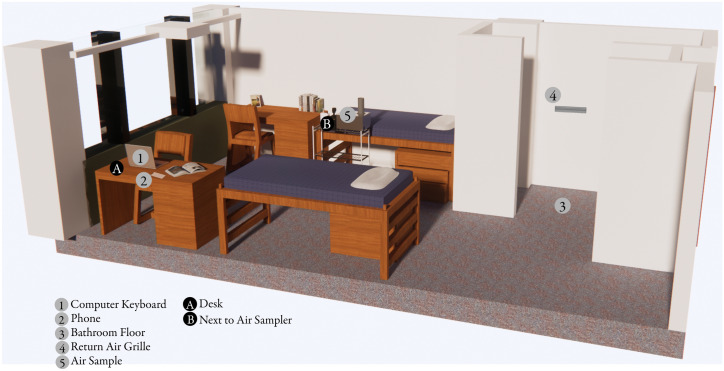
The indoor environment is the primary location for the transmission of severe acute respiratory syndrome coronavirus 2 (SARS-CoV-2), the causative agent of coronavirus disease 2019 (COVID-19), largely driven by respiratory particle accumulation in the air and increased connectivity between the individuals occupying indoor spaces. In this study, we aimed to track a cohort of subjects as they occupied a COVID-19 isolation dormitory to better understand the impact of subject and environmental viral load over time, symptoms, and room ventilation on the detectable viral load within a single room. We find that subject samples demonstrate a decrease in overall viral load over time, symptoms significantly impact environmental viral load, and we provide the first real-world evidence for decreased aerosol SARS-CoV-2 load with increasing ventilation, both from mechanical and window sources. These results may guide environmental viral surveillance strategies and be used to better control the spread of SARS-CoV-2 within built environments and better protect those caring for individuals with COVID-19.


Conflict of interest statement

KGVDW has a company called Duktile through which he provides healthy building consulting, including consulting related to viral pathogens, and he serves as a scientific advisor to EnviralTech and Poppy, companies that conduct viral surveillance. No other authors have any competing interests to declare.

Figures

Figure 1
Figure 1
Longitudinal viral shedding and environmental contamination dynamics. The mean daily cycle threshold (CT) for each sampling location throughout the course of the participants’ involvement in the study. Individual points represent the mean daily CT value per individual and are colored according to CT value with lighter colors representing lower CT values and darker colors representing higher CT values. The y-axis is inverted so that lower CT values are higher (to represent higher viral load) and higher CT values are lower (to represent lower viral load). The black line represents a linear mixed model estimated using a restricted maximum likelihood (REML) approach and including the individual occupying the room as a random effect and the grey area represents the 95% confidence interval for that model.
Figure 2
Figure 2
Mean daily percent positivity at each sampling location. The percent positivity rate per entry per study subject was calculated and the mean positivity rate of all participants per day enrolled in the study was calculated as the daily percentage rate. The black line represents a linear mixed model estimated using a restricted maximum likelihood (REML) approach and including the individual occupying the room as a random effect and the grey area represents the 95% confidence interval for that model.
Figure 3
Figure 3
Impact of symptom presence on viral shedding and detection. (a) Boxplots of the observed cycle threshold values for active air samples collected by the AerosolSense sampler from rooms occupied by asymptomatic (yellow) and symptomatic (purple) individuals. (b) Boxplots of observed cycle threshold values for aerosol particulate samples collected by the AerosolSense sampler, passive air settling plate, and bathroom exhaust vents from rooms occupied by asymptomatic (yellow) and symptomatic (purple) individuals. (c) Boxplots of observed cycle threshold values for aerosol particulate samples collected by passive air settling plates and bathroom exhaust vents from rooms occupied by asymptomatic (yellow) and symptomatic (purple) individuals. (d) Boxplots of the observed cycle threshold values for environmental swabs collected from the computer, phone, and bathroom floor from rooms occupied by asymptomatic (yellow) and symptomatic (purple) individuals.
Figure 4
Figure 4
Potential intermittency of viral shedding and production. (a) Boxplots of the observed cycle threshold values for active air samples collected by the AerosolSense sampler from room entries when the study participant returned a negative shallow nasal swab (yellow) and a positive shallow nasal swab (purple). (b) Boxplots of the observed cycle threshold values for active air samples collected by the AerosolSense sampler from room entries when the study participant returned a negative oral swab (yellow) and a positive oral swab (purple).
Figure 5
Figure 5
Impact of differential ventilation rates on SARS-CoV-2 RNA identification. (a) Distribution of the calculated air exchanges per hour (ACH) from mechanical exhaust across all isolation rooms occupied by study participants. (b) Relationship between the observed cycle threshold (CT) values and the air changes per hour (ACH) from occupied isolation rooms. The black line indicates fit from a linear model to the raw data and the grey area represents the 95% confidence interval for that model. Individual points are colored based on the ACH observed in that sample with darker colors representing lower ACH values and lighter colors representing higher ACH values. (c) Relationship between the observed percent positivity from each entry into a subject room and the air changes per hour (ACH) from occupied isolation rooms. The black line indicates fit from a linear model to the raw data and the grey area represents the 95% confidence interval for that model. Individual points are colored based on the ACH observed in that sample with darker colors representing lower ACH values and lighter colors representing higher ACH values. (d) Boxplots of observed cycle threshold (CT) values of aerosol samples taken during periods when the window was open for more than 50% of the sampling period (yellow) or closed for more than 50% of the sampling period (purple), as recorded during the entry surveys answered by participants.
Figure 6
Figure 6
Representative layout of study rooms and sampling locations. Numbers in grey circles represent locations sampled with flocked swabs and letters in black circles represent locations sampled through passive air settling plates. Sampling location 5 represents the active air sample collected with the AerosolSense Sampler. Developed by Marin Nagle and authors using Enscape3D v.3.1 www.enscape3d.com and Adobe Illustrator v.24.2 www.adobe.com.

Similar articles

Cited by

References

    1. National Academies of Sciences, Engineering, and Medicine et al. The Built Environment and Microbial Communities. (National Academies Press (US), 2017).
    1. Horve PF, et al. Building upon current knowledge and techniques of indoor microbiology to construct the next era of theory into microorganisms, health, and the built environment. J. Expo. Sci. Environ. Epidemiol. 2019 doi: 10.1038/s41370-019-0157-y. - DOI - PMC - PubMed
    1. Naming the coronavirus disease (COVID-19) and the virus that causes it. https://www.who.int/emergencies/diseases/novel-coronavirus-2019/technica.... Accessed on 10 August 2021
    1. Lednicky JA, et al. Collection of SARS-CoV-2 virus from the air of a clinic within a university student health care center and analyses of the viral genomic sequence. Aerosol. Air Qual. Res. 2020;20:1167–1171. doi: 10.4209/aaqr.2020.05.0202. - DOI - PMC - PubMed
    1. Hamner L, et al. High SARS-CoV-2 attack rate following exposure at a choir practice—skagit county, washington, March 2020. MMWR Morb. Mortal. Wkly. Rep. 2020;69:606–610. doi: 10.15585/mmwr.mm6919e6. - DOI - PubMed

Publication types