. 2022 May 5;13(1):2475.
doi: 10.1038/s41467-022-30168-z.

PICASSO allows ultra-multiplexed fluorescence imaging of spatially overlapping proteins without reference spectra measurements

Affiliations

PICASSO allows ultra-multiplexed fluorescence imaging of spatially overlapping proteins without reference spectra measurements

Junyoung Seo et al. Nat Commun. .

Abstract

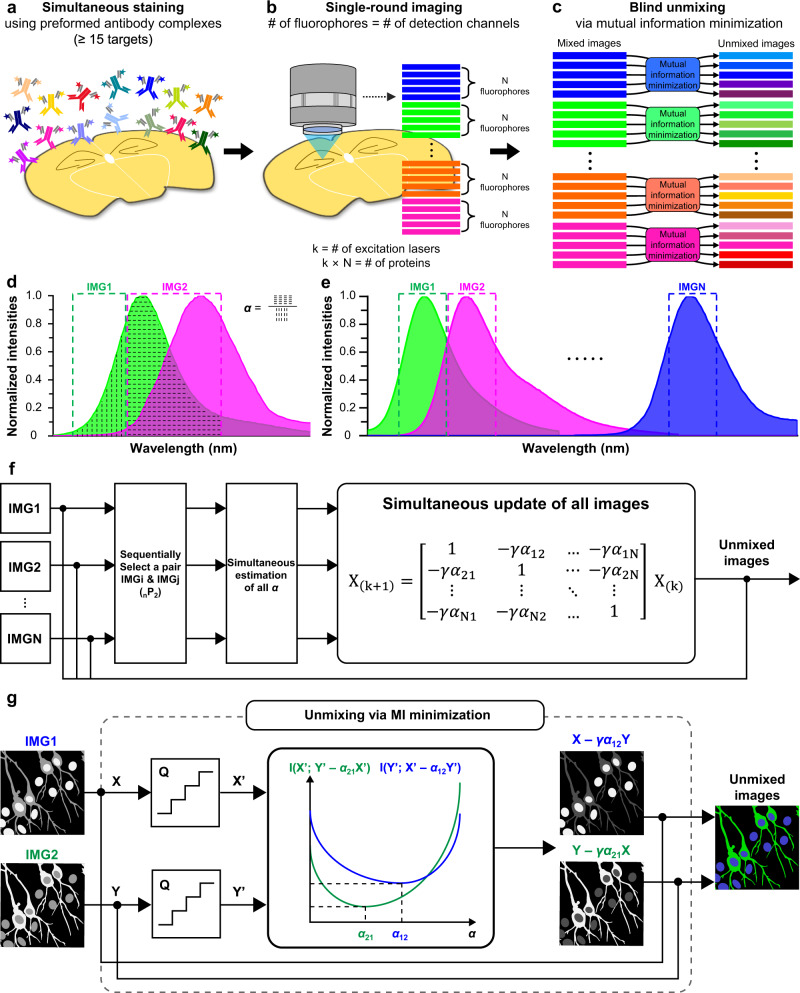
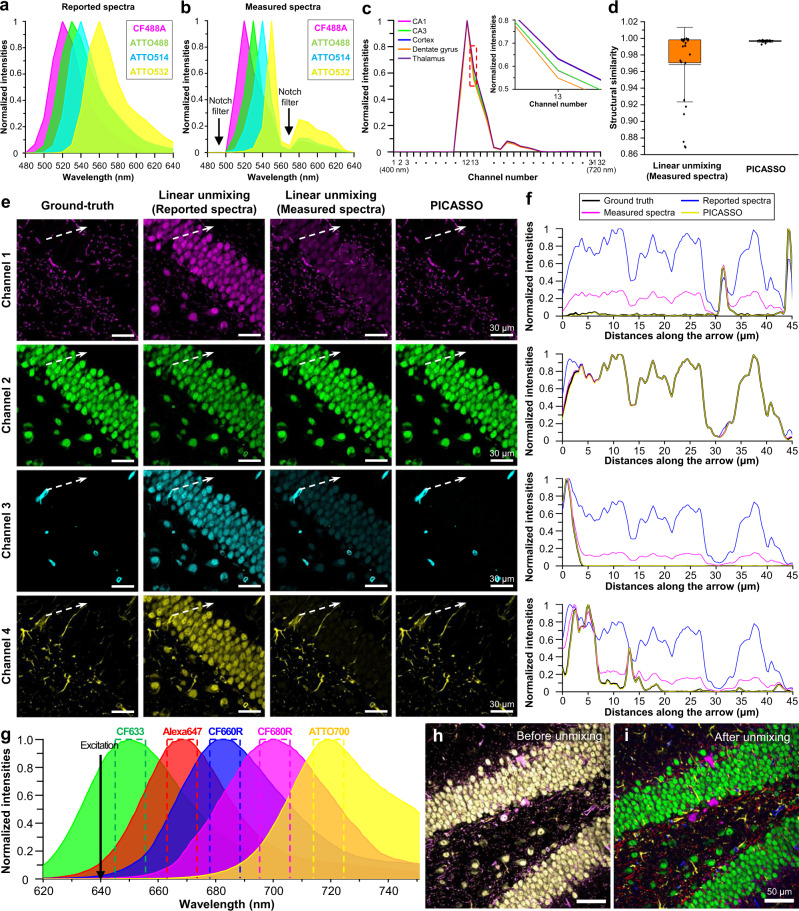
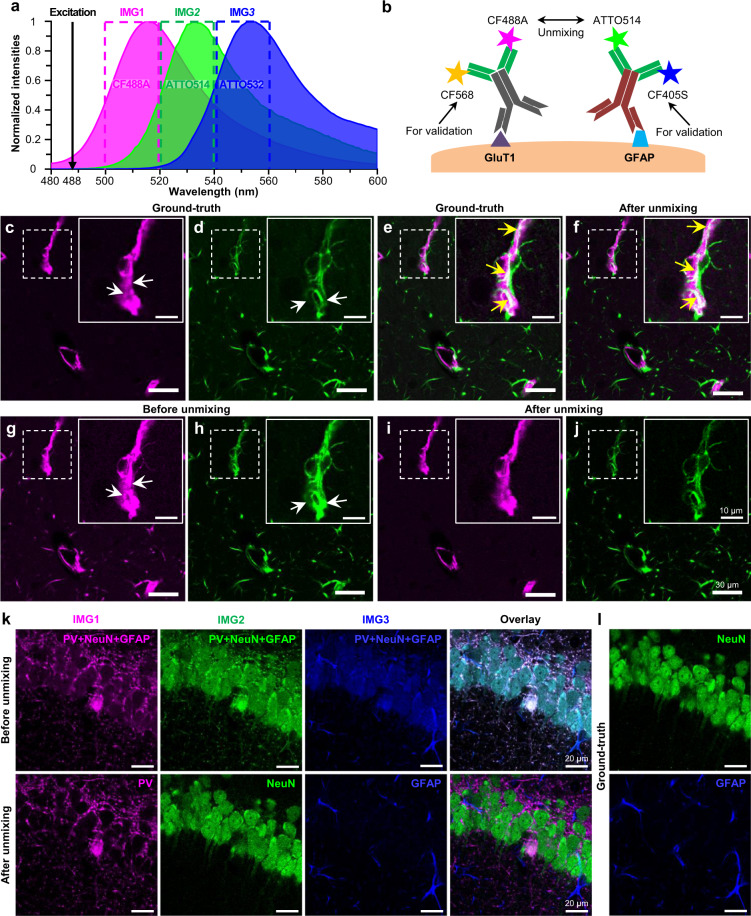
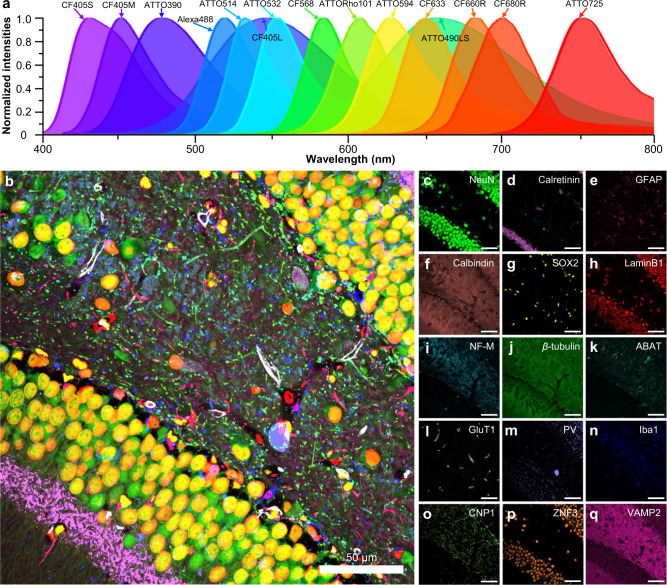
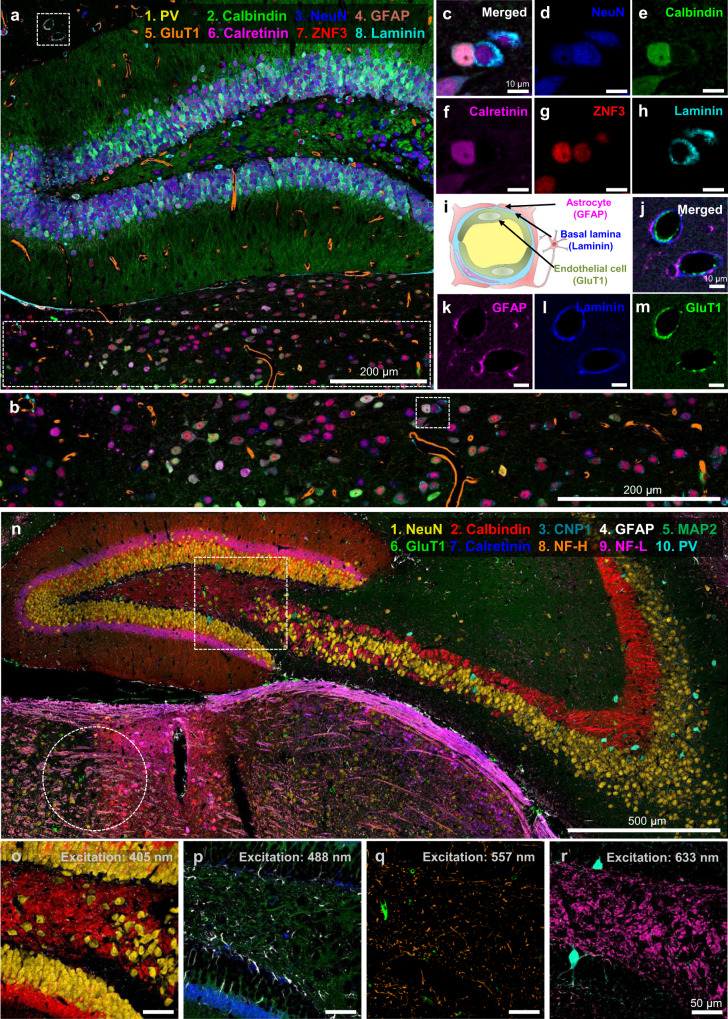
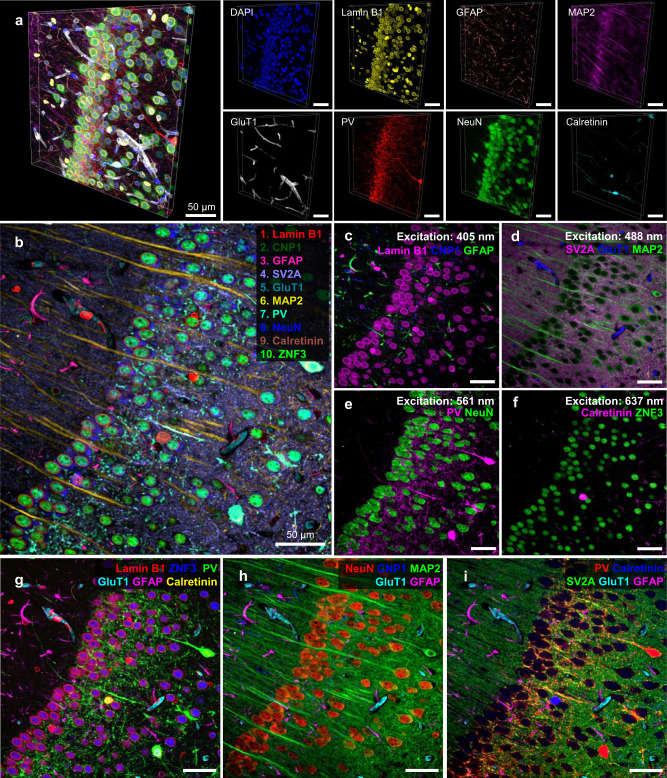
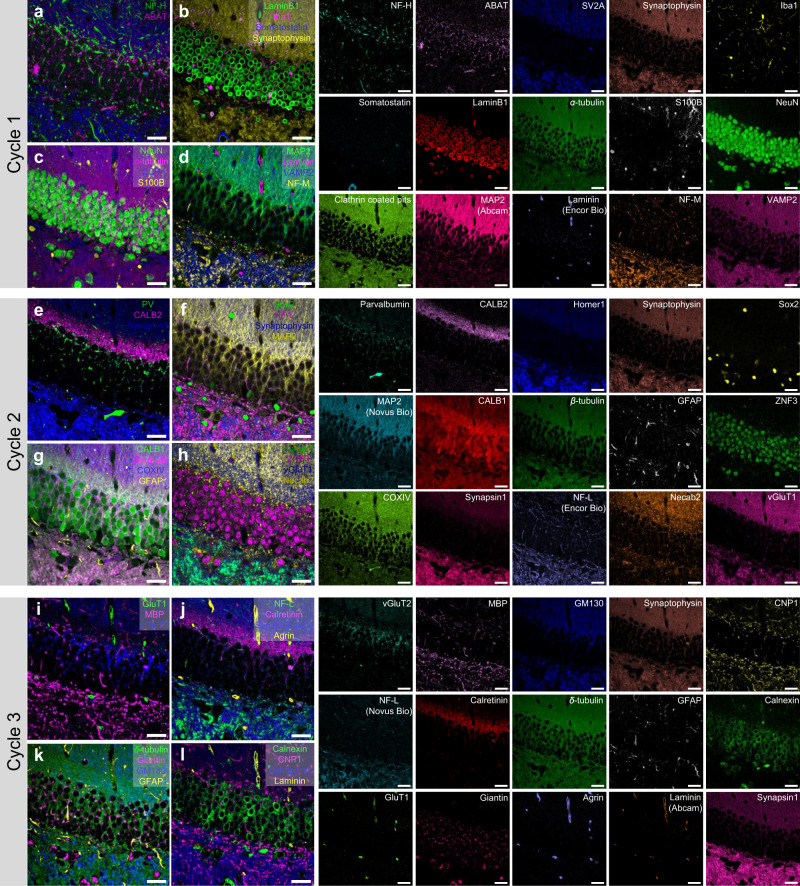
Ultra-multiplexed fluorescence imaging requires the use of spectrally overlapping fluorophores to label proteins and then to unmix the images of the fluorophores. However, doing this remains a challenge, especially in highly heterogeneous specimens, such as the brain, owing to the high degree of variation in the emission spectra of fluorophores in such specimens. Here, we propose PICASSO, which enables more than 15-color imaging of spatially overlapping proteins in a single imaging round without using any reference emission spectra. PICASSO requires an equal number of images and fluorophores, which enables such advanced multiplexed imaging, even with bandpass filter-based microscopy. We show that PICASSO can be used to achieve strong multiplexing capability in diverse applications. By combining PICASSO with cyclic immunofluorescence staining, we achieve 45-color imaging of the mouse brain in three cycles. PICASSO provides a tool for multiplexed imaging with high accessibility and accuracy for a broad range of researchers.


Conflict of interest statement

I.C. and H.N. declare no competing interests. J.-B.C., Y.-G.Y., J.S., Y.S., H.K., and J.K. declare the following competing interests. J.-B.C., Y.-G.Y., J.S., Y.S., H.K., and J.K. are co-inventors on patent applications owned by KAIST covering PICASSO (KR10-2020-0088091, KR10-2021-0089419, KR10-2021-0090057, KR10-2021-0171431, US 17/132628, US17/445629, US17/567300, PCT/KR2021/011097, PCT/KR2021/018833, EP22150031.7, EP21192162.2).

Figures

Fig. 1
Fig. 1. Schematic of the PICASSO process.
ac Experimental process of multiplexed immunofluorescence imaging using PICASSO. a Simultaneous immunostaining of more than 15 proteins with primary antibody–Fab complexes conjugated with spectrally overlapping fluorophores. b Acquisition of images at different detection channels. The number of required images equals the number of fluorophores to be unmixed. For each of the k excitation lasers, N spectrally overlapping fluorophores are used, making the total number of fluorophores k × N. c Blind source separation of N mixed images into N images, each of which contains the signal from only one fluorophore through progressive mutual information (MI) minimization. d Emission spectra of two spectrally overlapping fluorophores (green and magenta solid lines and colored regions) and detection channels (green and magenta dotted boxes). Here α is the ratio of the area with horizontal dotted lines to the area with vertical dotted lines. IMG1, 2 are images acquired at the first (green dotted box) and second (magenta dotted box) detection channels. e Emission spectra of N spectrally overlapping fluorophores and detection channels. f, g Schematic of the PICASSO unmixing algorithm. The images are unmixed by progressively minimizing the MI between mixed images. f N-color unmixing via MI minimization. g Two-color unmixing via MI minimization. Q = quantization, X’ and Y’ = quantized IMG1, 2. I(X’; Y’ − α21X’) = MI between X’ and Y’ − α21X’. I(Y’; X’ − α12Y’) = MI between Y’ and X’ − α21Y’. α12 and α21: optimized α that enables the minimization of MI.
Fig. 2
Fig. 2. Simulation results of linear unmixing vs. PICASSO and five-color unmixing via PICASSO.
a, b Emission spectra of CF488A (magenta), ATTO488 (green), ATTO514 (cyan), and ATTO532 (yellow). a Reported spectra. b Measured spectra. c Spectra variation of CF488A for each mouse brain subregion; the upper right inset shows a magnified view of the red dotted box. d Structural similarity (SSIM) between ground-truth and unmixed images. SSIM indexes were calculated for each channel and their averages were plotted on the graph. Linear unmixing: average = 0.968, lowest value = 0.869, and S.D. = 0.045. PICASSO: average = 0.997, lowest value = 0.993, and S.D. = 0.001. The center lines show the mean values and the lower and upper boundaries of the boxes correspond to 25 and 75%; the whiskers extend to show standard deviation. To compare the SSIM, 25 mixed images were synthesized by combining 25 spectra of each fluorophore (CF488A, ATTO488, ATTO514, and ATTO532) measured from n = 5 biologically independent subregions. e Ground-truth and unmixed images after linear unmixing and PICASSO. The reported spectra shown in a, as well as 25 measured spectra, were used to generate the 32-channel synthetic images. Averages of the 25 measurements for each fluorophore shown in b were used as an unmixing matrix. f Normalized intensities of each channel along the arrow shown in e. Ground-truth (black), linear unmixing (blue and magenta), and PICASSO (yellow). g Emission spectra of five fluorophores and detection channels used in the simulation. Solid line: emission spectrum of each fluorophore. Dotted box: detection channel defined from −5 to +5 nm of the emission peak of each fluorophore. h, i Result of five-color unmixing simulation. h Overlay of the five synthetic mixed images. i Overlay of five images after unmixing via PICASSO. Source data are provided as a Source data file.
Fig. 3
Fig. 3. Experimental validation of unmixing of spatially overlapping proteins using PICASSO.
a Emission spectra of the three fluorophores and three detection channels used in this experiment. The solid line and shaded area: emission spectrum of each fluorophore. Dotted box: detection channel from where images were acquired. In the two-channel validation experiment shown in cj, only CF488A and ATTO514 were used and images were acquired from the first two detection channels. In the three-channel validation experiment shown in k, l, all three fluorophores and detection channels were used. b Schematic of two-channel validation experiment. cj Ground-truth, before unmixing, and after unmixing images of the two-channel validation experiment. c First channel of the ground-truth image, showing GluT1. d Second channel of the ground-truth image, showing GFAP. e Overlay of the two channels of the ground-truth image. f Overlay of the two channels of the after-unmixing image. g First channel of the mixed image, acquired from the first detection range in a. h Second channel of the mixed image, acquired from the second detection range shown in a. i First channel of the unmixed image, showing GluT1. j Second channel of the unmixed image, showing GFAP. k, l Ground-truth, before unmixing, and after unmixing images of the three-channel validation experiment. k Before and after unmixing images. l Ground-truth images stained with separate antibodies against NeuN and GFAP.
Fig. 4
Fig. 4. Fifteen-color multiplexed imaging of the mouse brain via PICASSO.
a Emission spectra of the 15 fluorophores used. bq Fifteen-color multiplexed imaging. Fifteen images were acquired at 15 detection channels and blindly unmixed via PICASSO. b Fifteen-color multiplexed imaging of the dentate gyrus of the mouse hippocampus. Target proteins are listed in cq. cq Single-channel images of b. The contrast of each channel was adjusted to clearly show all channels in b. In cq, images were displayed without any contrast adjustments or thresholding. All scale bars; 50 μm.
Fig. 5
Fig. 5. Multiplexed imaging of the mouse brain via PICASSO with multiple excitation lasers.
a Eight-color multiplexed imaging of the dentate gyrus of the mouse hippocampus. b Magnified view of the dotted boxed region at the bottom of a. ch Magnified view of the dotted boxed region in b for individual labeled proteins. i Structure of the blood–brain barrier (BBB). jm Magnified view of the dotted boxed region at the top left of a, clearly showing the cellular structures of the BBB. n Ten-color multiplexed imaging of the mouse hippocampus. or Magnified view of the dotted boxed region of n. Overlays of two or three channels acquired with a single excitation laser.
Fig. 6
Fig. 6. Three-dimensional multiplexed imaging via PICASSO and the use of PICASSO with microscopy equipped with bandpass filters.
a Three-dimensional view of a z-stack image acquired from a mouse brain slice that was stained, imaged, and unmixed by PICASSO. Left: Overlay of the eight channels. Right: Single-channel images. b Demonstration of the 10-color multiplexed imaging of the mouse hippocampus CA1 via PICASSO with a microscope equipped with bandpass filters. The images were acquired using a confocal microscope equipped with eight bandpass filters and four excitation lasers. cf Two or three channels of the image shown in b acquired by one of the four excitation lasers. The wavelengths of the excitation lasers were c 405 nm, d 488 nm, e 561 nm, and f 637 nm. gi Overlay of five or six channels chosen from the image shown in b to clearly visualize different sets of biologically relevant channels together. Different display colors were used for proteins in each image to maximize visibility. ai All primary antibodies were rabbit antibodies. All scale bars; 50 μm.
Fig. 7
Fig. 7. Forty-five-color multiplexed imaging via Cyclic-PICASSO.
ad Overlay of three or four channels chosen from 15-color images of cycle 1 imaging to visualize different sets of biologically relevant channels together. Individual images were presented on the right side of ad. eh Overlay of the three or four channels chosen from the 15-color images of cycle 2 imaging. The individual images were presented on the right side of eh. il Overlay of the three or four channels chosen from 15-color images of cycle 3 imaging. The individual images were presented on the right side of il. Synaptophysin in each cycle was used as a fiducial marker. All scale bars; 30 μm.

Comment in

Similar articles

Cited by

References

    1. Zimmermann, T., Marrison, J., Hogg, K. & O’Toole, P. In Confocal Microscopy: Methods and Protocols (ed. Paddock, S. W.) 129–148 (Springer New York, 2014). - PubMed
    1. Zimmermann, T., Rietdorf, J. & Pepperkok, R. Spectral imaging and its applications in live cell microscopy. FEBS Lett. 10.1016/S0014-5793(03)00521-0 (2003). - PubMed
    1. Valm AM, et al. Applying systems-level spectral imaging and analysis to reveal the organelle interactome. Nature. 2017;546:162–167. doi: 10.1038/nature22369. - DOI - PMC - PubMed
    1. Gorris, M. A. J. et al. Eight-color multiplex immunohistochemistry for simultaneous detection of multiple immune checkpoint molecules within the tumor microenvironment. J. Immunol. 10.4049/jimmunol.1701262 (2018). - PubMed
    1. Chen, K., Yan, R., Xiang, L. & Xu, K. Excitation spectral microscopy for highly multiplexed fluorescence imaging and quantitative biosensing. Light Sci. Appl. 10, 97 (2021). - PMC - PubMed

Publication types