. 2022 May 5;12(1):7374.
doi: 10.1038/s41598-022-10670-6.

Climate change and modernization drive structural realignments in European grain production

Affiliations

Climate change and modernization drive structural realignments in European grain production

Z Pinke et al. Sci Rep. .

Abstract

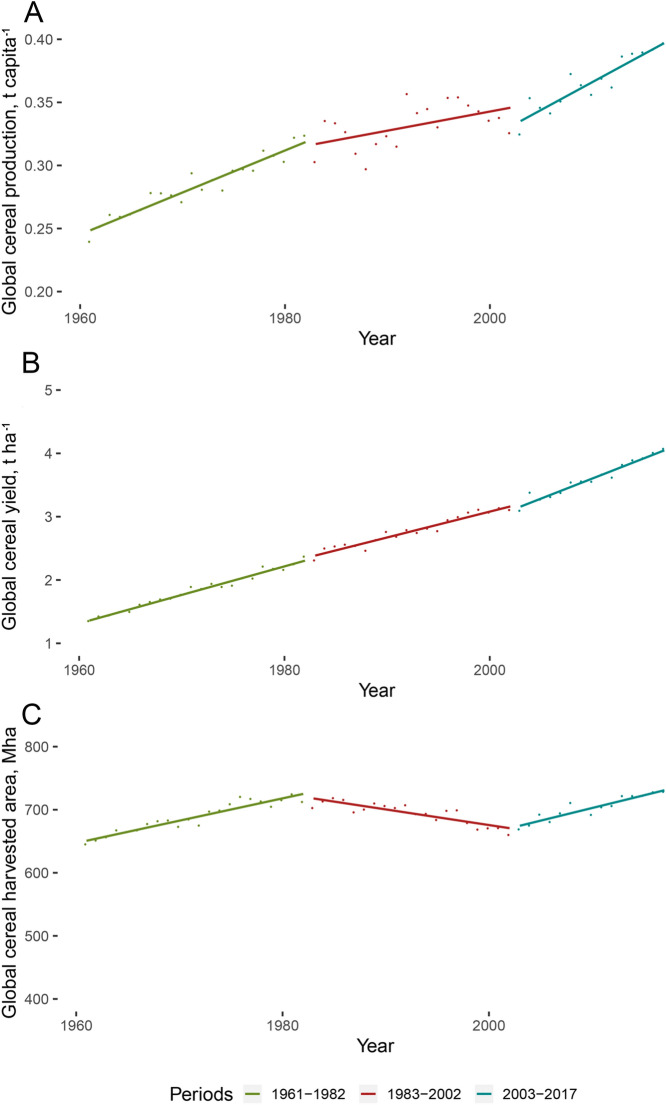
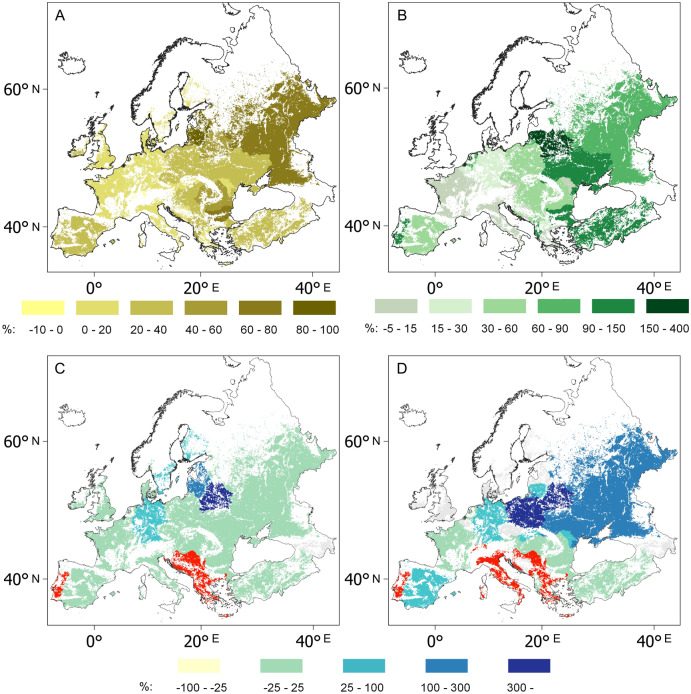
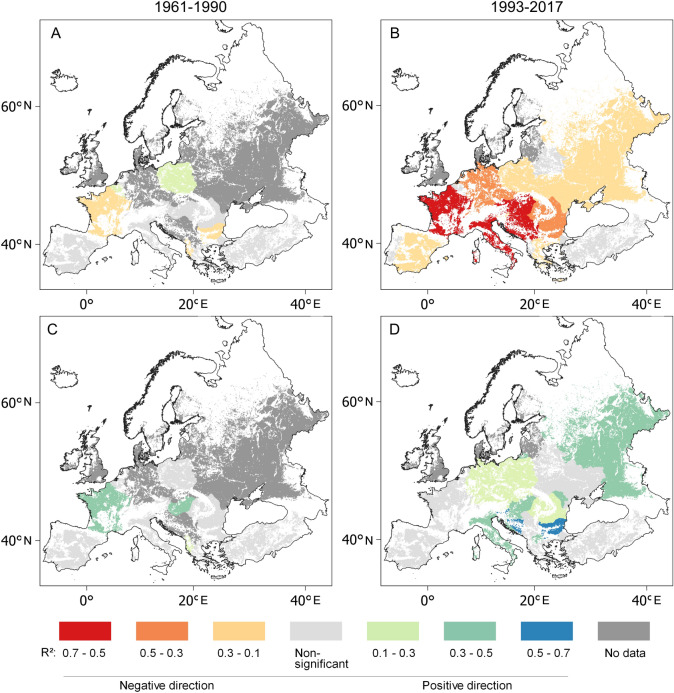
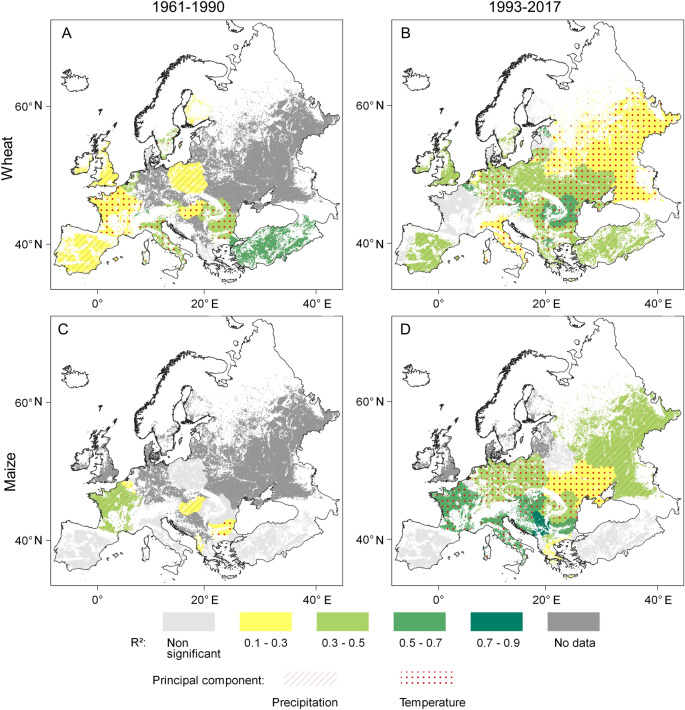
Charting the long-term trends in European wheat and maize yields and harvested areas and the relation of yields to climatic and economic drivers, two profound spatial processes become apparent. One consequence of the relatively late modernization of Eastern Europe has been to shift the focus of grain production from West to East. The warming trend prevailing over the past decades in the summer and winter seasons has been accompanied by a South to North shift in the harvested areas. The combination of these two processes has meant that the north-eastern sector of the European grain chessboard has emerged as the main beneficiary. There, the relatively low sensitivity of cereals to climatic change plus high economic growth rates have been accompanied by the most dynamic increases in cereal yields on the continent. As a result, a modern version of the 3000 year-old grain distribution system of the Ancient World is being restored before our eyes. One noteworthy finding is that increasing January-March temperatures have had a significant positive impact on wheat yields from Northern to South-Eastern Europe, and this is, at least in part, compensating for the negative impact of summer warming.


Conflict of interest statement

The authors declare no competing interests.

Figures

Figure 1
Figure 1
Phases in the changing rates of increase in year-to-year world cereal production per capita (A), global average of cereal yields (tonne per hectare) (B) and global area under cereal cultivation (C) (1961–2017). Mha = million hectares. Data source: FAOSTAT and World Bank.
Figure 2
Figure 2
Rank table changes of (A) wheat and (B) maize yields (t ha−1) in the 15 biggest European producers between the periods 1993–1997 and 2013–2017. Green lines indicate the three countries with the highest yield growth and red lines the three countries with the lowest yield growth. Supplementary Figs. S1 and S2 show the total European yield rankings. Data sources: FAOSTAT.
Figure 3
Figure 3
Country-by-country growth rates (%) in wheat (A) and maize yields (B), and wheat (C) and maize harvested areas (D) in Europe between 1993–1997 and 2013–2017 (1993–1997 = 100%). Data source: FAOSTAT, blank map source: Eurostat GISCO, software: QGIS 3.10.
Figure 4
Figure 4
Country-by-country growth rates (%) of GDP per capita (A), with the coefficients of determination (R2) between national growth rates of GDP per capita and wheat (B) and maize yields (C) in the European countries in the period 1993–2017. Direction and significance of mean temperature trends in the European countries between 1993 and 2017. Calculations performed for 0.1° × 0.1° grid cells. N: negative direction; P: positive direction; S: significant; NS: non-significant. Data source: FAOSTAT, World Bank and CRU TS 4.04, blank map source: Eurostat GISCO, software: QGIS 3.10.
Figure 5
Figure 5
Coefficients of determination (R2) between the first-differences of May–July mean temperature and wheat yields for (A) 1961–1990 and (B) 1993–2017; between the first-differences of January–March mean temperature and wheat yields for (C) 1961–1990 and (D) 1993–2017; between the first-differences of September–July precipitation sums and wheat yields for (E) 1961–1990 and (F) 1993–2017 in European croplands. Data source: FAOSTAT3 and CRU TS 4.04, blank map source: Eurostat GISCO, software: QGIS 3.10.
Figure 6
Figure 6
Coefficients of determination (R2) between the first-differences of July–August max temperature and maize yields for (A) 1961–1990 and (B) 1993–2017, as well as between May–August precipitation sums and maize yields for (C) 1961–1990 and (D) 1993–2017 in European croplands. Data source: FAOSTAT3 and CRU TS 4.04, blank map source: Eurostat GISCO, software: QGIS 3.10.
Figure 7
Figure 7
Coefficients of determination (R2) between the first-differences of the combined explanatory factors of the averages of May–July mean temperature and September–July precipitation sum and wheat yields for (A) 1961–1990 and (B) 1993–2017, as well as between the combined explanatory factor of the averages of July–August max temperature and May–August precipitation sums and maize yields for (C) 1961–1990 and (D) 1993–2017 in European croplands. Data source: FAOSTAT and CRU TS 4.04, blank map source: Eurostat GISCO, software: QGIS 3.10.

References

    1. WHO & FAO. Diet, nutrition and the prevention of chronic diseases. (2003). - PubMed
    1. Shewry PR, Hey SJ. The contribution of wheat to human diet and health. Food Energy Secur. 2015;4:178–202. doi: 10.1002/fes3.64. - DOI - PMC - PubMed
    1. FAO. Faostat: Cereals; Crops and livestock products export quantity. http://www.fao.org/faostat/en/#data/QC; http://www.fao.org/faostat/en/%23data/TP. (2022).
    1. Nuss ET, Tanumihardjo SA. Maize: A paramount staple crop in the context of global nutrition. Compr. Rev. Food Sci. Food Saf. 2010;9:417–436. doi: 10.1111/j.1541-4337.2010.00117.x. - DOI - PubMed
    1. Svanidze M, Đurić I. Global wheat market dynamics: What is the role of the EU and the Black Sea wheat exporters? Agriculture. 2021;11:799. doi: 10.3390/agriculture11080799. - DOI

Publication types