A database of calculated solution parameters for the AlphaFold predicted protein structures
- PMID: 35513443
- PMCID: PMC9072687
- DOI: 10.1038/s41598-022-10607-z
A database of calculated solution parameters for the AlphaFold predicted protein structures
Abstract
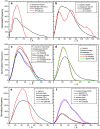
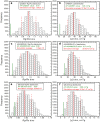
Recent spectacular advances by AI programs in 3D structure predictions from protein sequences have revolutionized the field in terms of accuracy and speed. The resulting "folding frenzy" has already produced predicted protein structure databases for the entire human and other organisms' proteomes. However, rapidly ascertaining a predicted structure's reliability based on measured properties in solution should be considered. Shape-sensitive hydrodynamic parameters such as the diffusion and sedimentation coefficients ([Formula: see text], [Formula: see text]) and the intrinsic viscosity ([η]) can provide a rapid assessment of the overall structure likeliness, and SAXS would yield the structure-related pair-wise distance distribution function p(r) vs. r. Using the extensively validated UltraScan SOlution MOdeler (US-SOMO) suite, a database was implemented calculating from AlphaFold structures the corresponding [Formula: see text], [Formula: see text], [η], p(r) vs. r, and other parameters. Circular dichroism spectra were computed using the SESCA program. Some of AlphaFold's drawbacks were mitigated, such as generating whenever possible a protein's mature form. Others, like the AlphaFold direct applicability to single-chain structures only, the absence of prosthetic groups, or flexibility issues, are discussed. Overall, this implementation of the US-SOMO-AF database should already aid in rapidly evaluating the consistency in solution of a relevant portion of AlphaFold predicted protein structures.
© 2022. The Author(s).
Conflict of interest statement
The authors declare no competing interests.
Figures


Similar articles
-
AlphaFold-predicted protein structures and small-angle X-ray scattering: insights from an extended examination of selected data in the Small-Angle Scattering Biological Data Bank.J Appl Crystallogr. 2023 Jul 20;56(Pt 4):910-926. doi: 10.1107/S1600576723005344. eCollection 2023 Aug 1. J Appl Crystallogr. 2023. PMID: 37555230 Free PMC article.
-
Beyond the US-SOMO-AF database: a new website for hydrodynamic, structural, and circular dichroism calculations on user-supplied structures.Eur Biophys J. 2023 Jul;52(4-5):225-232. doi: 10.1007/s00249-023-01636-1. Epub 2023 Feb 28. Eur Biophys J. 2023. PMID: 36853343 Free PMC article.
-
Recent advances in the UltraScan SOlution MOdeller (US-SOMO) hydrodynamic and small-angle scattering data analysis and simulation suite.Eur Biophys J. 2018 Oct;47(7):855-864. doi: 10.1007/s00249-018-1296-0. Epub 2018 Mar 28. Eur Biophys J. 2018. PMID: 29594411
-
Unveiling the influence of fastest nobel prize winner discovery: alphafold's algorithmic intelligence in medical sciences.J Mol Model. 2025 May 19;31(6):163. doi: 10.1007/s00894-025-06392-x. J Mol Model. 2025. PMID: 40387957 Review.
-
An Overview of Alphafold's Breakthrough.Front Artif Intell. 2022 Jun 9;5:875587. doi: 10.3389/frai.2022.875587. eCollection 2022. Front Artif Intell. 2022. PMID: 35757294 Free PMC article. Review.
Cited by
-
DENSS-multiple: A structure reconstruction method using contrast variation of small-angle neutron scattering based on the DENSS algorithm.BBA Adv. 2022 Nov 8;2:100063. doi: 10.1016/j.bbadva.2022.100063. eCollection 2022. BBA Adv. 2022. PMID: 37082592 Free PMC article.
-
AlphaFold-predicted protein structures and small-angle X-ray scattering: insights from an extended examination of selected data in the Small-Angle Scattering Biological Data Bank.J Appl Crystallogr. 2023 Jul 20;56(Pt 4):910-926. doi: 10.1107/S1600576723005344. eCollection 2023 Aug 1. J Appl Crystallogr. 2023. PMID: 37555230 Free PMC article.
-
Resolving the conformational ensemble of a membrane protein by integrating small-angle scattering with AlphaFold.PLoS Comput Biol. 2025 Jun 27;21(6):e1013187. doi: 10.1371/journal.pcbi.1013187. eCollection 2025 Jun. PLoS Comput Biol. 2025. PMID: 40577488 Free PMC article.
-
AlphaFold, Artificial Intelligence (AI), and Allostery.J Phys Chem B. 2022 Sep 1;126(34):6372-6383. doi: 10.1021/acs.jpcb.2c04346. Epub 2022 Aug 17. J Phys Chem B. 2022. PMID: 35976160 Free PMC article. Review.
-
Bead model hydrodynamics: an in-depth comparison between GRPY and ZENO.Eur Biophys J. 2025 May 29. doi: 10.1007/s00249-025-01758-8. Online ahead of print. Eur Biophys J. 2025. PMID: 40439710
References
MeSH terms
Substances
Associated data
Grants and funding
LinkOut - more resources
Full Text Sources
Other Literature Sources
Research Materials

