. 2022 May 5;13(1):2488.
doi: 10.1038/s41467-022-30239-1.

Spindle motility skews division site determination during asymmetric cell division in Physcomitrella

Affiliations

Spindle motility skews division site determination during asymmetric cell division in Physcomitrella

Elena Kozgunova et al. Nat Commun. .

Abstract

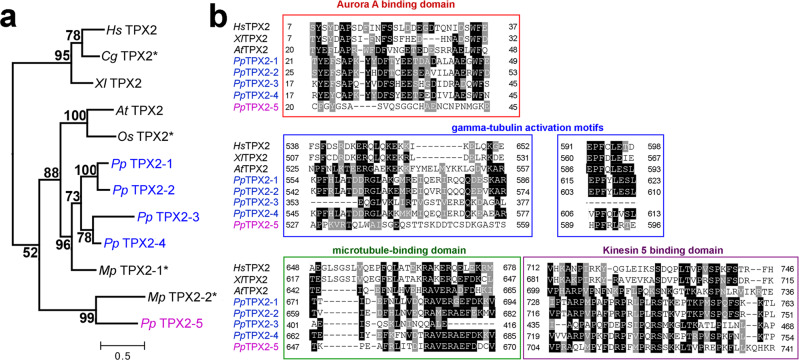
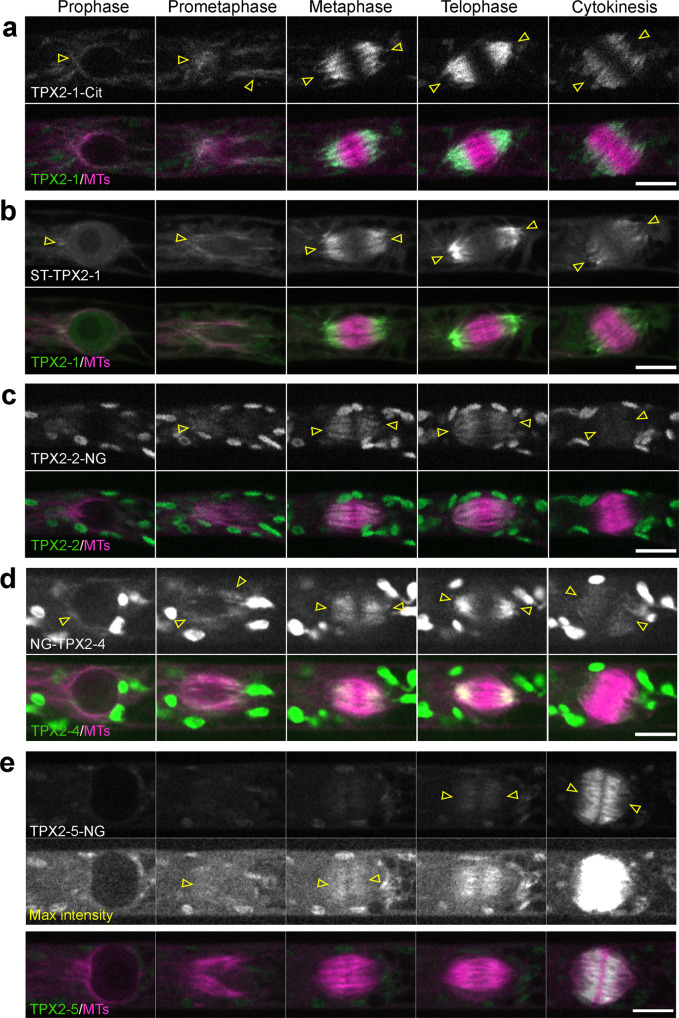
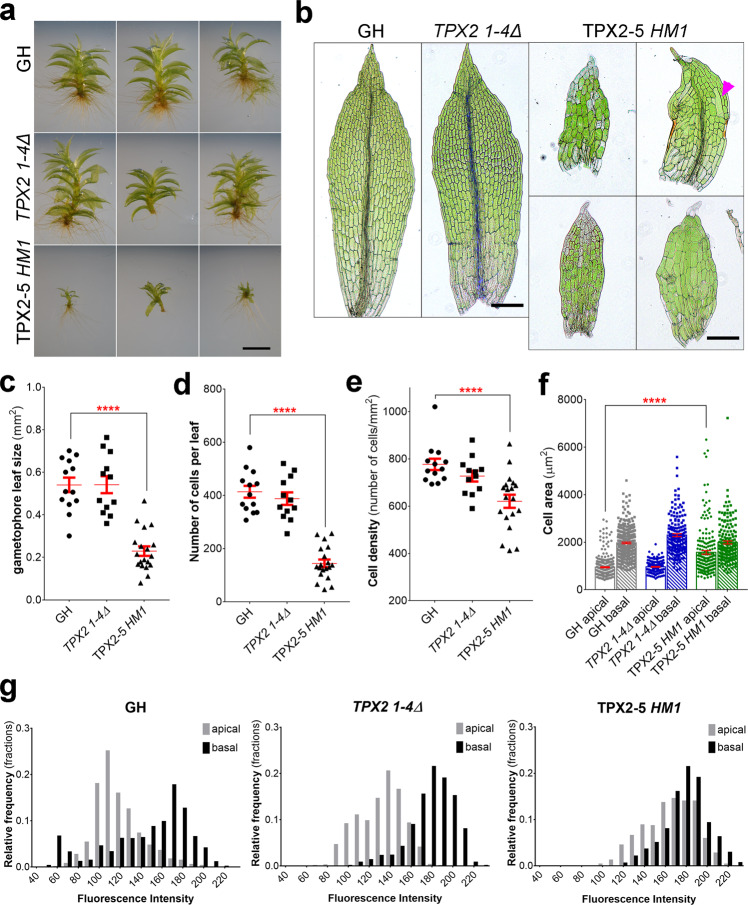
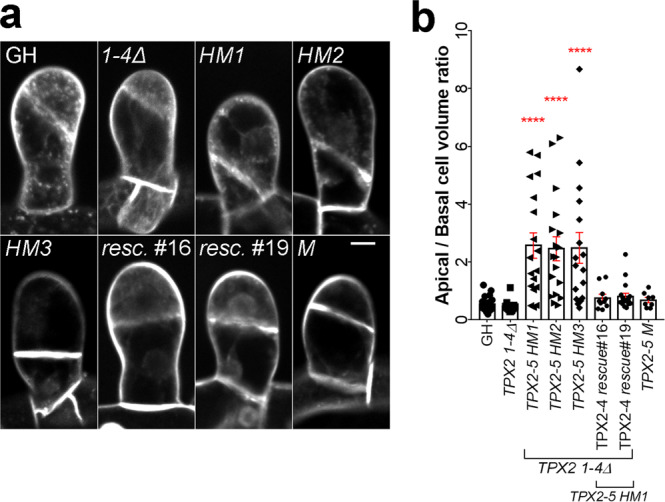
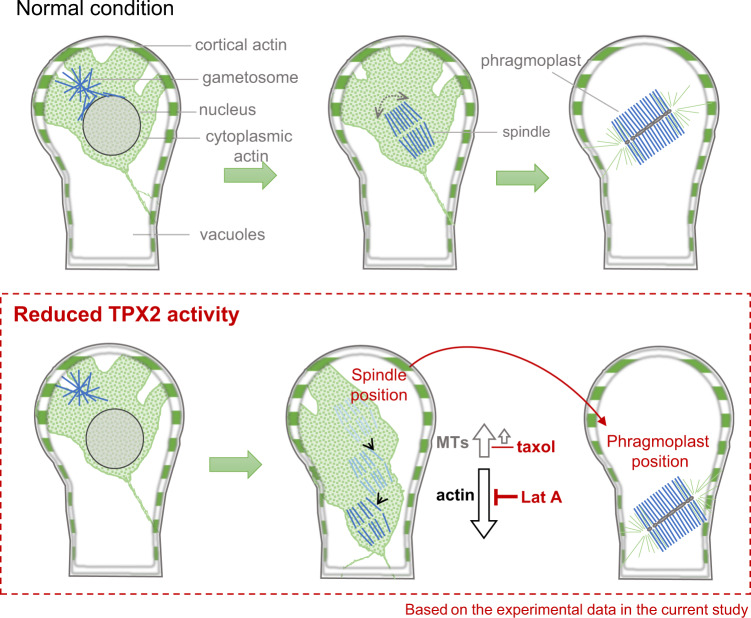
Asymmetric cell division (ACD) underlies the development of multicellular organisms. In animal ACD, the cell division site is determined by active spindle-positioning mechanisms. In contrast, it is considered that the division site in plants is determined prior to mitosis by the microtubule-actin belt known as the preprophase band (PPB) and that the localization of the mitotic spindle is typically static and does not govern the division plane. However, in some plant species, ACD occurs in the absence of PPB. Here, we isolate a hypomorphic mutant of the conserved microtubule-associated protein TPX2 in the moss Physcomitrium patens (Physcomitrella) and observe spindle motility during PPB-independent cell division. This defect compromises the position of the division site and produces inverted daughter cell sizes in the first ACD of gametophore (leafy shoot) development. The phenotype is rescued by restoring endogenous TPX2 function and, unexpectedly, by depolymerizing actin filaments. Thus, we identify an active spindle-positioning mechanism that, reminiscent of acentrosomal ACD in animals, involves microtubules and actin filaments, and sets the division site in plants.


Conflict of interest statement

The authors declare no competing interests.

Figures

Fig. 1
Fig. 1. TPX2 homologs in P. patens.
a Phylogenetic analysis revealed two distinct groups of TPX2 proteins in P. patens: Pp TPX2-1 to −4 (blue), which are more similar to TPX2 genes from seed plants, and atypical TPX2-5 (magenta). Asterisks mark predicted proteins, numbers show bootstrap values. Bar, 0.5 amino acid substitutions per site. Note that AtTPX2L3 and AtTPX2L2 were not added to this tree, since they lack the C-terminal region that is conserved in canonical TPX2 proteins. Hs: Homo sapiens, Gg: Gallus gallus, Xl: Xenopus laevis, At: Arabidopsis thaliana, Os: Oryza sativa, Pp: Physcomitrium patens, Mp: Marchantia polymorpha. b Alignment of TPX2 proteins. Conserved residues are boxed, whereas similar amino acids are hatched.
Fig. 2
Fig. 2. Localization of TPX2 proteins during mitosis.
Live-cell imaging was performed in caulonemal apical cells of P. patens, expressing mCherry-tubulin and one of the following TPX2 proteins endogenously tagged with a fluorophore: a TPX2-1-Citrine; b SunTag-TPX2-1; c TPX2-2-mNeonGreen; d mNeonGreen-TPX2-4; e TPX2-5-mNeonGreen. The SunTag-TPX2-1 line also expressed scFv-GCN-sfGFP under a β-estradiol-inducible promoter. Localization was observed in 2 independent experiments with similar results. Arrowheads indicate the fluorescent tag-based signals, whereas other ellipsoidal signals outside the spindle/nucleus represent autofluorescent chloroplasts. Bars, 10 µm.
Fig. 3
Fig. 3. Abnormal gametophore and leaf development in the TPX2-5 HM1 mutant.
a Representative images of gametophores after 4 weeks of culture of GH (control), TPX2 1-4Δ, and TPX2-5 HM1 lines. Brightness/contrast have been linearly adjusted. An extended version is presented in Supplementary Fig. 3. Experiment was repeated three times with similar results. Bar, 2 mm. b Representative images of gametophore leaves of GH, TPX2 1-4Δ, and TPX2-5 HM1 lines. The magenta arrowhead indicates abnormally large cell occasionally observed in the TPX2-5 HM1 line. Bar, 200 µm. c Gametophore leaf size (mm2), d number of cells per leaf, e cell density (number of cells per mm2), f cell area (µm2) of the apical and basal sides of the gametophore, measured in gametophore leaves collected after 3 weeks of culture with n = 13, 12, and 19 for GH, TPX2 1-4Δ, and TPX2-5 HM1 lines, respectively (mean ± SEM, ****p = 0.0001 by one way ANOVA with Dunnett’s multiple comparison test against GH). Apical and basal sides correspond to 1/3 of leaf length at the tip and at the base, respectively. g Quantification of the nuclear DNA content in the interphase nucleus of gametophore leaf cells (from apical and basal sides). DNA amounts were measured as fluorescence intensity (arbitrary unit) of the DAPI-stained nuclei per cell without background subtraction. GH and TPX2 1-4Δ lines have two ploidy peaks corresponding to apical and basal sides of gametophore leaves; In the TPX2-5 HM1 line, the difference in ploidy is less pronounced.
Fig. 4
Fig. 4. Abnormal cell plate positioning in the gametophore initials of the TPX2-5 hypomorphic mutants.
a Gametophore initial at the 2-cell stage stained with FM4-64 dye. Bar, 10 µm. b The apical/basal cell volume ratio was estimated as the apical cell volume divided by the basal cell volume, measured during the 2-cell stage (mean ± SEM, ****p = 0.0001 by one way ANOVA with Dunnett’s multiple comparison test against GH). n = 22, 15, 18, 18, 17, 10, 18, and 8 for GH, TPX2 1-4Δ, TPX2-5 HM1, TPX2-5 HM2, TPX2-5 HM3, TPX2-4 rescue#16, TPX2-4 rescue#19 and TPX2-5 M.
Fig. 5
Fig. 5. Spindle position is actively maintained through the interplay between microtubules and F-actin.
a Live-cell imaging of the first asymmetric division in the gametophore initial. The positions of the nucleus and gametosome (prophase MTOC appeared in the apical cytoplasm) are indicated with yellow circles and red arrowheads, respectively. Cyan lines show the position and orientation of the phragmoplast. Cell borders are outlined with white lines. Live-cell imagining was repeated three times with similar results. Bar, 10 µm. b The frequency and type of spindle defects in gametophore initial mitosis observed in GH (control), TPX2 1-4Δ, and TPX2-5 HM1 lines. Numbers within the columns indicate number of cells with corresponding phenotypes. c Area occupied by the metaphase spindle (spindle size) in gametophore initials measured by manually tracking spindle borders from Z-projection, n = 9, 12, and 15 for GH, TPX2 1-4Δ and TPX2-5 HM1 lines, respectively. (mean ± SEM; **p = 0.0029, two-tailed Student’s t-test). d Tracking of the spindle center position from NEBD to anaphase onset. We assigned the starting position as Y = 0 and different X positions for each sample group. Note, that after 5 µM latrunculin A treatment, spindles never showed motility towards the basal end of the cell, i.e., negative Y-values. Each line represents spindle movement in a single cell. More than 12 cells were observed for each sample group in three or more independent experiments. e Maximum spindle speed (µm/min), f average spindle speed (µm/min), and g distance traveled by the spindle (µm) in the TPX2-5 HM1 cell line under various treatments. Total number of cells observed, including those without spindle motility: n = 23 (10 µM taxol), 16 (200 nM oryzalin), and 20 (control DMSO, with which the stock solution of taxol, oryzalin, and latrunculin A were prepared). Only spindle motility towards the basal end of the cell was analyzed. Bars represent mean ± SEM.
Fig. 6
Fig. 6. Actin is present in the cytoplasm and cortex during spindle motility in the TPX2-5 HM1 line.
a Live-cell imaging of Citrine-F-tractin (actin, green) during the first asymmetric division in the gametophore initial cells also expressing mCherry-tubulin (magenta, MTs). TPX2-5 HM1 cells additionally expressed mCherry-tubulin/H2B-RFP (magenta, chromosomes), which was brighter than mCherry-tubulin. Maximum intensity projection of Citrine-F-tractin (20 µm with 2.5 µm steps) and single focal frame of mCherry-tubulin were merged in the “Z-projection” panels. Three Z frames are also presented (z = 3, 5, and 7). Yellow arrowheads indicate filamentous or punctate signals of cytoplasmic actin. Time 0 (min) was set at NEBD. Bar, 10 µm. b Relative actin fluorescent intensity (basal/apical poles). Mean gray values of Citrine-f-tractin were measured at the apical and basal pole of the spindle in a square of a fixed size (8 × 4 µm) for each of the Z-slices and summed to get intensity at each pole. Dots of the same color represent measurements obtained from the same cell at different time points (n = 6 and 8 for wild-type and TPX2-5 HM1, respectively).
Fig. 7
Fig. 7. TPX2 contributes to microtubule amplification in early mitosis.
a Representative images of the mitosis of protonemal apical cells in GH (control), TPX2 1-4Δ, TPX2-55’UTR RNAi, and TPX2-5exon RNAi lines. Time 0 (min) was set at NEBD. Green, GFP-tubulin; Magenta, histoneH2B-mRFP. Bar, 10 µm. b Mitotic duration calculated from NEBD to anaphase onset (mean ± SEM; ****p < 0.0001, two-tailed Student’s t-test). Live-cell imagining was repeated three times with similar results. c Nucleus shape prior to NEBD, measured as a ratio of nucleus length to nucleus width (mean ± SEM; ****p < 0.0001, two-tailed Student’s t-test). d Frequency and type of mitotic defects observed. Numbers within the columns indicate number of cells with corresponding phenotypes. Bar, 10 µm. e Fluorescence intensity of perinuclear MTs (mean ± SEM; **p = 0.0011, ***p = 0.0002; two-tailed Student’s t-test). A.U. stands for Arbitrary Units. f Fluorescence intensity of MTs in the prometaphase spindle (4 min after NEBD) and metaphase spindle (2 min before anaphase onset), measured from a single focal plane, with the cytoplasmic background subtracted. A decrease in fluorescence intensity was detected in prometaphase, but not in metaphase spindles (mean ± SEM **p = 0.0018, ****p = 0.00002, ***p = 0.0008; two-tailed Student’s t-test). For graphs bf, number of independent cells observed n = 20 for GH and TPX2 1-4Δ lines, n = 21 for TPX2-55’UTR, and n = 22 for TPX2-5exon RNAi lines.
Fig. 8
Fig. 8. Schematic representation of the spindle impact on phragmoplast position and orientation in the gametophore initial cells of P. patens.
The upper panel shows the first asymmetric division of gametophore initial in wild-type cells. Spindle, consisting of microtubules, drives chromosome segregation and cell plate expansion. Cytoplasmic actin surrounds the nucleus before nuclear envelope breakdown and the spindle in early mitosis. During cytokinesis, cytoplasmic actin localizes to the phragmoplast. The bottom panel summarizes the findings of the present study and the role of the microtubule-associated protein TPX2 in spindle positioning. In the scenario where TPX2 function is reduced, the spindle can be transported to the bottom of the gametophore initial cell, compromising the cell plate position and daughter cell ratios in asymmetric cell division. The cytoplasm changes its position together with the moving spindle, and spindle motility is completely inhibited by depolymerizing actin filaments with latrunculin A (Lat A). Stabilizing microtubules with taxol could partially counteract spindle transport, suggesting that under normal conditions, microtubules are able to fix the spindle position against actin force.

Similar articles

Cited by

References

    1. Kiyomitsu T. The cortical force-generating machinery: How cortical spindle-pulling forces are generated. Curr. Opin. Cell Biol. 2019;60:1–8. doi: 10.1016/j.ceb.2019.03.001. - DOI - PubMed
    1. Bergstralh DT, Dawney NS, Johnston DS. Spindle orientation: A question of complex positioning. Development. 2017;5:1137–1145. doi: 10.1242/dev.140764. - DOI - PubMed
    1. Verma DPS. Cytokinesis and building the cell wall in plants. Annu. Rev. Plant Physiol. 2001;52:751–784. doi: 10.1146/annurev.arplant.52.1.751. - DOI - PubMed
    1. Rasmussen CG, Bellinger M. An overview of plant division-plane orientation. N. Phytol. 2018;219:505–512. doi: 10.1111/nph.15183. - DOI - PubMed
    1. Buschmann H, Müller S. Update on plant cytokinesis: Rule and divide. Curr. Opin. Plant Biol. 2019;52:97–105. doi: 10.1016/j.pbi.2019.07.003. - DOI - PubMed

Publication types