. 2022 May 5;13(1):2484.
doi: 10.1038/s41467-022-30210-0.

Developmental mRNA m5C landscape and regulatory innovations of massive m5C modification of maternal mRNAs in animals

Affiliations

Developmental mRNA m5C landscape and regulatory innovations of massive m5C modification of maternal mRNAs in animals

Jianheng Liu et al. Nat Commun. .

Abstract

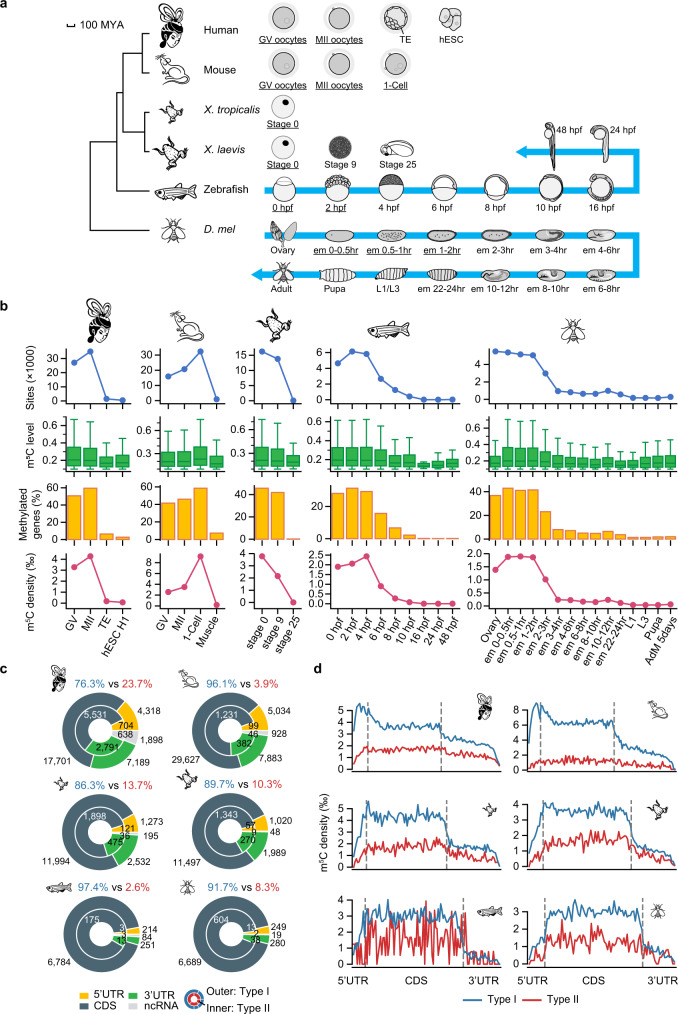
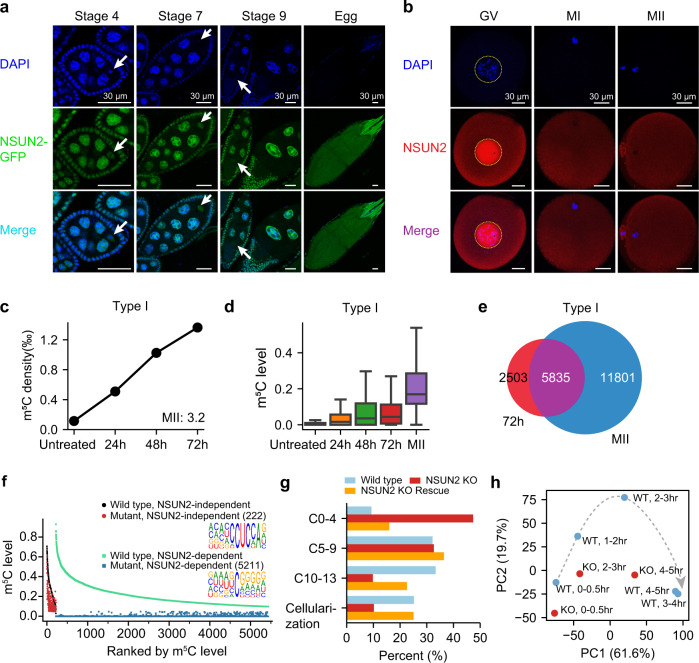
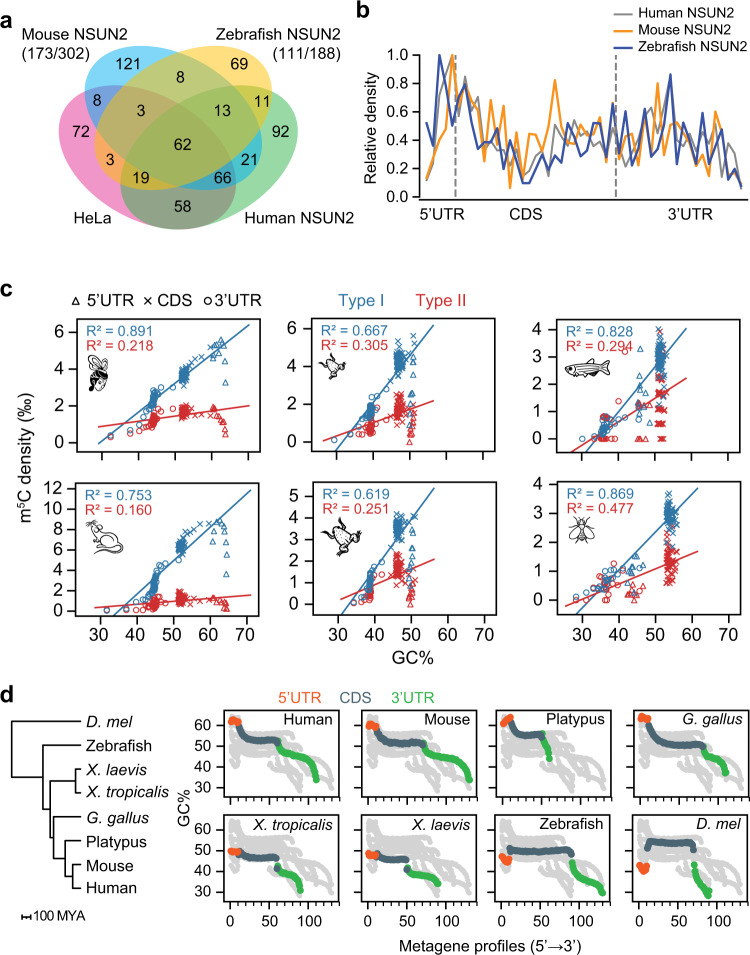
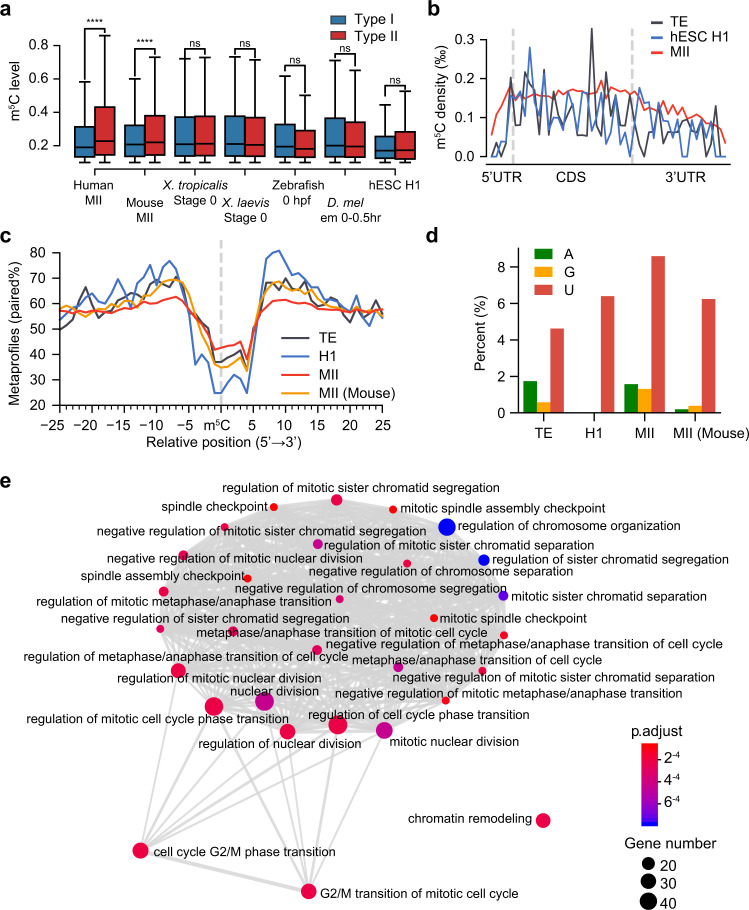
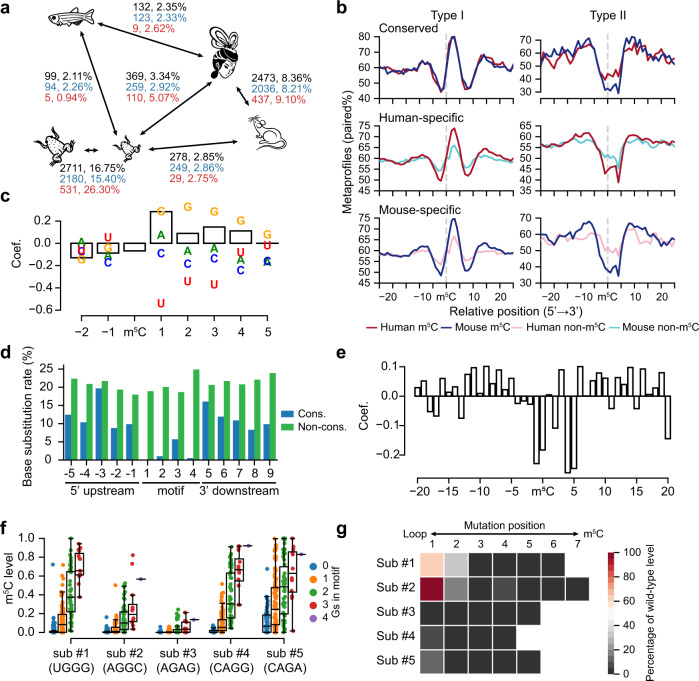
m5C is one of the longest-known RNA modifications, however, its developmental dynamics, functions, and evolution in mRNAs remain largely unknown. Here, we generate quantitative mRNA m5C maps at different stages of development in 6 vertebrate and invertebrate species and find convergent and unexpected massive methylation of maternal mRNAs mediated by NSUN2 and NSUN6. Using Drosophila as a model, we reveal that embryos lacking maternal mRNA m5C undergo cell cycle delays and fail to timely initiate maternal-to-zygotic transition, implying the functional importance of maternal mRNA m5C. From invertebrates to the lineage leading to humans, two waves of m5C regulatory innovations are observed: higher animals gain cis-directed NSUN2-mediated m5C sites at the 5' end of the mRNAs, accompanied by the emergence of more structured 5'UTR regions; humans gain thousands of trans-directed NSUN6-mediated m5C sites enriched in genes regulating the mitotic cell cycle. Collectively, our studies highlight the existence and regulatory innovations of a mechanism of early embryonic development and provide key resources for elucidating the role of mRNA m5C in biology and disease.


Conflict of interest statement

The authors declare no competing interests.

Figures

Fig. 1
Fig. 1. Maternal mRNAs are methylated to an unprecedented extent in both vertebrate and invertebrate species by NSUN2 and NSUN6.
a Phylogenic tree (left) and sampled developmental stages of the species in this study (right). The mammals separated from frogs, zebrafish, and D. mel about 352, 435, and 797 mya, respectively. The divergence between humans and mice is estimated to be 90 mya and the divergence of the two frog species is estimated to be 57 mya. Stages in which mRNAs were largely transcribed from the maternal genome are underlined. For humans and mice: GV germinal vesicle, MII Metaphase II, TE trophectoderm, hESC human embryonic stem cell, 1-cell 1-cell embryo. For zebrafish: hpf, hours post-fertilization. For D. mel: em embryo, L larva, hr hour. Zebrafish embryo images were adapted from Webb et al., 2006; adult zebrafish images were adapted from Kimmel et al.,1995; fly ovary image was adapted from AVILéS et al., 2018; other fly sample images were adapted from Wolpert et al., 2015. b The number and methylation level of m5C sites, the percentage of transcribed genes with m5C sites, and the density of m5C sites in the samples we profiled. The density was defined as the number of m5C sites per thousand Cs that are covered by at least 20 reads. The mouse muscle sample that has the highest m5C level in adult tissues was selected to represent the zygotic mRNA m5C pattern. AdM, adult male; H1, hESC H1 line. Boxplots: 25th to 75th percentiles (boxes), medians (horizonal lines), and 1.5 times of the interquartile range (whiskers). The number of data points are provided in Source Data. Numbers of biological replicates are provided in Supplementary Fig. 1. c Genic locations of maternal m5C sites in each species. The number of m5C sites and the percentages of Type I and Type II sites are indicated. d The distribution of maternal m5C sites along the transcripts in different species. In this analysis, each m5C site was binned and the m5C density of each bin was calculated (Methods). Bin numbers were based on average lengths among transcripts in different species. Bin numbers (5'UTR:CDS:3'UTR): humans, 10:50:40; mice, 10:60:50; X. tropicalis, 10:60:40; X. laevis, 10:60:30; zebrafish, 10:80:30; D. mel, 10:60:20. Source data are provided as a Source Data file.
Fig. 2
Fig. 2. The deposition of mRNA m5C in oocytes and the in vivo functions of NSUN2 in early embryogenesis.
a Representative images of egg chambers at different stages for D. mel expressing a GFP-NSUN2 fusion protein under the control of its native promoter. DNA was stained with DAPI (blue). Arrows indicate the germ cell that will become the oocyte. The localization of NSUN2 was consistent in all samples of each stage (n = 12, 14, 17, 20). Scale bars, 30 μm. b Representative images of human GV/MI/MII oocytes stained with anti-NSUN2 antibody. 11 GV, 14 MI, and 14 MII oocytes were stained, and the NSUN2 localization was consistent in all oocytes examined. Scale bars, 30 μm. c, d The densities (c) and levels (d) of Type I m5C sites in HeLa cells treated with nocodazole for 0, 24, 48, and 72 h (1 sample per time point). In panel d, a union of sites with levels ≥10% in at least one sample was used for analysis (n = 5039). The density of mRNA m5C sites in MII oocytes is indicated in c. Boxplots: 25th to 75th percentiles (boxes), medians (horizonal lines), and 1.5 times of the interquartile range (whiskers). e Overlaps of Type I mRNA m5C sites between HeLa cells treated with nocodazole for 72 h and MII oocytes. f Comparison of m5C methylation levels in the ovaries between wild-type flies and NSUN2 knockout flies. Type I and Type II m5C sites were shown separately. g Quantification of the percentage of 0–2 h embryos that were in different stages of embryogenesis. Embryos were grouped into four stages: within four cleavage cycles, 5–9 cycles, 10-13 cycles, cellularization (as shown in Supplementary Fig. 9c). The first independent experiment on mutant #1 line was shown. The numbers of flies used are provided in Source Data. h PCA showing the first two PCs, which together explain 82.6% of the variance in the transcriptome data. The amount of variance explained by each PC is indicated on each axis. Wild-type and maternal NSUN2 knockout embryos are colored blue and red, respectively. Source data are provided as a Source Data file.
Fig. 3
Fig. 3. Cis-regulatory innovation leads to the gain of 5' end Type I sites in higher animals.
a Venn diagram showing the overlaps of Type I sites identified in wild-type HeLa cells and NSUN2 knockout HeLa cells expressing human, mouse, and zebrafish NSUN2 individually. Only sites that are covered by at least 20 reads in all samples were analyzed. The number of Type I sites overlapped with HeLa or human NSUN2 against the total number of Type I sites methylated by mouse or zebrafish NSUN2 was shown in parentheses. b The distribution of Type I m5C sites in NSUN2 knockout HeLa cells expressing human, mouse, and zebrafish NSUN2 individually. The density was first calculated as in Fig. 1d and then normalized to the bin with the highest density. c The relationship between maternal m5C density and GC content of the transcriptome. In this analysis, each maternal m5C site was binned as in Fig. 1d and the m5C density and GC content of each bin was calculated and plotted. Type I and Type II sites were calculated separately and Pearson correlation coefficient of determination is indicated. d Metagenomic analysis of GC contents in different species. With the investigation of more representative vertebrate species, we found that the 5' end high GC content was obtained in the common ancestor of birds and mammals. Source data are provided as a Source Data file.
Fig. 4
Fig. 4. Trans-regulatory innovation leads to the gain of thousands of human-specific Type II sites.
a Comparison of the levels of Type I and Type II sites in selected samples that represent maternal mRNA methylation status in different species and in hESC H1 that represents human zygotic mRNA methylation status. Note that in mouse oocyte samples, only 3.9% of the sites were Type II sites. Boxplots: 25th to 75th percentiles (boxes), medians (horizonal lines), and 1.5 times of the interquartile range (whiskers). The P-values were calculated using one-sided Student’s t-test. ****p < 0.0001; ns, not significant. From left to right: Type I sites: 26625, 19652, 15994, 14554, 4557, 4907, 312; Type II sites: 8388, 1042, 2530, 1679, 138, 482, 125; P-values: 2.61e-151, 0.184, 1.18e-6, 0.527, 0.931, 0.93, 0.914. b The distribution of Type II m5C sites in human MII oocytes, hESC H1, and human TE. The density was first calculated as in Fig. 1d and then normalized to the bin with the highest density. c The metaprofiles of the secondary structure of Type II m5C sites and flanking regions in human MII oocytes, hESC H1, human TE, and mouse MII oocytes. d Base composition at position +3 of the core motif for Type II sites in human MII oocytes, hESC H1, human TE, and mouse MII oocytes. e Enrichment map plot (see Methods) for genes that were only regulated by NSUN6 in human MII oocytes. The top 30 terms were shown. Source data are provided as a Source Data file.
Fig. 5
Fig. 5. Sequence- and structure- dependent evolution of mRNA m5C.
a Pairwise comparison showing the numbers and percentages of conserved m5C sites between vertebrate species. The lengths of lines are proportional to the divergence times between species. The numbers and percentages of all m5C sites (black), Type I m5C sites (blue), and Type II m5C sites (red) were shown separately. Samples used: humans and mice, MII oocytes; frogs, stage 0; zebrafish, 0 hpf; fly, 0–0.5 h embryos. Conserved methylation sites, m5C sites with a level ≥10 % in one species and with a level >5% in another species. Only conserved Cs covered by at least ten reads in both species were considered. b The metaprofiles of the secondary structure for conserved and non-conserved Type I and Type II m5C sites between humans and mice. Conserved, m5C sites that were methylated in both species. Human-specific or mouse-specific, m5C sites that were Cs at the DNA level in both species but only methylated in humans or mice. Samples used: human and mouse MII oocytes. c GLM coefficients of sequence and structural factors for the gain or loss of Type I sites between humans and mice (see Methods). Coefficients of the bases were shown in characters and coefficients of the structures were shown in bars. d Base substitution rates in the motif and flanking regions of conserved and non-conserved Type II sites between humans and mice. e GLM coefficients of structural features for the gain or loss of Type II sites between humans and mice. Bars on the positive Y-axis indicate that the paired status of that base is a positive factor for methylation. f The relationship between the numbers of Gs in the motifs of five Type I substrates and their m5C levels. All 256 types of motifs were tested. For each motif, the base-pairing status was maintained by the introduction of compensatory mutation. Sub, substrates. Boxplots: 25th to 75th percentiles (boxes), median (horizonal line), and 1.5 times of the interquartile range (whiskers). Numbers of data points are provided in Source Data. g The relationship between point mutations in the stems of 5 Type I substrates and their m5C levels. The position of each mutation in 5 Type I substrates was shown in Supplementary Fig. 13e. Source data are provided as a Source Data file.

Similar articles

Cited by

References

    1. Li S, Mason CE. The pivotal regulatory landscape of RNA modifications. Annu. Rev. genomics Hum. Genet. 2014;15:127–150. doi: 10.1146/annurev-genom-090413-025405. - DOI - PubMed
    1. Gilbert WV, Bell TA, Schaening C. Messenger RNA modifications: form, distribution, and function. Science. 2016;352:1408–1412. doi: 10.1126/science.aad8711. - DOI - PMC - PubMed
    1. Tan MH, et al. Dynamic landscape and regulation of RNA editing in mammals. Nature. 2017;550:249–254. doi: 10.1038/nature24041. - DOI - PMC - PubMed
    1. Roundtree IA, Evans ME, Pan T, He C. Dynamic RNA modifications in gene expression regulation. Cell. 2017;169:1187–1200. doi: 10.1016/j.cell.2017.05.045. - DOI - PMC - PubMed
    1. Eisenberg E, Levanon EY. A-to-I RNA editing—immune protector and transcriptome diversifier. Nat. Rev. Genet. 2018;19:473–490. doi: 10.1038/s41576-018-0006-1. - DOI - PubMed

Publication types